1. Introduction
The population and urbanization incensement led to increasing the quantity of runoff while decreasing in the natural infiltration, storm water runoff include sediment, nutrients, toxic substances, oxygen-demanding materials, and bacteria all of which the direct infiltration of urban runoff led to contamination of groundwater [1,2]. The benefits of storm water infiltration including the usual benefits of storm water management, the prevention of flooding and erosion, coupled with the benefit of groundwater recharge, commonly sand filtration is used as a technique for removing contaminants from water and wastewater treatment industries during the last decade [3].
AWWA [4], Torrens et al. [5], and Anderson et al. [6] stated that the successful choice of a filter media as sand filter to produce satisfactory desired pollutant removal performance depended upon the proper choice of: the depth of the filters, type of sand, sand size and distribution, conditions of influent water, quality of effluent, the filtration rate, and dosing regime and resting period duration, all affected the hydraulic performance and purification efficiency of the filters.
Torrens et al. [5] stated that the sand used as the filter medium must be fine enough to ensure the biological analyses, and coarse enough to avoid surface clogging and maintain correct aeration. Granular media that is too coarse limited the retention time to a point where adequate biological decomposition is not attained. Too fine media limits the quantity of water that may be successfully filtered due to early filter clogging [6]. Coarser sands have larger pore spaces that have high flow-through rates but pass larger suspended particles. A very fine sand has small pore spaces with slow flow-through rates and filter out smaller total suspended solids (TSS) particles [7].
There are two types of filtration in storm water treatment: rapid and slow. In the slow filtration, the media used is considered as a fine sand, and the designed rate lies between 0.1 and 0.4 m3/h per square meter of surface, the media used has size of 0.2 to 0.5 mm, according to its specifications have very low hydraulic rates, because they do not have backwash systems. In the rapid filtration used media considerably coarser with an effective grain size of 0.6 - 2.0 mm. The interstices between the grains are larger, providing less resistance to the downward flow, and thus permitting higher velocities, usually in the range 5 - 15 m3/m2/h [8].
Anderson et al. [6] summarized the mechanism process that occurs to some degree within the filter as physical, chemical, and biological treatment processes. Straining, sedimentation, inertial impaction, interception, adhesion, flocculation, diffusion, adsorption and biological ac-tivity have been suggested as mechanisms of contaminant removal in filtration. Actually, the mechanisms of removal of pollutants vary depending on the type of filter.
A physical-chemical process has occurred in rapid filter for separating suspended and colloidal impurities from water by passage through a bed of granular material, water fills the pores of the filter medium, and the impurities are adsorbed on the surface or trapped in the openings [9]. On the other side a layer of inert deposits and biological matter forms on the surface of the sand bed. This layer is referred to as the Schrnutzdecke, this layer both with biological growth within the filter bed considered as the important process of purification mechanism of slow sand filters [8-10].
Bruijn and Clark [11] concluded that there are correlations between TSS and particulate runoff concentrations of chromium, copper, and zinc, indicating that solids removal may reduce total metals concentrations, therefore specific storm water treatment goals usually specify about 80% reductions in suspended solids concentrations.
From the past experience, it is learned that biological activity decreases with reducing the filter’s depth. In other words, the biological activity is enhanced with increasing sand depths. Therefore, the viruses and other suspended and organic matter have to travel more through the sand bed and the possibility of removal of these impurities is significantly increasing. Therefore, higher removal efficiency is expected at higher sand depths [12].
2. Material and Method
2.1. Material
The sand filter used in the research study was a yellowish fine to medium clean non-plastic dune sand of high permeability, Figure 1 illustrates the sieve analysis for the sand filter, It is clear that the type is slow sand filter, as the particles ranges from 0.15 to 0.60 mm also confirm to grain size of sand in specifications (BS 1200).
According to study done by Hamdan et al. [13], that test the quality of Gaza storm water run off which is the same sample properties of collected storm water that used in research, shown that it is consider good enough for artificial recharge in terms of salinity (Cl−) and nitrate ( ), as concentrations of both were very low. Concentrations of Total Organic Carbon (TOC) were found in urban road runoff, which can be explained by minor mixing with wastewater when this floods from manholes onto road. The results of heavy metal analyses such as cadmium and lead, were found to be close to the international, regional and local standards for artificial recharge purposes.
2.2. Methodology
The aim of this paper is to investigate and to reach the optimum efficiency of using sand filter for purification of storm water, by testing in laboratory the quality of effluent of filtrated storm water samples at different depths of the sand filter media and by investigating the efficiency of purification.
A plant that used in this study was locally manufactured, Figure 2 shows a schematic diagram of the system. It isconsists of the following; 2.3 meters cylindrical PVC-U pipe with 8 inch diameter, storm water tank, motion fan to avoid the settling of sediments, overflow tank to collect the exceeded water, glass window with 5 cm width and 50 cm height to monitor the media, and 3/4 PE pipes for connection and carrying water through the system.

Figure 1. Grain size distribution of filter materials.
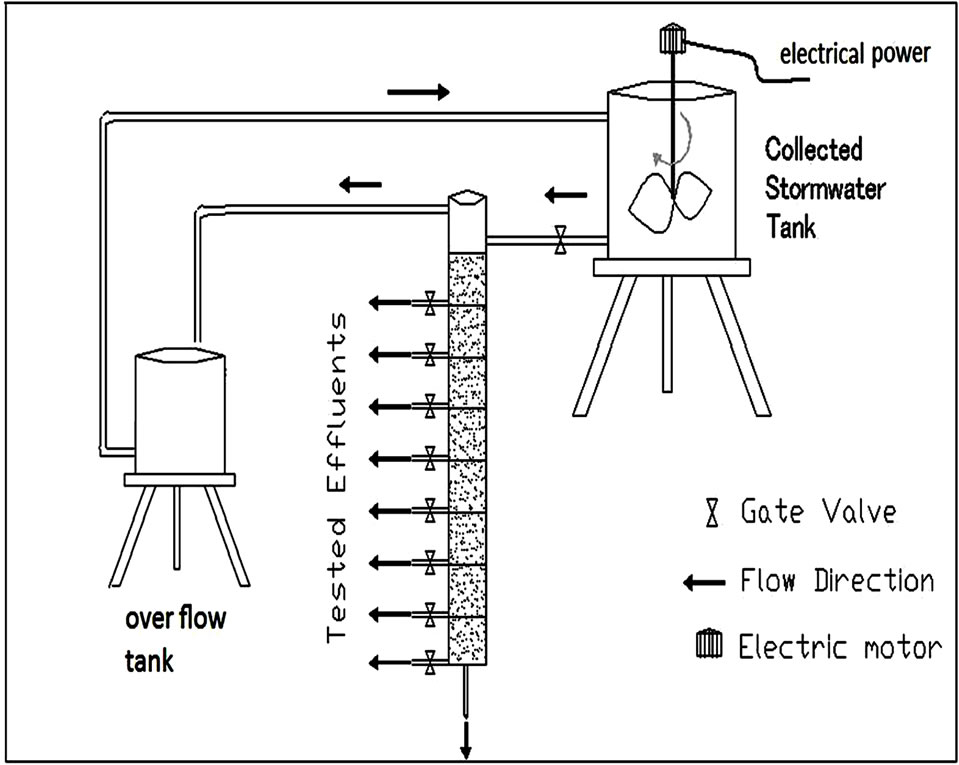
Figure 2. Schematic diagram of the system.
The 8-inch cylindrical PVC-U pipe is filled with depth 200 cm of sand media. The pipe contains a number of valves at varying distances from the upper surface of the media; at 12.5 cm, 25 cm, 37.5 cm, 50 cm, 75 cm, 100 cm, 150 cm, and 200 cm respectively.
The experiment was continuously conducted with certain properties of sand media for a period of three days, the average effluent velocity 0.32 m/hr. The selected parameters which are used concentration of suspended solid and fecal coliforms to illustrate the relationship between depth and the removal efficiency.
2.3. System Operation
After testing the sand filter media, the apparatus were assembled. After that the system was operated firstly using clean water to wash the sand filter media and remove any impurities that may exist on it; this step continued till reaching a steady state flow in order to be cleaned water. The collector tank of 500 liters was filled with storm water and all the valves were closed excepting the drainage valve. The controlling of the influent storm water flow was done through the tank valve as well.
The infiltration test was continuously conducted for three days, the suspended solid and fecal coliforms removal, at each different depth specified above were measured and calculated.
The results had been presented and the relationships had been made between percent removal and depth of filter, so that they can be easily discussed and analyzed.
2.4. Sample Collection
Samples were collected using sterilized 500 ml plastic bottles from both the influent and the effluent outlets of the filters. The collected samples for microbiological analysis were placed in an ice box with ice packs to maintain the temperature of 4˚C. Strict sterilized conditions were maintained throughout the collection and transportation of these samples. Each valve was opened at least one minute prior collect the samples to flushing any pollutant that may exist around each valve Thus, accurate results can be obtained.
The sterilize bottles were numbered and labeled. Attention was also paid during sampling to avoid mixing effluents that may lead to change the percentage of fecal coliforms. For well and proper sampling, it was necessary to sterilize the sample bottles through submerging them in boiling water for 5 minutes.
Representative samples were made by taking three samples for each effluent depth valve and then mixing them to get a composite sample. The samples bottles were immediately brought to the lab for analysis in term of fecal coliforms and suspended solid concentration.
3. Results and Discussion
3.1. Fecal Coliforms Removal
Results of three days infiltration concluded in Table 1. Figure 3 illustrated the percent removal of fecal coliforms through 2 m of filter media versus the depths.
It is clearly shown form the figures that the fecal coliform is completely removed by infiltration through sand filter after a depth of 150 cm in these three days, and also at depth 75 cm there is at least 77.8% removal and the removal percent decreases day by day even at the third

Figure 3. Percent removal of fecal coliforms.

Table 1. Removal of fecal coliforms during three days.
day. It is found that there are some contaminations in the upper layer of the sand media due to infiltration process which consequently affects the treatment performance.
The percent removal increased with increased the filter depth, during continuous three days infiltration generally, they have a close pattern and there is no significant difference in the percentage of removal between them with exception to the upper depths on the third day, due to accumulation of pollutants at this area. As shown in Figure 3 at depth between 75 to 100 cm, there are no significant percent removal occurred, which explains due to the presence in the accumulation of pollutants in this area, the Bactria found food from the dead organisms from upper depth, after 100 cm depth the removal occurred due to scarcer of food due to the biochemical decomposition of organic matter and consequently, will lead to die-off of the bacteria at lower depths.
The results among three days summarized in Table 2 shows the average percent removal of fecal coliforms and differential percent increment of removal-which reflect the percent improvement of removal at each depth.
The median value for percent removal at 1st, 2nd, and 3rd day is 44.4%, 50%, and 60% respectively. And for the average percent removal the median value is 65.92% and standard division is 0.285 which reflect the sensitive effect of depth on fecal coliform removal. The standard division for percent removal at 1st, 2nd, and 3rd day is 0.327, 0.332, and 0.489 respectively, which shown the varying in removal percent for along depths that occurred from day to day i.e. at 3rd day there are varying in removal percent from depth to depth more than at 1st day or 2nd day. The correlation measured between days results, between 1st day to 2nd day is 0.993, and between 2nd day to 3rd day is 0.975 which shown that the removal efficiency for a day infiltration.
Figure 4 shows the mathematical relation between the filter depth and the efficiency of Fecal Coliforms removal. The most representative equation was a polynomial

Table 2. Analysis of fecal coliforms results along three days.

Figure 4. Relationship between depth and percent of fecal coliforms removal.
(2nd degree) as the factor (R2 = 0.96 which is close to 1).
3.2. Suspended Solid Removal
Results of three days infiltration concluded in Table 3. Figure 5 illustrated the percent removal of suspended solid through 2 m of filter media versus the depths.
The percent removal from day to day generally have a close pattern and there is no significant difference in the percentage of removal between them, with exception to the upper depths on the first day due to the filter body at this moment considered as the least accumulation of pollutants in comparison with the other two days.
The results summarized in Table 4 shows the average percent removal of suspended solids and differential percent increment of removal-which reflect the percent improvement of removal at each depth.
Referring to Table 4, it is noted that at depth up to 37.5 cm the average removal of suspended solids is 83.13 %. Thus, this depth represents the effective depth for the removal of suspended solids. It is also noticed that there is no significant decrease in suspended solids concentrations through the depths ranging from 37.5 cm to 100 cm with an average concentration of 14 mg/l, and similarly at depths 150 cm to 200 cm with an average concentration of 9.33 mg/l.
The median value for percent removal at the 1st, 2nd, and 3rd day is 85.8%, 87%, and 87.5% respectively. And for the average percent removal the median value is 86.77% and standard division is 0.111 which mean that the effect of depth on suspended solid removal is not sensitive. The standard division for percent removal at the 1st, 2nd, and 3rd day is 0.079, 0.118, and 0.138 respectively, which shown the varying in removal percent for along depths that occurred from day to day i.e. at the 3rd day there are varying in removal percent from depth to depth more than at the 1st day or the 2nd day. The correlation measured between days results, between 1st day to 2nd day is 0.976, and between the 2nd day to the 3rd day is 0.988 which shown that the removal efficiency for a day infiltration.
Figure 6 shows the mathematical relation between the
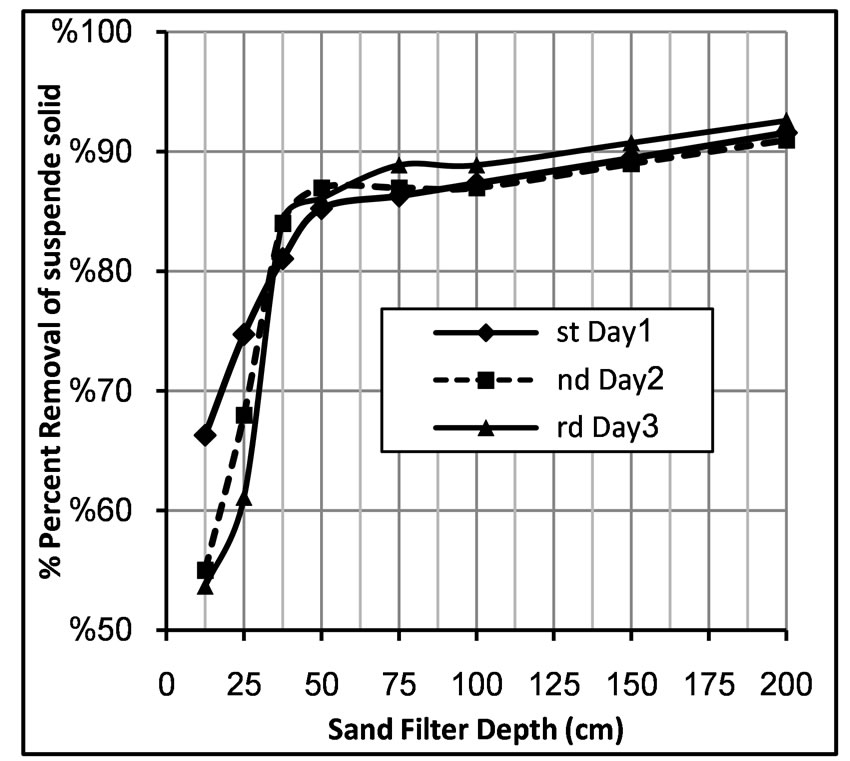
Figure 5. Percent removal of suspended solid.
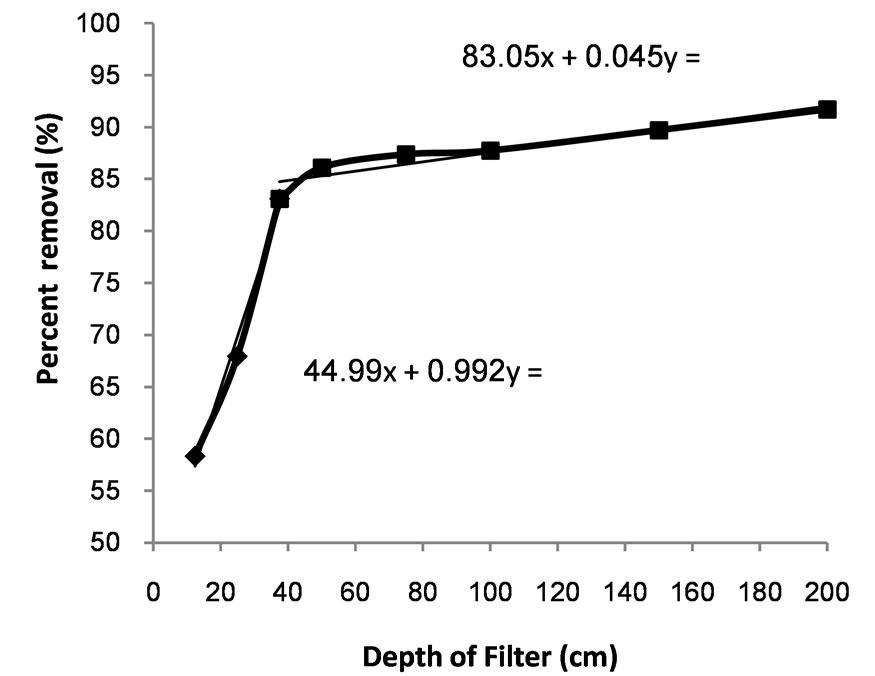
Figure 6. Relationship between the depth and suspended solid removal.
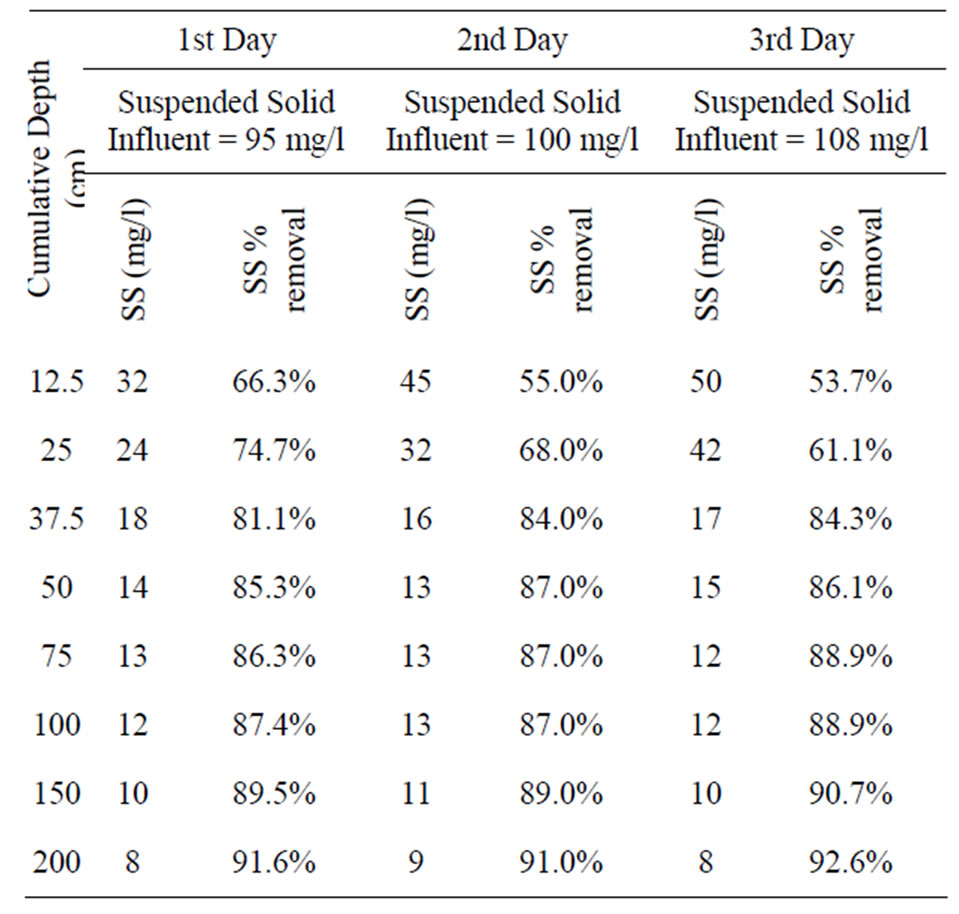
Table 3. Removal of suspended solid during three days.
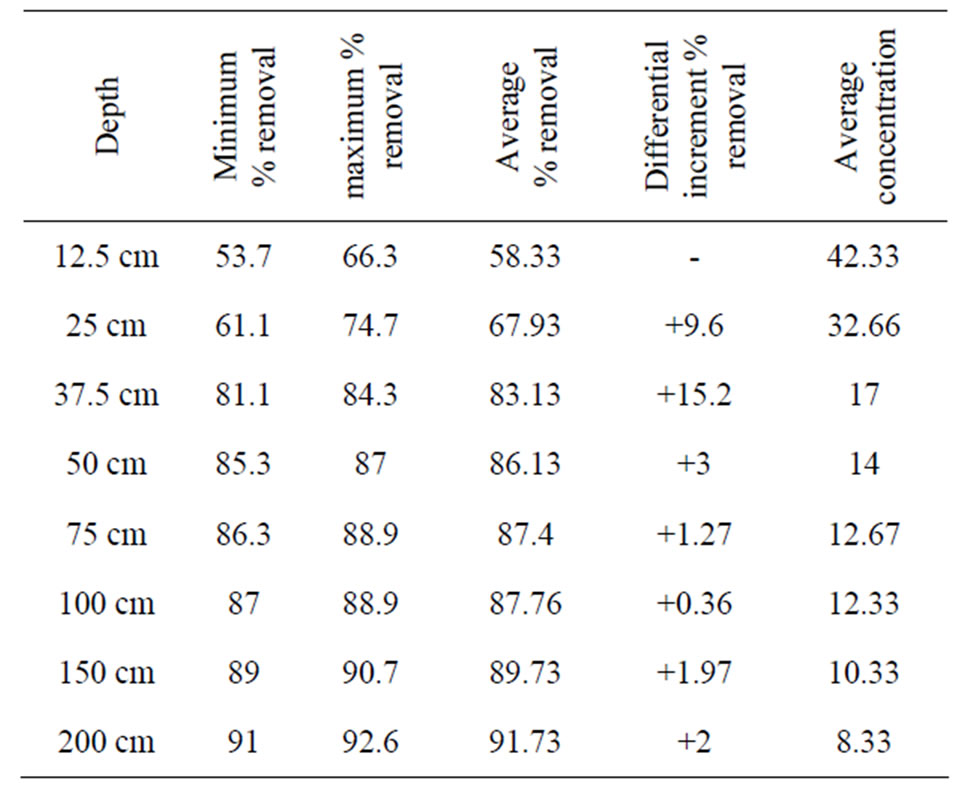
Table 4. Analysis of suspended solid results along three days.
depth of filter and the average percent removal of suspended solid, which can represented as follow:

where x: depth in cm and f(x) the percent removal of suspended solids.
4. Conclusions
1) Use sand filter for purification the storm water can be removed fecal coliforms at the depth of 150 cm.
2) Sand filter produces effluent with less than 20 mg/l suspended solid concentration after the depth of 75 cm.
3) Percent removal of fecal coliforms and suspended solid through sand filter increased as the depth of the sand filter increased.
4) 80% of the removal of fecal coliforms occurred at the depth of 75 cm, and about 60% of influent fecal coliforms will be removed at depth ranged between 50 cm to 75 cm of filter media.
5) 83% percent removal of suspended solid occurred at the depth 37.5 cm.
5. Acknowledgements
The authors gratefully acknowledge the funding support of the Islamic University in Gaza, which made this research possible, and gratefully acknowledge to SCIRP for their efforts to support the authors to publish the paper.
NOTES