Peak Car Use and the Rise of Global Rail: Why This Is Happening and What It Means for Large and Small Cities ()
1. Introduction
There is now a major rail revival around the world, including light rail, metro rail, heavy rail, and high-speed rail. This reflects growing concerns by city, regional and national governments about the need to make their transportation systems more sustainable, their cities more livable, and their economies more resilient to future shocks from the peaking of oil supplies and from the need to reduce CO2 emissions in the face of global warming. Some cities such as Seoul are even looking to how urban rail, in conjunction with tearing down of major freeway infrastructure, can help to create regenerative urban environments [1].
The multiple advantages of modern urban rail are clearly one of its great attractions to policy makers. References [2-4] summarize some major advantages of rail which include:
1) Lower per-capita traffic congestion costs.
2) Lower per capita private passenger transportation energy use.
3) Lower per capita emissions from the transportationsector.
4) Lower per capita traffic fatalities.
5) Lower per capita consumer transportation expenditures.
6) Higher per capita transit service provision.
7) Higher per capita transit ridership.
8) Higher transit commute mode split.
9) Lower transit operating costs per passenger mile.
10) Higher transit service operating cost recovery.
11) Lower CBD parking per 1000 jobs.
12) Better overall urban design in the city especially through Light Rail Transit (LRT) systems.
Many of these advantages have been known for some time, so the surprise is how dramatically successful these urban rail systems are now appearing, with their patronage growth far exceeding expectations in most cases. It is paralleling the phenomenon of peak car use [5].
It would therefore appear to be reflecting changes in the structure of cities, individual travel behavior and housing preferences, and the beginning of a shift away from the dominant car-based urban sprawl paradigm of the 20th century. The paper is thus attempting to understand these two phenomena and see how they are linked through the structure of cities.
Table 1 captures the overall picture for a wide range of cities across the globe, summarized into their regional
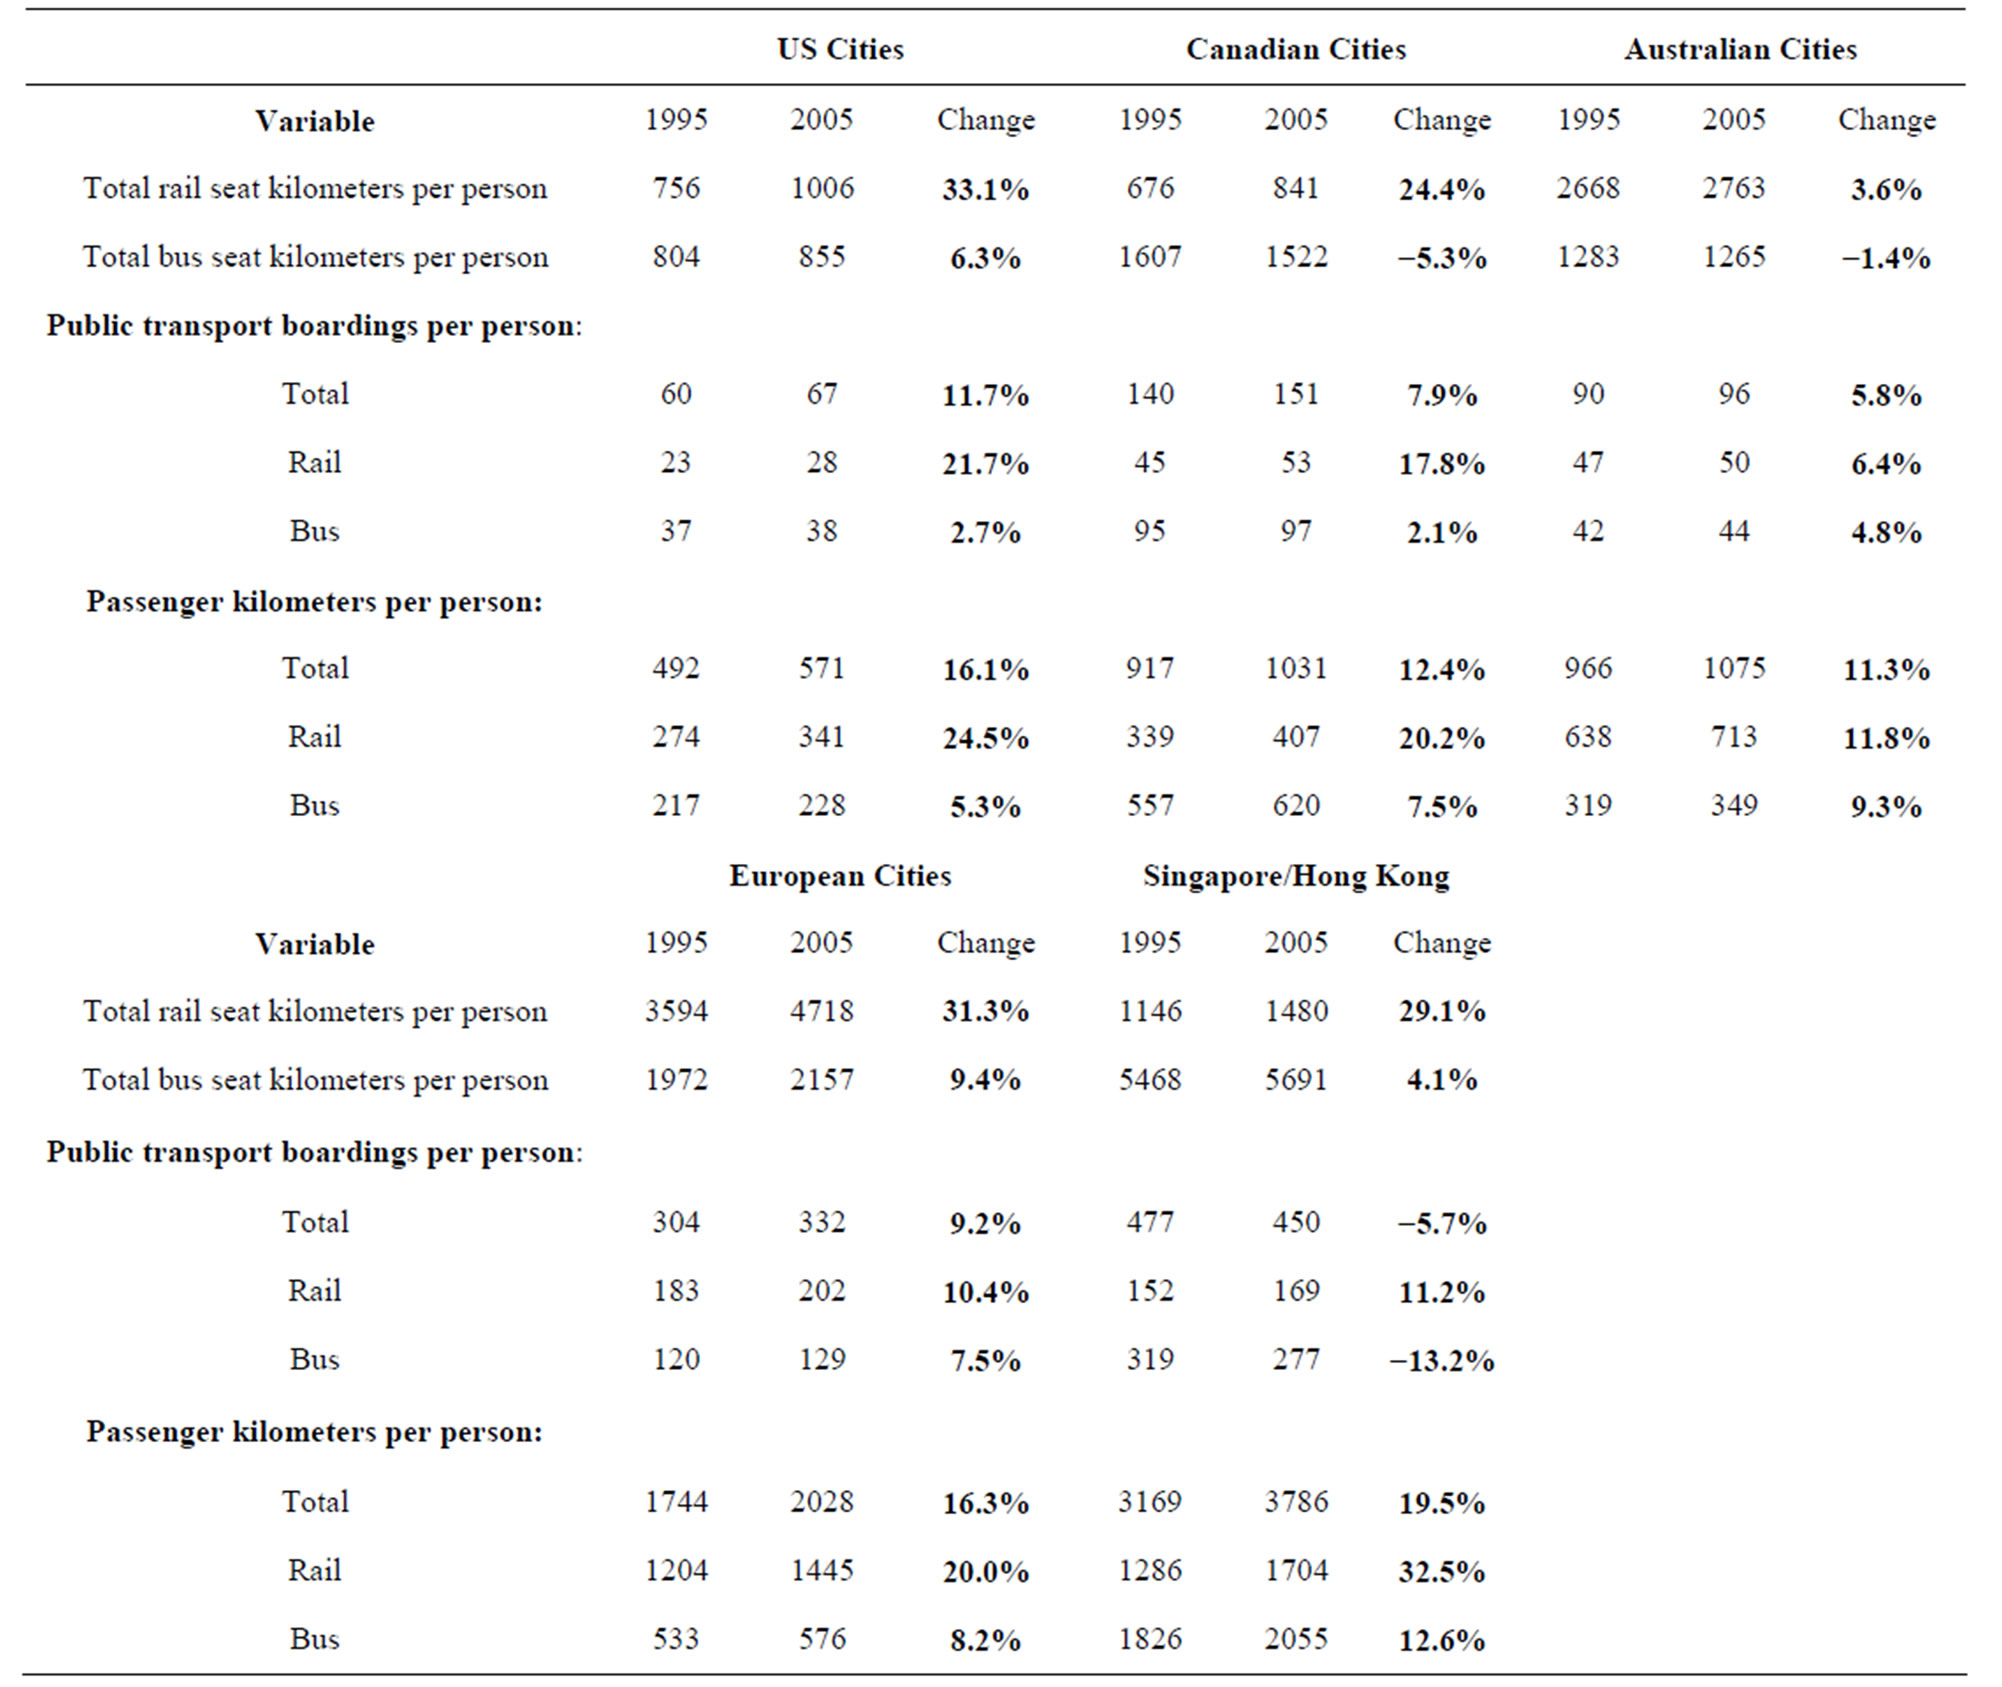
Table 1. Changes in transit service and use by mode in a global sample of cities, 1995 to 2005 [6].
groupings. These data are standardized and comparable in population terms and are systematically collected from transit authorities on a consistent basis.
The data show that in all groups of cities there is a very stark difference between rail and bus, with rail leading the transit revival in each group. Rail seat kilometers per capita have risen much more compared to buses (in Australian and Canadian cities bus service per capita even declined). Likewise, urban rail and bus usage per capita are dramatically contrasted, with urban rail boardings and passenger kilometers showing rather large increases in each group compared to buses and in Singapore/Hong Kong bus boardings even declined.
The above data should be seen with the data on car use that were summarized in [5] and showed an overall growth of just 5% in the world’s cities over the decade from 1995 to 2005, after previous growth of 23%, 26% and 42% in the 80’s, 70’s and 60’s, respectively.
The observed dramatic peak in car use and subsequent declines are consistent with the above trends over many decades. Before describing the probable causes of these parallel rail and car trends, various other rail trends will be examined across an even wider array of cities, first in dense European, Asian and Middle Eastern cities, then in low density American and Australian cities. By taking these trends in a less structured way than the Global Cities Database (above), we are able to examine more recent patterns that coincide with the current phenomenon of peak car use that has accelerated since 2005.
2. Emerging Rail Trends in Dense Cities of Europe, Asia and the Middle East
This section presents a wide range of data, which collectively demonstrate that urban rail is experiencing a surge of popularity that is perhaps unparalleled since its golden age in the 19th and first half of the 20th century.
The form of the data presented in this section varies. Although some data are raw and unadjusted for the effects of population growth, system expansion and increases in rail service levels, and therefore can be criticized for this, such increases in the availability of rail systems are themselves part of the current ascendency of rail in cities and therefore integral to the argument in the paper. In short, rail systems are being expanded, they are increasing their service levels and they are being better utilized, which is the essence of the paper.
2.1. European Trends
In Europe most cities were built around suburban rail systems, which have been retained, though many removed their tram systems in the 1950’s and 60’s. So the revival of light rail has been a major addition to rail in most European cities. No less than 65 cities built new or expanded light rail systems between 1980 and 2007, bringing the total number of European cities with light rail at that time to over 160 (see Table 2). Further growth in light rail has continued since then, particularly in France, Spain and Portugal.
Table 2 understates the extent of trams. Switzerland has at a minimum five cities with these modes.
In a 2003 review of the trend to light rail in Europe, the following conclusions were made:
“The trend toward constructing new light rail systems, which had its genesis in France and has continued at a high level in that country, has generally spread throughout Western Europe and the British Isles. Light rail con-

Table 2. Selected European countries with Light Rail systems (2007) [7].
tinues to be implemented in progressively smaller cities than previously noted with cities having populations as low as 150,000 choosing to make significant long-term capital investments in fixed rail facilities (and willing to tax themselves to do so),” [8].
In addition, new and expanded metro rail systems have also been added or are under construction in many of the larger European cities, such as Paris, Madrid, Athens, London, Vienna, Stockholm, Munich and Frankfurt. For example, London is currently building Crossrail—Europe’s largest construction project—while Paris is completing an orbital metro to complement the extensive upgrades made to the radial metro and Réseau Express Régional (Regional Express Network (RER)) line networks.
Europe has also rapidly expanded its network of highspeed rail lines for intercity travel, with extensive networks in France, Germany, Spain and Italy, and new lines planned or under construction in the UK, France, Turkey, Sweden and other countries. By 2016 it should be possible to travel direct from Frankfurt to London on a German Inter-City Express (ICE) in less total time than it would take to make the journey by plane, allowing for travel to and from airports and waiting time in terminals [9] This question of travel time has been a major factor in determining travel choices for centuries and further data on the continuing importance of this factor will be returned to later.
2.2. Middle East
In the Middle East a large expansion of rail systems is underway. For example:
1) In Qatar, a four line metro network is about to start construction in Doha, with the first section to be completed by 2018, while additional rail projects include an LRT line, the West Bay People Mover system, and a planned high-speed rail network linking Doha airport, Doha town center and Bahrain.
2) In Saudi Arabia, bidding is underway for construction of a metro network for Riyadh, eventually planned to include six lines totaling 175 km. The Haramain highspeed rail line will be the region’s first when opened in 2014. Approval has also been given recently for a major metro system for Makkah, with a planned length of 182 km.
3) In Dubai, a 76 km metro is currently open with a plan for 108 km and an integrated light rail and bus system is partly completed. The LRT is under construction and buses are integrated at many stations.
4) Other metros are planned for Kuwait where a 69- station system with three lines is due for completion by 2020.
5) A 131 km metro system in Abu Dhabi is forecasted for completion some time in 2015.
6) A pan-Gulf Cooperation Council (GCC) interlinking rail system is planned, with a current projected cost of about $30 billion. This network will include the first rail line linking all the GCC member states [10]. Congestion on road systems joining different Emirates is now legendary (e.g. from Dubai to Sharjah) and is one reason why Abu Dhabi has introduced a new law that to work in Abu Dhabi one must now be a resident. Dubai is set to do the same. The pan-GCC rail system is also meant to help address the problem.
2.3. Asia
The rapid pace of urbanization across Asia has seen major growth in population for numerous cities. Coupled with rising incomes, this has led to an explosive growth of cars and motorcycles and a decline in the use of bicycles and small vehicles. The densities of most Asian cities means that mass transit systems will need to handle an increasing share of traffic in response to congestion levels, and a large number of cities have responded with what is the biggest rail boom since the original railway age in the late 19th century in Europe and America. For example:
1) Singapore has built a highly efficient mass transit system encompassing metros and automated light rail feeders, complemented by buses, and carefully integrated with land use planning with major developments concentrated on the rail network.
2) Hong Kong has also built a major, high capacity and modern metro network including a high-speed metro line to the new airport. It has also built a successful LRT system in the New Territories.
3) Kuala Lumpur, Bangkok, Manila, Delhi, Kolkata, Mumbai, Seoul and other major Asian cities have added a variety of rail-based systems including above ground metros or monorails, underground metros and light rail systems.
4) India is building metros in sixteen cities.
5) China has seen the largest expansion. Shanghai has built some thirteen metro lines in the last two decades and now has one of the world’s largest systems. Eightytwo Chinese cities are now building metros. Dozens of cities have added light rail. China has also built the world’s largest high-speed rail network in the last fifteen years, adding to the networks in countries such as Japan, Korea and Taiwan.
What is clear from the above trends is that there appear to be multiple advantages being found from the development of rail in the world’s denser cities in Europe, Asia and the Middle East. At the large end, megacities are building metros with their ability to manage high capacity mobility in narrow spaces, and at the other end small cities are building light rail systems at city sizes that previously were not seen to be viable. All of them are significantly faster than the traffic congested streets of these rapidly growing cities.
3. Emerging Rail Trends in Low Density Car-Dependent Cities
The trend back to rail is perhaps to be expected in the relatively dense cities and countries in Europe, the Middle East and Asia. However, perhaps the more surprising trends have been in the US, Canada and Australia where traditional car dependent cities that were once only considered suitable for bus transit in their suburbs, are now seeing a future based around rail.
In particular, light rail is emerging as the core of the mass transit system in the medium size but relatively low density cities in the US, Canada and Australia, such as Portland (Oregon, USA), Edmonton and Calgary (Alberta, Canada) and the Gold Coast (Queensland, Australia). Ottawa has recently announced a rail system in this traditionally bus-only city. In larger and higher density cities such as San Francisco, Toronto and Sydney, light rail is emerging as a secondary system to support heavy rail/metro systems, and is particularly suited to shorter distance radial corridors in inner suburbs, to circumferential or ring routes, or to radial corridors to secondary centres.
3.1. United States
There has been a significant resurgence in mass transit in the United States, with patronage as estimated by APTA (The American Public Transportation Association) now 23% higher than in 1993, and growing faster than car usage. The growth has been particularly strong since about 2003, and has continued since 2008 despite the significant economic downturn in the US since the global financial crisis, which has resulted in declining economic growth, increasing unemployment and significant financial pressures on urban transit systems.
However, it is interesting that all of the growth in patronage since 1993 has been on rail-based modes (heavy rail, commuter rail, light rail). In contrast total patronage on bus-based modes (bus, trolleybus, demand-responsive) has been essentially static in terms of overall patronage (see Figure 1).
As shown in Figure 2, light rail has had the fastest growth rate of any mode, almost tripling patronage between 1993 and 2011, though from a low base.
As a result of the differential in growth rates, rail modes have increased their shares of total patronage, particularly heavy rail (from about 25% to 35% of the total), while the bus share has significantly declined from 65% to 50%. The issue of bus failure is addressed by [12]. Here they confront the widespread failure of cities to implement effective congestion measures and provide bus operating environments that can enable buses to beat the traffic instead of being a victim of it, thus also growing their patronage as an effective transportation option for mid-level loads.
The patronage on light rail has increased rapidly from a relatively small base of 168 million to 481 million over the same period, passing the patronage on commuter rail (which has also increased relatively rapidly). The number of light rail systems in the US has grown from fifteen in 1995 to twenty-nine currently.
Figure 3 breaks the above data into three groups:
1) The “Legacy” systems—cities which kept at least part of their original tram/light rail systems, and subsequently built on these (this includes cities such as Baltimore, Boston, New Orleans, Philadelphia, Cleveland and Buffalo).
2) Those cities in the early wave of new systems, with their first lines opening by 1990 (this includes cities such as San Diego, Portland, Pittsburgh, San Jose, Sacramento and Los Angeles).
3) Those cities opening their first light rail lines since 1990—this includes cities such as St Louis, Denver, Dallas, Seattle and Salt Lake City.
As can be seen, the cities with “Legacy” systems had roughly static patronage until 2004, but patronage has grown around 25% since. Those cities which had opened new light rail systems by 1990 saw more than a doubling of patronage since, while further growth has come from the expanding number of cities with light rail, as well as expansion of networks already established.
The cities with the fastest growth in light rail patronage are Portland, Los Angeles and Newark with first quarter patronage from 1996 to 2012 shown in Figure 4.
Looking at trends in patronage by mode for specific cities, the graph below shows trends for Portland, Oregon, which has had one of the fastest growth patterns in overall public transit use. As is apparent, essentially all the growth in patronage has occurred on light rail, with bus volumes static (see Figure 5).
The implementation of LRT in Portland in 1986 and the later addition of a Streetcar system, especially through the revitalized Pearl District, were accompanied by dramatic improvements in Downtown and near city street environments with the conversion of parking lots to squares, new farmers’ markets, the widening of sidewalks, introduction of high quality street furniture and artwork and a revival of downtown residential development. These accompanying changes were part of the reason for

Figure 1. Annual patronage by bus-based and rail-based transit systems in the USA 1993-2011 [Authors’ Own Graphic based on data from [11]].

Figure 2. Percentage changes in patronage of transit modes in the USA, 1993-2011 [Authors’ Own Graphic based on data from [11]].
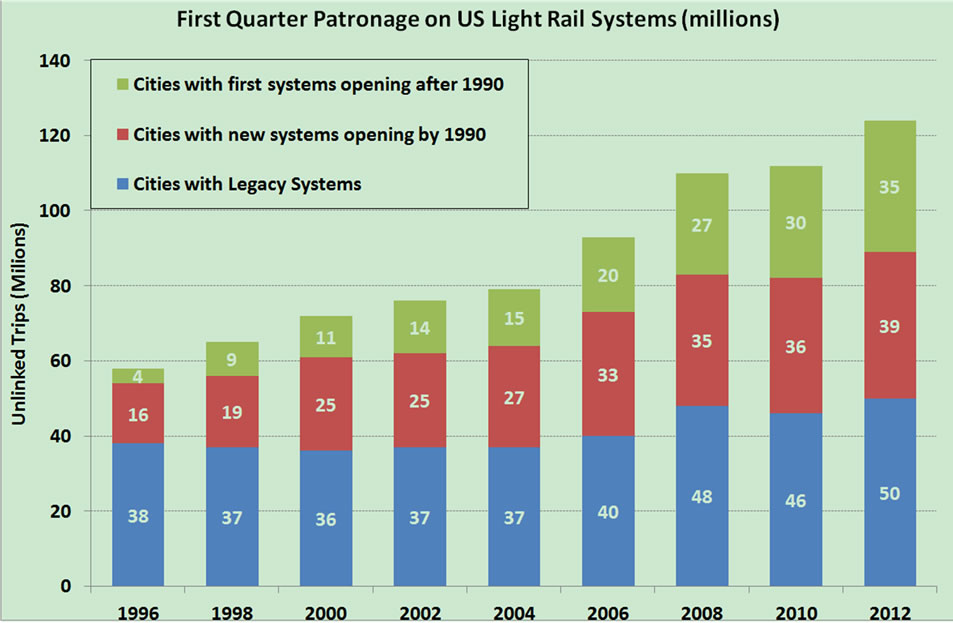
Figure 3. Different types of US light rail systems & their patronage, 1996-2012 [Authors’ Own Graphic based on data from [11]].
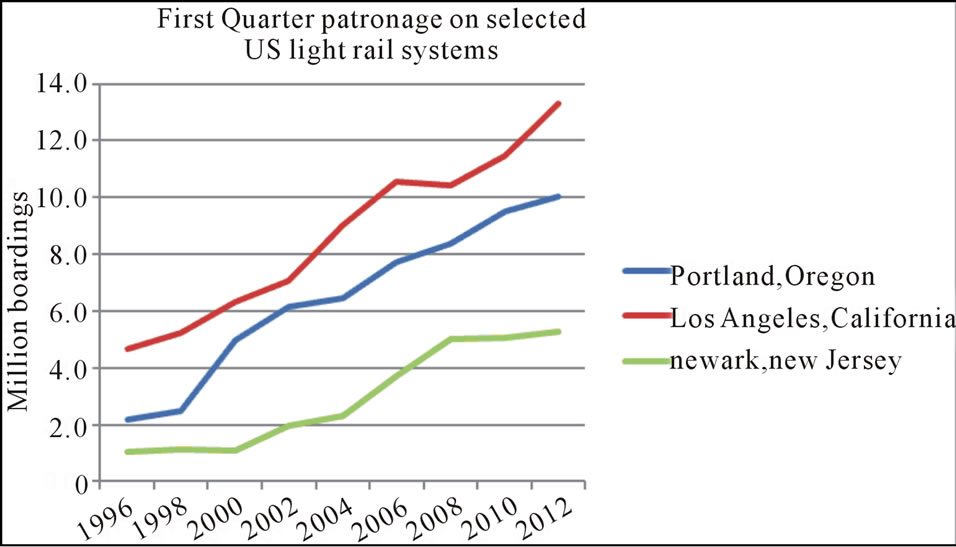
Figure 4. Patronage of LRT in Portland, Los Angeles and Newark, 1996-2012 [Authors’ Own Graphic based on data from [11]].
the patronage boost shown in Figure 5. People rediscovered their central city and pre-automobile inner areas using a convenient public transit option. The experience of Portland has thus shown another important qualitative aspect of LRT—it gives the opportunity to radically change the dynamics of street use in favor of pedestrians and cyclists and can be part of a process involving a major upgrading of urban design and livability in the neighborhoods it serves [13,14].
Overall, the patronage data from US cities reinforces the growing role of public transit, especially rail-based modes, in handling the urban transportation task in the United States, although overall travel remains heavily car dominated. It also suggests that there is likely to be further strong growth in public transit patronage in the future as there are still significant investments occurring in many cities, ranging from upgrades to the metros in New York and Chicago, to significant expansions of light rail and other systems in cities from Los Angeles to Houston. It is noteworthy that many of these are continuing to gain voter support, notwithstanding the difficult financial situation facing many city and state governments.
Similar patronage trends are also apparent in other “new world” cities in Canada and Australia, which have historically been heavily car dependent but which are now investing significantly in rail-based (and in some cases bus-based) public transit systems.
3.2. Australian Trends
There has also been a revival in public transit patronage generally in Australian cities since the turn of the century, which is consistent with the other global data. Patronage is growing faster than car usage in virtually every major city in Australia, and car usage per capita is now falling in many cities [15]. Figure 6 summarises the trend in transit patronage in Australian cities.
The growth in transit patronage has occurred for all modes, but with the highest growth in suburban rail in Perth, suburban and light rail growth in Melbourne and suburban rail and bus use in Brisbane. The contrast between Perth and Adelaide in terms of the rail themes is striking and is due to the opening of the 74 km southern rail line in Perth in December 2007, compared to a stagnant rail network in Adelaide. This is examined in more detail in Figure 7.
This reflects similar trends to those occurring in the United States, where urban sprawl has slowed, densities in inner areas are now increasing, and travel behavior has begun shifting from cars to public and active transportation modes. Hence the future is not likely to be a linear extrapolation of the post-war period, which for fifty years saw declines in transit and rapid rises in car use. Another sign of the change has been the financial failure of recent toll roads, including the Cross City and Lane Cove Tunnels in Sydney, and the Clem 7 tunnel in Brisbane, with early signs that the Airport Road Tunnel in Brisbane is also experiencing much lower traffic than forecast [16].
Governments are beginning to respond to this shift through moves to enhance transit, with Infrastructure Australia providing over half their funds to urban rail in an historic intervention by the Federal Government. State Governments have generally hedged their bets with plans for major new railways and new motorways but this is a big change from previous decades where highways dominated funding.
1) In Sydney, the Draft Transport Master plan has committed the Government to two major heavy rail extensions—the South West and North West Rail links, and to extensions of the small light rail system into the inner west, Central Business District (CBD) and south-eastern suburbs. In addition, a second harbor rail crossing has also been included in the plan, though as yet the funding, timetable and design are not yet clear. Light rail lines in Western Sydney, based on Parramatta, are also under investigation. The heavy rail fleet is being updated and expanded, and a new approach promises much closer integration between rail, bus, ferry and light rail modes.

Figure 5. Patronage of LRT and buses in Portland, Oregon, 1996-2012 [Authors’ Own Graphic based on data from [1]].

Figure 6. Per capita public transit travel (passenger kilometres) in Australian cities, 1976-2009 [Authors’ Own Graphic based on data from [15] and Australian Bureau of Statistics population data for each city and year].
2) In Melbourne there have been incremental extensions to the heavy and light rail systems, some additional trains and trams, and improved bus services in the outer suburbs. However, the improvements have not kept up with the rapid growth in demand, and there have been significant complaints as to the reliability and quality of services. Planning is continuing for a new heavy rail line through the CBD to provide additional capacity, with a $4 billion price tag.
3) In Perth the rail system has been significantly expanded with the South-West Rail Line of some 74 km, which opened in 2007, extensions on the Joondalup line, which opened initially in 1993, and increased rolling stock to cope with much higher than expected demand. The original system (three lines) was electrified in 1991, thus also increasing its operating speed significantly. However, rolling stock has just kept pace with the very rapid growth in demand, which has seen rail patronage increase dramatically, (see Figure 7). The government has, however, also announced a start on a $1 billion light rail network for the CBD and inner suburbs, which will help to handle demand from these areas and support more sustainable land use patterns. Figure 7 also shows how rail can stagnate when it is based on a slow diesel service with no expansion, as has been the case in Adelaide until now.
4) In Brisbane, there have been some extensions to the rail network (the Gold Coast line and the Springfield line) with more extensions agreed (to Redcliff and potentially the Sunshine Coast). There has also been significant expenditure on a busway network, including an underground link through the CBD for buses, necessitated by the volumes of buses entering the city. Planning for a major new rail line through the CBD—the Cross River Rail link—has been finalized, but as in Sydney, no funding or timetable has been announced.
5) In Adelaide, the light rail system has been extended and the heavy rail system is being electrified, although the speed of the program has been cut back recently.
6) In the Gold Coast a $1 billion light rail line is under construction, which will form the beginning of the mass transit system through this high density coastal strip.
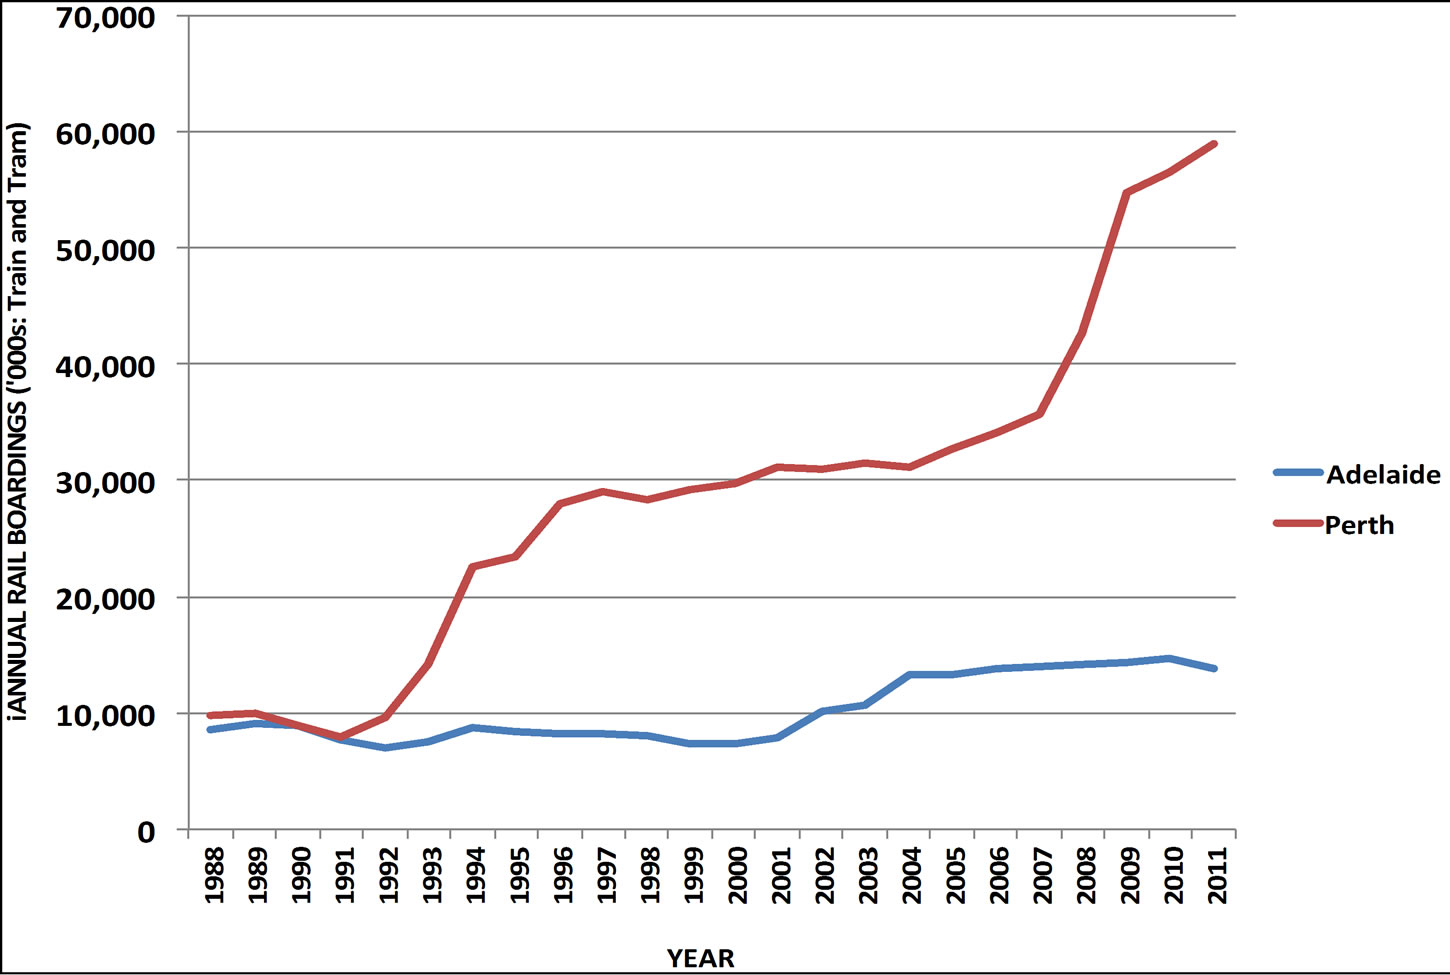
Figure 7. Annual rail boardings in Perth and Adelaide, 1988 to 2011. [Authors’ Own Graphic compiled from Annual reports of the rail operators in Perth and Adelaide].
7) In Canberra plans for light rail are progressing, though the funding situation remains unresolved. Similar concept plans are under discussion in Hobart, Darwin, Newcastle, Cairns and other smaller cities.
The overall picture is thus continuing the pattern of increased focus on rail systems. Governments in all States and of all political persuasions are recognizing the crucial need to further upgrade, expand and extend Australian urban rail systems. There seems to be a global shift in the urban paradigm that is setting in.
4. What Is behind the Trends in Urban Car and Rail Use?
The one hundred year growth in the use of the automobile in cities appears to have plateaued and then declined across the world’s developed cities [5,17,18]. This set in before the Global Financial Crisis (GFC) and is approaching a decade with little sign of change. Indeed a report by [19] on young people in the USA shows that amongst the age group from 16 to 34 years old there was a decrease in car use between 2001 and 2009 from 10,300 miles to 7900 miles per capita—a 23% decline. At the same time, use of transit went up 100%, walking 37% and biking 122%. These are remarkable numbers and suggest a much deeper transition is happening than simple supply and demand based on previous elasticities. It suggests a combination of factors that are synergizing a major change and the rail growth data are reflecting this as well.
The change in car use in developed cities occurred simultaneously in 2004 when oil reached US $80 per barrel. From a plateau, car use then dropped significantly when oil reached $140 per barrel in 2008 and propelled the world’s cities into the GFC. Australian cities were buffered from much of the GFC due to a combination of quick action by the government, well-regulated banks and China’s continuing demand for resources. Nevertheless, a significant decline in car use per capita continued from 2004 onwards. Figure 8 shows the per capita annual private passenger kilometers (driver and passengers) in each of the major Australian cities. Those Australian cities that provided new rail infrastructure grew substantially in transit, and those that did not remained static— (see Figure 7).
Such data suggest that supply of rail options and demand reductions in car use due to fuel prices, are likely to be part of the mix of explanations for peak car use.
It is possible to see similar data on many countries worldwide. Reference [17] provides a comprehensive examination of a number of nations’ time series of car use, which demonstrates a similar peaking. The advantage of the Australian data here is that it is for cities rather than the whole nation and is drawn from the very long running Australian Bureau of Statistics Survey of Motor Vehicle Use, something which few other countries can draw on.
It is also possible to see two other structural matters that are likely to be part of this global phenomenon. One is that the structure of cities began reaching a limit to car use growth and the other that urban culture and economy began to change to support this process. Both suggest that a more fundamental shift in urban activity is unfolding.

Figure 8. Per capita private passenger kilometers of travel in Australian cities (car, light commercials and motorcycles), by city, 1976-2009 [Authors’ Own Graphic based on data from [15] and Australian Bureau of Statistics population data for each city and year].
4.1. Urban Structural Limits and Travel Time
Cities are structured around their transportation priorities. Traditional walking cities were structured around walking and expanded little beyond a half hour radius or one hour diameter (5 km), so that at walking speeds all destinations could be reached. Transit Cities extended this one hour diameter to 20 km or so and Automobile Cities extended this to 50km or so [20]. All cities have combinations of these three city types because most retain dense centres that still function as walking cities and many still have rail-based suburbs built around rail stations before cars became dominant. Some like Stockholm developed their transit-based urban form from the 1950s onwards [21]. The last 80 years has seen the growth in transportation mostly around the Automobile City and the old Walking and Transit City components have been reasonably static as car use was a quicker and more convenient option. However, in the past decade it would appear that the Automobile City has reached its limits and a new type of city is emerging with a different structure. This can be seen by examining the trends in average speeds for car use compared to rail-based transit (see Figure 9 and Table 3).
Despite the difference in city types around the world it seems that the 21st century is the period during which the limits on global car-based urban growth have happened. This will be explained by referring to the two groups of cities outlined above: the denser cities of Europe, the Middle East and Asia, and the low density cities of America and Australia.
The approach taken is built on the above urban fabric theory of travel time budgets and transportation modes developed in [20] and the new data from the Global Cities Study which shows that traffic speeds have stabilized in the world’s cities [6,22].
General traffic in the world’s cities averages 34 km/h,
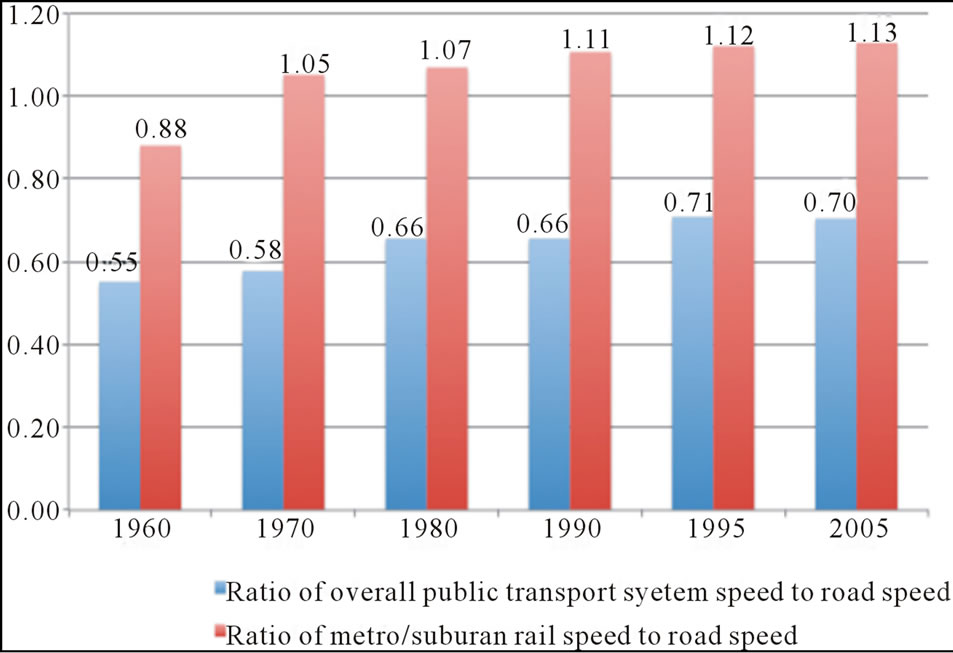
Figure 9. The relationship between overall transit system speed and heavy rail system speed in cities compared to their general road traffic speed, 1960 to 2005 [Authors’ Own Graphic].
with dense cities in Europe around 30 km/h and Asia around 20 to 30 km/h; low density cities in America and Australia are around 45 to 50 km/h. The global average speed of buses is 19 km/h, with most cities unable to get much above this, though some do manage to push 30 km/h where good bus lanes exist on much of the system (e.g. in Hamburg). Rail systems vary considerably, but metros average around the general road traffic speed of 34 km/h and suburban rail averages 43 km/h. Perth’s new rail line to the south averages 88 km/h and most new rail systems outlined above are seeking this competitive edge over car-based congestion. These differences in relative speeds have been known in cities for decades, however this paper can now reveal new data that shows the trends in relative speeds. The data have been processed from all the previous publications of the Global Cities Database [22,23]and from recent unpublished data (e.g. [6]) and have been put on the same basis for comparison: the average speeds of transit systems are weighted carefully on the basis of passenger hours of travel by each mode. Where more than one rail system is involved in any city, the rail speed is also weighted the same way. The data used here have been collected since the 1980s for a large sample of world cities, for as far back as 1960. The methodologies and uses of the data are explained in the above mentioned references and others such as [24].
The most significant trend to help explain the decline in car use and the increase in rail is that the world’s cities all showed a plateau or an increase in the ratio of transit to traffic speeds, when tracked over the period from 1960 to 2005 (see Table 3).
Figure 9 shows these data averaged across the globe for American, Canadian, Australian, European and Asian cities. Although these data are only up to 2005 and car use peaking seems to be centered around 2004 in many places, it can be postulated that the process involved is

Table 3. Ratio of overall average transit system and heavy rail speed to general road traffic speed in cities in different regions, 1960 to 2005 [Authors’ Own Data].
likely related to a tipping point involving a gradual change in the relative competitiveness of transit versus cars, which reaches a critical point and then cascades [25]. Of course we are not arguing that this factor is the only one involved in peak car use, so there are cumulative factors involved in reaching such a tipping point. Table 3 and Figure 9 also highlight another critical factor in the argument put forward in this paper, by showing the ratio of metro/suburban rail speeds (trams and LRT excluded) in each group of cities compared to the average general road traffic speed for the same cities (i.e. only those cities which have the rail systems).
It should be noted that both car and transit speeds are based upon kerb-to-kerb or “in-vehicle” travel times, not door-to-door travel times. In this sense the relative speed between transit and cars may be overstated for some trips and understated for others. Higher urban density can do much to shorten access distances and times required before a transit vehicle is boarded. In addition, where transit frequencies are very high, such as in Japanese subway systems where peak period headways can be as short as 90 seconds, or even in, for example, the Skytrain in Vancouver where peak frequencies along significant sections are 2 to 4 minutes, waiting times can be very much reduced. Likewise, cars are not without access times, depending on the nature of the origin and destination of the trip and where parking is to be found. As a rule, transit is most competitive in speed for trips to centers or major events, which act as temporal centers. In these situations parking is generally most limited and therefore is least convenient for car users, due to cost and also the walking distance from a car park to a final destination.
It can clearly be seen that while globally, for the cities analyzed here, the ratio of overall transit system speed compared to general road traffic has increased from 0.55 to 0.70 between 1960 and 2005, the ratio of rail system speed to general road traffic has gone from rail being slower than cars in 1960 (0.88) to a situation in 2005 where rail was on average faster (1.13). This trend has experienced a steady increase (see Figure 9). Note that the data in Table 3 represent the same city pairs within each year group. From 1960 to 2005 the amount of data increased considerably, so there is a general increase across the table in the number of cities involved in each year.
Within the regions it can also be seen that even today in American and Canadian cities, transit overall is barely half as fast as general traffic speed, whereas their rail systems are about 90% to 95% as fast, meaning that in many cases they are competitive with the car, especially into dense urban centers where clogged highways are losing out to fast rail systems time and again. Australian cities do a little better with transit overall now being only about 25% slower than cars, while the rail systems are now on average about 8% faster and have generally been improving their competitive position since the 1960s and 1970s. When major corridors into city centers are considered, the rail systems are at a clear advantage.
European cities have mostly always had quite competitive rail systems in terms of speed, but they have hit a high in this 45-year perspective by reaching an average of 28% faster than cars. Indeed, their overall transit systems, as a result of their fast rail systems, are on average 90% as fast as the car. It is interesting to note, however, that their rail relative speed dropped from 1.07 to 0.80 during the 1960s when they opened up to the car and built a lot of roads. A similar thing can be seen in Australian cities, but after that, rail speeds relative to the car rose quite consistently.
Asian cities have very fast rail systems compared to their crowded road systems, where in 2005 rail speeds were some 52% higher. This has fluctuated somewhat over the decades, but rail speeds on average were never less than 40% better than cars, even in the 1970s. Such data give hope to the many emerging cities struggling with the car that rail systems can help them to develop a very different kind of overall urban transportation system that is not so overwhelmed by the automobile. In the emerging cities traffic speeds were very slow (around the low 20’s km/h) and bus speeds always slower than this. Bangkok had a traffic speed of 14 km/h and a bus speed of 9 km/h. Thus as these emerging cities build rail (often above or below the traffic) the data will be reflected in dramatic transit speed improvements.
The data also highlight the fact that it is bus systems (as well as tram and LRT systems that are not operating on dedicated rights-of-way), which are dragging the speed performance of transit down. However, it also must be recognized that buses operate in nearly all cities under intolerable congestion levels that are permitted to continue by not controlling congestion through economic and physical means. It is not the case that buses cannot compete with cars in speed terms in all circumstances, but they will continue to struggle while congestion remains unchecked [12].
4.1.1. Dense Urban Form Cities
European, Asian and Middle Eastern cities did not begin to grow with the car until well after the new world cities of America and Australia and in the case of UAE cities, only in the last 30 years or so. They remained mostly based around their old Walking and Transit City urban form and have had much less car-based urban sprawl. Car ownership continued to grow until recently, although much more slowly than in the past, and is now showing signs of a plateau as the streets have filled and other options have been pursued, as set out in this paper. Five major Canadian cities on average declined in car ownership between 1996 and 2006. In addition to the options discussed later, car ownership is also being increasingly impacted by car sharing, especially in European cities (e.g. Bremen). Car companies such as Daimler Benz and BMW have also established their own “instant car access” systems in some cities (Car2Go and Drive Now respectively). European cities historically have led the way to calm traffic and build extensive cycle-way and transit options as the public chose not to build so many large freeways or to facilitate car use anything like the cities of the new world. Thus peaking of car use and growth of rail has occurred because average traffic speeds have generally stopped growing.
The emerging cities of Asia and the Middle East have had a much shorter period to reach their limits on car use, but perhaps are bound to do so, sooner as they are so much denser and the streets have so much less capacity to enable car use growth. They also have hit the wall on their average traffic speeds.
Data on the use of cars in the emerging cities of China and India and the Middle East are not easy to obtain, though car ownership data are known. Most projections of car use suggest that major global growth in car use will occur in these cities. However, it may be that the growth in car ownership will not be reflected in the same trend upwards as has been seen in the developed world. The urban fabric of dense Asian cities is such that little space for car use exists. For example, in Singapore, which directly controls car ownership growth through economic imposts, precisely because of its limited ability to accommodate cars, car ownership in 1995 was a meager 99 cars per 1000 persons and in 2005 it was 100. In Hong Kong likewise, where cars are not controlled so tightly using economic means, still car ownership only rose from a tiny 47 to 57 cars per 1000 persons, a remarkably low car ownership number when compared to any city in the world today, especially a relatively affluent one [6].
The remarkable growth in urban rail in China and India suggests that these cities may have hit the wall much sooner than occurred in European cities and certainly far sooner than American cities. Daily experience of the streets in these cities suggests that the old Walking and Transit City urban fabric is saturated with cars and from here on the growth will largely plateau. Of course these cities too are capable of sprawling, as evidenced in Beijing, but the “sprawl” is denser than in the USA or Australia and it is simply not physically possible to turn a dense Asian city into an American city without demolishing the whole thing and starting again. Sprawling carbased suburbs of the very low density found in Australia and the USA are rare in China and India and land constraints, including unsustainable destruction of essential food growing areas, are likely to mean they will largely grow based on Walking and Transit forms.
Based on this analysis, European levels of car use would be the most that would be expected in China and India, more probably to around half the levels of where car use plateaued in Europe. Recent announcements in India have suggested that this is the kind of plateau in car use that they are seeking as traffic congestion has far outreached acceptable levels and new rail systems are planned to enable better access [26].
4.1.2. Low Density Cities
The cities of America and Australia grew mostly in the Automobile City era and as a result are much lower in density (by a factor of ten usually). Thus the space for car use is much more available. Car ownership and car use grew to a much higher level but is now plateauing and declining. They seem to have hit the same wall as the denser cities, but at a much higher level of car ownership and use. However, they have also reached a limit on the growth of freeways and other urban space for cars (e.g. parking is being restricted heavily in most developed cities) and hence average traffic speeds have plateaued or reduced.
The nineteen lower density cities in Australia (4 cities), the USA (10 cities) and Canada (5 cities) for which we have 1995-6 and 2005-6 average road traffic speed data (24 hour/7 days per week), show an overall average road traffic speed in 1995 of 46.8 km/h and 47.4 km/h in 2005. In terms of the regional averages, Australian cities in 1995 averaged 43.6 km/ and declined to 42.8 km/h, the Canadian cities rose slightly from 44.5 km/h and 45.4 km/h respectively, and the US sample was similar (49.3 km/h and 50.4 km/h).
In terms of parking, between 1995 and 2005 parking supply per 1000 CBD jobs in a large sample of cities mostly declined. US cities went from 555 to 487 parking spaces per 1000 CBD jobs, Canadian 390 to 319, Australian 367 to 298 and Singapore and Hong Kong declined too from 136 to 121 parking spaces per 1000 CBD jobs. In European cities, CBD parking rose a fraction from 224 to 241, but this was largely because of an unavoidable expansion of the definition of the CBD in Berlin which increased the apparent CBD parking supply in that city [6].
Thus the same mechanism can be understood to have set in over the past decade: the urban structure or fabric of the city has prevented any further growth in car use, congestion has remained totally uncontrolled, and the only way forward was with alternative transportation, especially urban rail.
The relationship between car use and transit is exponential and thus relatively small increases in transit can lead to significant reductions in car use. This is explained by the concept of “transit leverage” which shows that one extra passenger kilometer by transit substitutes for multiple car passenger kilometers (generally in the range of 3 to 9), mainly through the trip chaining that transit users do on their journeys as well as the behavioral change and land use change that follow when people switch from car use [23,27].
The second perspective on this issue is provided by an understanding of urban economy and culture.
4.2. Urban Economic and Cultural Change
The biggest change in the economy during the period leading up to and including the period of car use decline and rail growth has been the digital transformation and the consequent knowledge/service economy. Despite this being global and enabling long distance communication, it has in fact been a concentrating force in terms of city structure and fabric. We provided new data on global cities [5] that showed a universal increase in density in the past decade or so after over one hundred years of decline. The knowledge economy and digital jobs are focused in city centers, as these are where the creative synergies between people occur [28]. Old CBD’s have been transformed back into functional Walking Cities and, those which have done this best, have attracted the most capital and young talent to work there [13,29]. Other centers have also done similar transformations and the linkages between them have become the basis for the revival of the Transit City. Universities, health campuses and IT job clusters have created their own centers for jobs and have attracted housing and transit to link them together.
Other parts of the economy such as manufacturing, small and large industry, freight transportation and storage, have remained car-based and are outside this new knowledge economy. They will remain so but they are also not where the growth in jobs or the growth in wealth is happening. Thus the Automobile City economy and culture has become somewhat distinct from the new regenerated urban economy of knowledge/services and its basis in Walking and Transit City urban fabric.
If the Automobile-based economy had continued to scatter land use and economic function, it would not have been possible for the rise in rail to occur. Rail needs focused activity and that is now happening in rapidly accelerating ways. Thus the urban structural change and the value of time saved by rail outstripping cars in the journey to knowledge-based centers, are obviously closely linked.
As with many economic changes, there is also a cultural dimension to this change that perhaps explains the rapidity of the changes observed above, as well as the demographic complexion of the change. Young people (especially those involved in knowledge economy jobs) are moving to reduce their car use and switch to alternative transportation faster than any other group. This has been recognized by a few commentators and related to the use of social media devices [30]. On transit or walking (and even to an extent while biking) young people are already connected by their smart technology phones and tablets. They are hardly usable while driving a car. Reference [19] shows that the mobile phone is a far more important device than a car for younger people. This is a cultural revolution that partly underlies the rail revolution. Baby-boomers gained freedom and connection with a car, Gen Y’s are not needing one. They like to save time on a fast train, but they also like to use the time constructively relating to their friends and work.
The other expression of this change is that younger people are moving to live in the Walking City or Transit City as these locations more readily enable them to express the kind of urban experience and culture to which they aspire [30]. Thus they feed the market that enables the rail revival and city center renewal to continue.
The rise and rise of rail (as well as the demise of car dependence) can be explained by a combination of urban structural limits together with urban cultural and economic change that together enable us to see a different kind of urban future emerging. Cities that are responding to the powerful new agenda for building rail systems can enable this new, less car dependent city to emerge. However, if a city does not adequately develop or build the rail infrastructure then it can easily miss out on this important social and economic change. The biggest threat is if car dependent cities do not recognize that the golden age of the car is over. Some suggestions are therefore provided as an end to this paper about how to capitalize on this proven rail revival and how to better facilitate it in both large and small car dependent cities.
5. What Can Be Done to Make Rail Work Better in Large Car Dependent Cities?
There are a few emerging trends in best practice for rail that can enable large car dependent cities to capitalize on the opportunities that are now presented by this global new world.
1) Integration of modes. The most obvious impact of rail is when it is properly integrated with bus feed-in to enable a broad catchment to be served. This is particularly evident in car dependent cities, which cannot be served by just walk-on passengers. This requires ticket integration as well as fast and convenient transfer systems. Perth’s Southern Rail illustrates this well with some 80% of the system usage being from bus transfers and only a very small percentage from Park and Ride, despite generous Park and Ride provision [31]. Bus rightof-way into stations is a critical part of enabling this integration. Of course, integration with bicycles is also an opportunity that offers huge rewards, as evidenced by looking at the surroundings of any Dutch or Danish railway station, or even the new, specially designed secure bike parking areas around Sao Paulo’s commuter rail system or those in Seoul.
2) Integration of land use. Rail will work better if there is a chance to redevelop land use around the stations in order to enable more people to have easy access. Measuring this potential and making it part of the planning process seems to be an emerging standard practice [32,33]. Where Park and Ride is needed, it should be integrated with such attractive higher density, mixed use development and not as vast swathes of bitumen, which destroy station environments [34].
3) Speed. The value of travel time will not change much in this new world and must be central to how any rail system is designed. Giving reasonably long station distances and separated right-of-way is critical. Light rail running on dedicated right-of-way, rather than on-street tram options, and with traffic light priority, will be mostly needed in car dependent cities.
4) PPP (Private-Public Partnership) Procurement. The delivery process can enable all of these options to be highlighted if procurement is based on a PPP process, as suggested by many (e.g. [8,35]). The Gold Coast Light Rail provides the best example in Australia of how PPP approaches can be achieved in light rail. The full integration with land use remains to be done and is much more likely if land value capture (see below) is made part of the package.
5) New assessment approaches for rail. There are two major ways for rail to be improved through the assessment process: recognizing the role of agglomeration economies in a Benefit-Cost Ratio and recognizing the role of avoidable land development costs. Agglomeration economies are being included in transportation BCR’s since the Eddington Transport Study in the UK [36]. Their application in rail is considerably better than road projects as rail acts as a focusing feature that enables the synergies and clustering of knowledge economy productivity, i.e. the Walking City. Reference [37] outlines the value of agglomeration elasticities for Australian cities. Even more significant (though rarely done) is the use of avoidable costs in assessment of transportation. Rail and its focusing ability in land use can enable reductions in urban sprawl that invariably is heavily subsidized and has many external costs. Reference [38] shows the considerable cost savings and health benefits from rail-oriented development as opposed to car-based development that can be included in any transportation assessment.
6) New approaches to funding rail through value capture. Rail infrastructure increases land value due to its accessibility benefits. This value can be captured and used to help fund the infrastructure. Reference [39] demonstrates that a five-step process can work in the following way:
a) Accessibility benefits analysis to demonstrate the land area where owners will benefit most from the new infrastructure.
b) Land value data collection of the differential between those areas varying in accessibility. This can be around 20% - 25% for residential land values and over 50% for commercial land values.
c) Assessment of the various potential financing mechanisms available in the city through public and private value capture, e.g. government land and parking revenues.
d) Economic and financial assessment of how much land value can contribute to the funding of rail through a dedicated fund based on land value taxes that are going to increase due to the new rail system.
e) Delivery through a planning mechanism and a fund established to bring it together, probably in a PPP.
If rail is going to continue to grow and car use to decline then a range of sophisticated value capture mechanisms will be needed for each city to make the most of this opportunity for funding.
6. Can Light Rail Work in Small Car Dependent Cities?
Perhaps the most significant trend in recent years in Australia (and America) has been the emergence of light rail as an issue in small car dependent cities across the country. Lobby groups in Australia have been actively pushing the political case for light rail in Canberra, Hobart, Bendigo, Darwin, Newcastle, Cairns and Parramatta (although embedded within Sydney, it is like a small town, as it would need to be an independent and isolated system servicing a local population, not unlike the other smaller cities). These cities are mostly well under 300,000 people, Canberra being the largest at a little over 300,000. Similar trends have been observed in the US [8].
The question needs to be asked whether this is likely to be a viable option for these small cities, since the traditional approach would suggest it was not. Bus options have long been considered the only viable option for small cities. However, the above dramatic turnaround in the fortunes of light rail may be indicating that a new era of viability for light rail in small cities is emerging. The case for these cities to be considered is based on an understanding of what is likely to be causing the above trends in traditionally car-dominated cities, as well as some new options for assessing and funding light rail in such cities.
There are 545 cities with light rail and from this there are now 118 cities with populations under 150,000 that have light rail or are constructing light rail. This appears to suggest that a changing appreciation of the value of light rail in small cities has occurred, as shown in Figure 10. The change is probably associated with the shift in value associated with the trends outlined above in peak
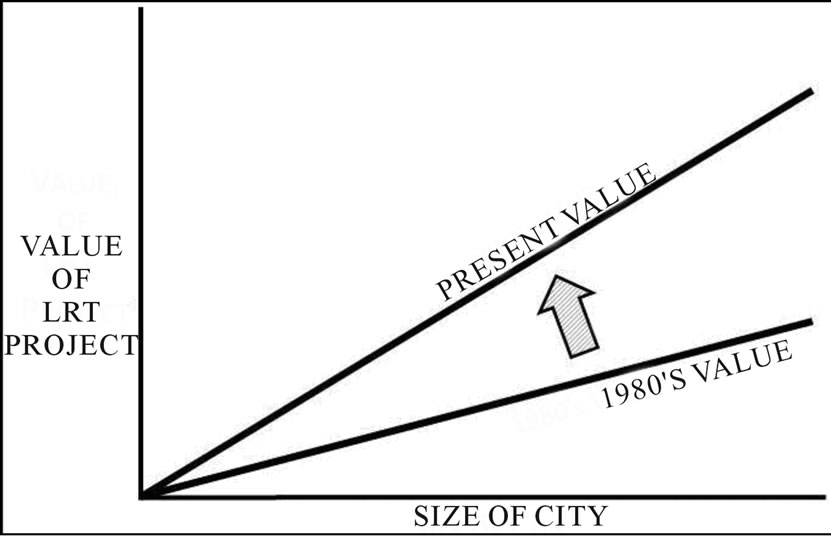
Figure 10. The shift in value of light rail projects in recent decades has made increasingly smaller cities viable for light rail [Authors’ Own Graphic].
car use, fuel prices, urban traffic speed trends and urban economic and cultural changes.
The key to whether a small city is ready to take on a light rail option will be whether its economy is sufficiently oriented to the knowledge/services economy that requires strong functioning Walking City centers, linked by transit. It will be a city where traffic is becoming an issue in these centers and where attempts to traffic calm, reduce parking and bring people without cars, is firmly on the planning agenda, thus reducing traffic speeds. It will also be a city where young people are moving to live and to gather in these centers for their cultural life, rather than just driving around suburbs. Such cities will find the addition of light rail an invaluable part of being a small contributor to the 21st century with its reduced car dependence
7. Conclusions
The peak car phenomenon can be approached through many lenses. This paper has addressed the issue through the lens of rail and its dramatic turnaround across the globe. The rise of rail in its first incarnation was a major part of the industrial revolution and led to a new kind of urban form. In its second rise, rail again seems to be having a structural, economic and cultural change at its heart. The rise is due to limits on car-based cities that have well and truly set in to cities in the developed world and probably have set in to cities in the emerging world, as evidenced by the trends in countries in Asia and the Middle East [40]. As traffic speeds slowly and city centers continue to grow, there will be an acceleration of the need for fast rail links across, around and between cities. The importance of travel time and its reflection in urban fabric continues to drive the core demand for urban rail. But it is also the case that urban economy and culture are moving toward a more people-centered urban form that is less car-based and less suburban [41]. This demise of car dependence is an historic global trend that appears now to be a major driver of change in our cities.
This is good news for matters like climate change and peak oil that threaten to sink the economies of major global cities unless dramatic change occurs [42-44]. If the arguments in this paper are correct then the structural change we need to enable this dramatic change could well be underway. The need to make the most of this trend should be high on the agenda of any large or small city.
Application of the new approaches outlined above, especially value capture to help fund new rail options, may well make these projects viable for many more large and small cities that want a way out of their car dependence.
8. Acknowledgements
The authors are grateful for the assistance of Monika Brunetti and Phil Webster in helping to prepare some of the data used in this paper and in layout.