The Effect of Patchy Host Distribution on the Dynamics and Persistence of Directly-Transmitted Pathogens: A Cellular Automata Study ()
1. Introduction
Fragmented populations of endangered flora and fauna may be exposed to greater stresses than populations that are larger and more continuous [1]. Increasing the amount of edge or transition area between habitats may increase exposure to predation, parasitism and environmental stressors. From the perspective of certain plant hosts, some of these effects may be positive, such as decreased herbivory when patches become isolated due to the destabilizing effects of habitat fragmentation on local populations of insect herbivores [2,3]. Associations between host spatial structure and pathogen dynamics have been observed with rusts and smuts of various plants [4-7], where patchiness appears to prevent the perpetuation of outbreaks.
For pathogens that rely on close contact for transmission, the configuration of populations in space may greatly affect the rate and stability of epidemic outbreaks. Such effects have been repeatedly noted in the natural documentation and simulation of measles outbreaks [8, 9].
Distributions of organisms that are organized into discontinuous clusters display especially complex and unpredictable dynamics. The manner in which such ensembles of populations or “metapopulations” are arranged can affect the persistence of certain populations both free-living or parasitic. In metapopulation models of free-living organisms, dispersal can either stabilize [10,11] or destabilize [12] populations depending on how far, and with what frequency organisms disperse. Parasitoid populations seem to persist less stably in the face of strong dispersal in structured metapopulations than do free-living organisms [13].
The mathematical modeling of infectious disease transmission still generally relies on non-spatial methods based on ordinary differential equations (ODEs) pioneered early in the 20th century [14]. These techniques treat time and state as continuous entities and assume that populations are homogeneous and completely mixing. Various extensions of the basic method have been developed to recreate some level of natural complexity by simulating spatial or social discontinuity. Stochastic models also allow for the effects of chance on small populations or subsets of larger ones.
These extensions generally rely on subdividing populations into smaller groups with shared characteristics. Such methods become very quickly limited in how much spatial structure they are able to represent before becoming computationally intractable.
Cellular-automata offer an opportunity to study the effect of host spatial distribution on the dynamics of infectious disease transmission in a manner that captures the full complexity of the spatial structure of natural population distributions [15].
Cellular automata are discrete mathematical systems that allow “bottom-up” simulations of complex systems by applying simple sets of local rules to a matrix of integers over time [16]. These rules take into account both the state of individual cells and those that neighbor them [17]. Rule sets can be probabilistic or deterministic. Neighborhoods may include only adjacent cells, or any number of concentric groupings or layers outward and upward. Thus, automata are ideally suited for simulation of complex systems that depend on local interactions between discrete entities, and useful for understanding dynamics of biological systems [18].
Automata have been widely applied to ecological systems including forest gap dynamics, forest fires [19], and to explore fundamental properties of spatial distributions in eco-systems [20]. It the life sciences it has been used, for example, to study dynamics of neural populations [21] and to model proliferation of tissue growth [22]. Epidemics modeling with cellular automata has been previously implemented to study the spread of disease among moving individuals [23,24]. Applications include simple models of measles outbreaks [25], effect of vaccination [26], to explore drug therapy for HIV [27] and to study transmission of vector borne diseases [28].
Here we apply methods derived from stochastic automata to explore the effect of host organization in specific spatial pattern on the persistence and intensity of outbreaks of directly-transmitted pathogens.
2. Methods
2.1. Host Population Distribution
Patchy population distributions were created by first seeding 100 cells randomly in a blank matrix then applying a cellular automata-based growth algorithm that used various rules governing the probability of an empty cell becoming occupied based on the number of neighboring cells that were already occupied. In some cases, probabilities were weighted more heavily along certain axes in order to create long, narrow aggregations. These population growth models were suspended once the population reached 10,000.
To produce more variation in patterns, differing numbers of initial seeds were used to initiate growth and were allowed to expand for different durations until the population size limit was reached. To produce more linear patterns, probabilities of growth were weighted to favor expansion along particular axes. The intensity of the weighting affected the length and width of the resulting pattern which is shown in Figure 1. For each distribution Moran Coefficients (MC) and perimeter/area ratios (PA) were calculated to characterize aggregation as presented in Table 1. The Moran Coefficient (MC) is a powerful method to assess spatial dependence or auto correlations [29,30].
MC = 0 indicates total randomness, while MC = 1 indicates maximum spatial clustering; values in between indicate various degrees of aggregation. See Figure 1.
2.2. Initial Conditions
All simulations were encoded using the interpreted “J” programming language (Version 4.62, Iverson Software), which is optimized for array manipulation. Simulations were structured as follows:
Assumptions and rules:
1) The environment is represented by a square matrix (224 × 224) of 50,176 integers.
2) Population distributions of hosts are represented by 10,000 variously distributed cells.
Patchy population distributions were created by first seeding 100 cells randomly in a blank matrix then applying a cellular automata-based growth algorithm that used various rules governing the probability of an empty cell becoming occupied based on the number of neighboring cells that were already occupied. In some cases, probabilities were weighted more heavily along certain axes in order to create long, narrow aggregations. These population growth models were suspended once the population reached 10,000.
3) Codes representing the current infective state of individual cells are as follows:
0 = unoccupied
1 = susceptible and uninfected
2 = infected and infectious
3 = immune
4) Time (t) advances in discrete units of one week per time step.


Figure 1. Host population distribution patterns used as the basis for simulated epidemics. The first level Moran Coefficient of spatial autocorrelation is indicated below each matrix.
5) During each time step (t), an infection can be transferred from a source (i) to adjacent or nearby contacts up to 4 cells away from the source, as described in Figure 2.
The basic structure of an automaton is as follows:
 (1)
(1)
The future composition of a matrix  is thus a function of the current state of that matrix
  and external factors
  such as treatment or vaccination that might be imposed. In the present simulation, only the internal state of the matrix is considered.
6) The probability of a set of contacts giving rise to an infection is calculated using a state transition probability function as in Figure 1.
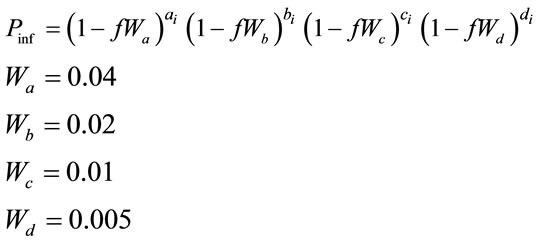 (2)
(2)
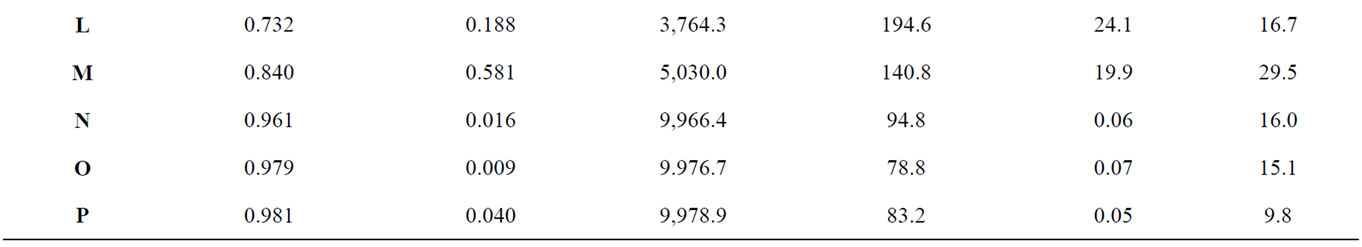

Table 1. The average total number of infected hosts and the average total duration of simulated outbreaks occurring with each pattern were compared with statistics describing the shape of each host distribution, including the Moran spatial autocorrelation coefficient and the perimeter to area ratio (Force of infection = 2, n = 30).
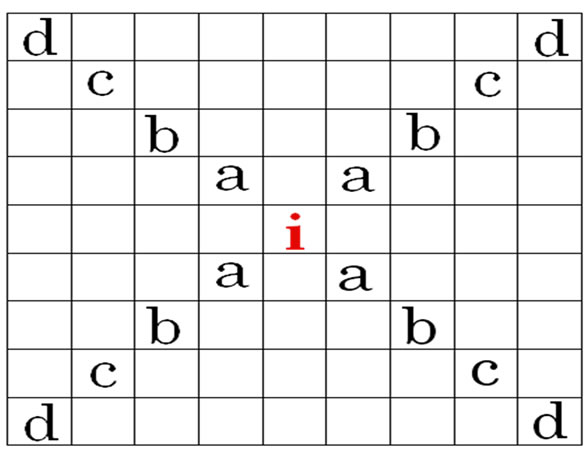
Figure 2. Diagram of stochastic automaton model structure.
where:
 = the probability that an uninfected host becomes infected.
 = an index of the relative transmissibility of a particular pathogen.
 = the number of infective neighbors at each distance a-d.
 = the relative effect of distance on relative transmissibility portraying a geometric decline.
7) For each time step, transitions from an uninfected state to infected are determined by comparing the probability of transmission to each uninfected cell  to a set of randomly generated numbers between 0 and 1 using the Mersenne Twister algorithm.
8) Births and mortality from other causes are not considered due to the short term (up to several months) that was assumed for the duration of an outbreak.
Each simulation was terminated until extinction of the pathogen occurred and all infected individuals either became immune or dead, however long that required. For each of the eight distributions, simulations were replicated 10 times and averaged.
3. Results
The spatial characteristics (shape, density) of host population distributions were found to greatly affect the dynamics of infectious disease outbreaks. Epidemic curves generated for each distribution (Figures 2(a)-(p)), were diverse in amplitude and period (Figure 3). The least aggregated population (Figure 2(a) produced a peak incidence of less than 100 daily cases during the simulated outbreak, while the most aggregated conditions (Figures 2(o)-(p)) produced a peak incidence of 5000 daily cases. Each of the other distribution patterns produced incidence peaks that were intermediate between these two extremes. These incidence peaks reflect the cumulative morbidity for each of the simulated outbreaks.
The mean number of infections occurring in an outbreak tended to be positively associated with the intensity of spatial autocorrelation (Figure 4) as represented by the first order Moran Coefficient (R2 = 56.7%). The average magnitude of an outbreak was also strongly, but negatively associated (R2 = 41.3%) with the perimeter/ area ratio (Figure 5).
Spatial autocorrelation was much less significantly associated (R2 = 21.4%) with the average duration of outbreaks (Figure 6). The association between perimeter/ area ratio and outbreak duration (Figure 7) was similarly weak (R2 = 25.7%).
Variation in the total number of infections occurring in an outbreak between simulations tended to be negatively associated (R2 = 61.4%) with the degree of spatial autocorrelation (Figure 8). Perimeter/area ratio (Figure 9) showed a milder, positive association (R2 = 40.2%) with the average magnitude of outbreaks. The duration of outbreaks was less strongly associated with either the Moran Coefficient (R2 = 30.5%,) or perimeter/area ratio (R2 = 27.9%).
Spatial statistics that account for degree of aggregation and exposure did not always suffice to explain the variation in outcomes between simulated outbreaks. Other aspects of shape, such as degree of elongation and fenestration may have impacted outbreak dynamics. For ex-
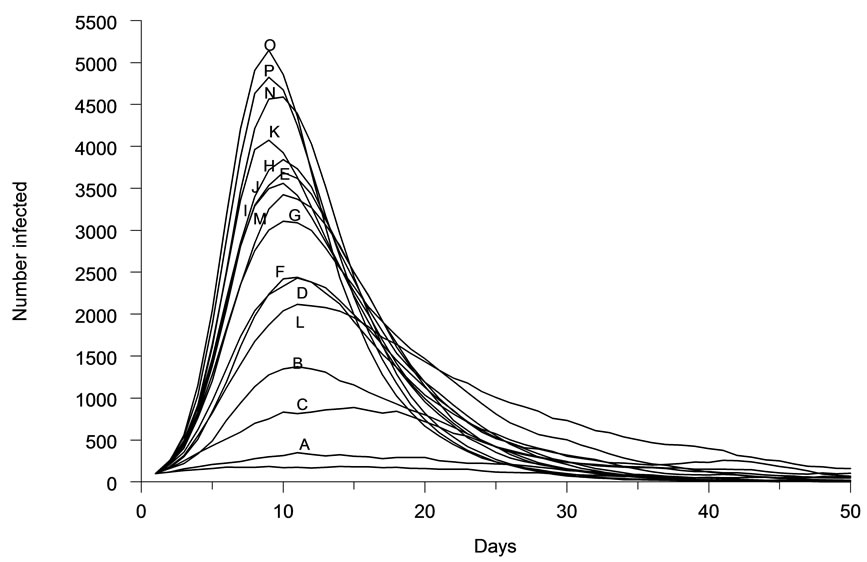
Figure 3. Representative epidemic curves for each of sixteen host population distribution patterns.
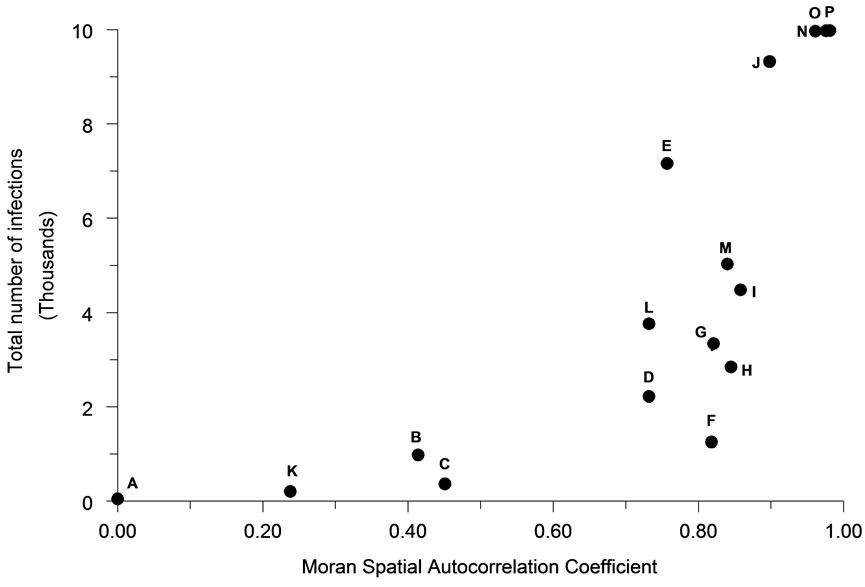
Figure 4. The relationship of spatial autocorrelation to the total number of infections occurring for each population distribution pattern (n = 30).

Figure 5. The relationship of perimeter to area ratio to the total number of infections occurring for each population distribution pattern (n = 30).

Figure 6. The relationship of spatial autocorrelation to the total duration of outbreaks for each population distribution pattern (n = 30).
ample, cumulative number of infections was lower in elongated patches (MC = 0.84) with a higher perimeterarea ratio (Figure 2(m)) relative to a more clustered distribution (MC = 0.858) with more rounded patches and a lower proportion of individuals along boundaries (Figure 2(i)). The persistence of outbreaks of infectious disease was also affected by the shape of host distribution patterns. Generally, the time required for epidemic outbreaks to resolve and for transmission to cease increases as the degree of aggregation increases. Spatial discontinuities between individuals and groups of individuals increase the probability that transmission will be interrupted and that epidemics will abort. This general trend of extended transmission with increasing density can again be modified by altering the shape of particular distributions, particularly when the force of infection is relatively high. A population of elongated patches (PA = 0.581) persists longer than a population of similar density but lower perimeter-area ratio (PA = 0.449). Thus, both population density and the shape of population distributions can determine the intensity and persistence of outbreaks of infectious diseases.
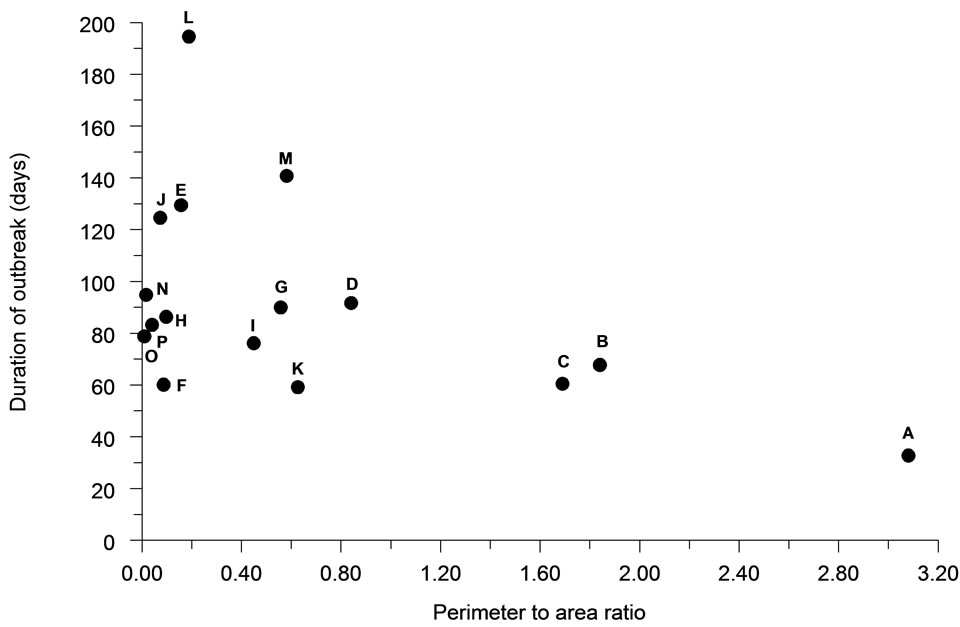
Figure 7. The relationship of perimeter to area ratio to the total duration of outbreaks for each population distribution pattern (n = 30).

Figure 8. The relationship of spatial autocorrelation to the coefficient of variation for the total number of infections occurring for each population distribution pattern (n = 30).
4. Discussions
The degree of fragmentation and the connectivity of population distributions contribute to the dynamics of the spread of infectious pathogens. The shape of population distributions can affect both the duration of persistence of an epidemic outbreak. While the intensity of contacts reflected by density was also a critical factor, differences in shape had the ability to negate trends that were otherwise apparent across a gradient of density values.
Shape modulates the intensity of infectious contacts in a population by altering the number of individuals exposed on the edges of a distribution. When the perimeter to area ratio is small, the population behaves more like a homogeneous distribution. For a given density, when the perimeter to area ratio is large, simulations tended to terminate more quickly, and left a greater number of individuals uninfected.
Habitat fragmentation may either protect populations or render them more vulnerable to disease outbreaks, depending on the nature of the pathogen and the arrangement and size of habitat patches. Protection may be
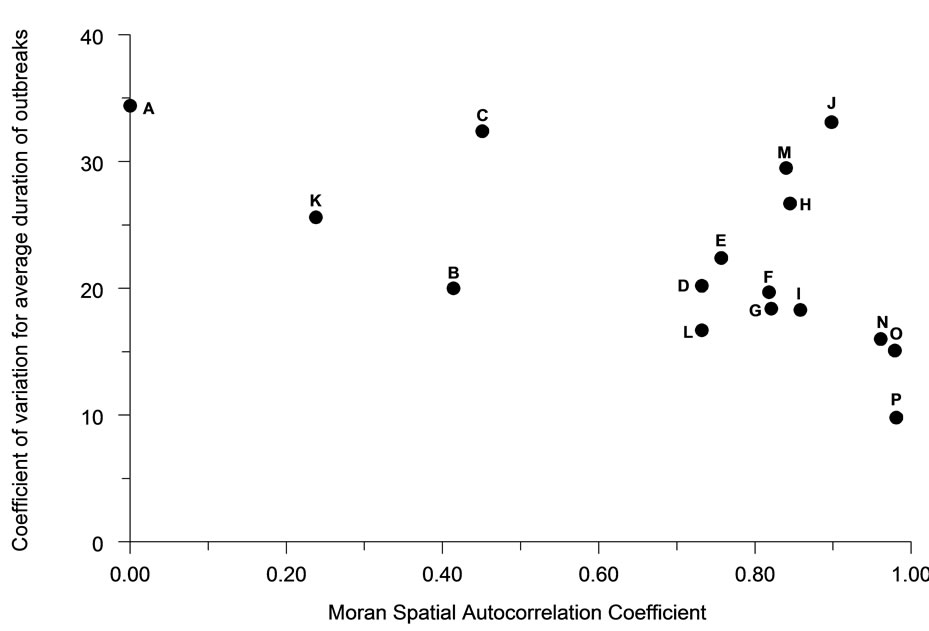
Figure 9. The relationship of perimeter to area ratio to the coefficient of variation of the total duration of outbreaks for each population distribution pattern (n = 30).
provided in certain cases by fragmentation by interrupting transmission between patches. In natural populations of a Swiss wetland plant (Primula farinosa), outbreaks of smut fungus (Urocystis pimulicola) were more likely to occur in larger, more contiguous habitats [7].
Conditions might be considered as well in which fragmentation allows a pathogen to persist by imposing asynchrony on its infection dynamics. While an active outbreak is occurring in one patch, other patches are recovering and increasing their immunologic vulnerability through the recruitment of young individuals. Certain pathogens, especially those which either kill or render hosts permanently immune, might be expected to cause their own extinction in host populations that are distributed uniformly and contiguously.
These results may be important in terms of evaluating trends in local and global biodiversity. Models similar to this may define more precisely the vulnerability of spatially discontinuous populations to pathogens, particularly populations of threatened flora and fauna that have become isolated through habitat fragmentation. Population viability analyses (PVAs) have not been reliable in defining these risks, partly because of the complexity that homogeneous models fail to capture but which can be highly relevant to outcomes. The manner in which hosts are distributed can fundamentally affect the dynamics of disease spread through a population.
5. Acknowledgements
This work was supported in part by a grant from the Robert Wood Johnson Foundation to Tamara AwerbuchFriedlander. Also we thank Hyung Park for helping edit the manuscript.