Repeatability of 3D OCT Pachymetry in Eyes with and without Contact Lens Induced Corneal Swelling ()
1. Introduction
Corneal thickness is an indirect measurement of the physiological function of cornea, so the pachymetry, especially in the central area, is important for diagnosis, treatment and monitoring some eye pathologies of the anterior segment [1]. Central corneal thickness measurement has become increasingly important in the assessment of a variety of corneal diseases, the precision of intraocular pressure readings in glaucoma diagnosis and management, and eligibility of patients considering refractive surgery [2] and others. Furthermore, changes in corneal thickness can be a warning sign of endothelial cell loss, which can be helpful in evaluating the safety of iris-fixated phakic intraocular lenses or intraocular surgery for example in cataract surgery [3].
On the other hand, contact lenses (CL) wear is a common way to correct eye refractive errors like myopia, hyperopia or astigmatism with millions of wearers in the world. However, CL wear is associated with adverse ocular responses, most of them related with corneal swelling, when the cornea is subjected to hypoxia [4]. Usually, corneal swelling is calculated with the increase of corneal thickness with precise and effective methods, such as optical coherence tomography (OCT) [5].
Besides, corneal swelling is directly related to the oxygen transmissibility (Dk/t) of CLs, and it is a quantitative measurement for assessing the impact of corneal hypoxia of CLs during wear. In fact, it has been shown that there is a direct relationship between the central thickness and corneal edema [6].
OCT is a medical imaging technology that generates high-resolution cross-sectional images of subsurface internal tissue structure in situ and in real time, with a wide variety of applications in medicine. Due to the transparent ocular structures, the main field of OCT applications is the Ophthalmology and OCT was first introduced in 1991 to image the posterior segment of the eye [7] and three years later, in 1994, the first report of anterior segment OCT imaging was reported [8]. Since then, and due to the successful diffusion of the refractive surgery, the refinement of this technique has been permanently progressing for the anterior eye analysis.
There are currently two commercial different types of OCT in ophthalmic practice: time-domain OCT, where the cross-sectional images are produced by varying the position of the reference mirror; and Fourier-domain OCT (primarily developed to assess the posterior segment), where the reference mirror is fixed and the crosssectional images are obtain by Fourier transformation of the spectral interferogram (interference between the sample and the reference reflections) [9].
Fourier-domain systems such as the 3D OCT (Topcon Medical Systems Inc., Paramus, NJ, USA), the Slit Lamp-OCT (Heidelberg Engineering GmbH, Heidelberg, Germany) or the RTVue (Optovue Inc., Fremont, California) provide a faster acquisition than time-domain systems, such as the AS-OCT Visante (Carl Zeiss Meditec Inc., Dublin, CA, USA). In addition, its higher resolution allows the visualization of more details, although time-domain systems shows all anterior segments structures in a single image, while Fourier-domain shows just a little part of a single component of the anterior segment of the eye.
Moreover, OCT allows a wide variety of uses for the anterior segment examination in postoperative eyes. Especially, in refractive surgery procedures, for example in post-LASIK patients is useful to evaluate the flap and the residual stromal bed thickness before a retreatment procedure in order to avoid a post-LASIK ectasia.
One of the major advantages of the OCT systems is that it allows non-invasive measurement of the corneal thickness without CL removing, which makes it an excellent tool to monitor corneal thickness changes during CL wear [5,10].
There are several technologies to non-invasive measurement of corneal thickness such as OCT, Orbscan II and Pentacam. Besides, these non-contact methods eliminate the disadvantage of the ultrasonic pachymetry, with the risk of corneal abrasion and infections due to corneal contact with the probe and discomfort for the patient.
However, there is little information available describing the effect of CL induced corneal swelling in OCT pachymetry measurement, so the purpose of this study was to evaluate the repeatability of 3D OCT corneal pachymetry in eyes without and with different level of CL induced corneal swelling.
2. Material and Methods
2.1. Subjects
Six subjects participated in the study. Three were women and three men (mean age, 27.17 ± 4.1 years; range, 23 - 34). The refractive error in terms of spherical equivalent ranged from +0.50 to −3.00 D (−1.58 ± 1.49 D). Subjects were excluded if they had history of ocular surgery, an active ocular surface disease, such as significant dry eye, papillary conjunctivitis, corneal opacities, current medication that could affect ocular physiology, or if they had previously worn extended CL wear. Subjects reported monocular best spectacle-corrected visual acuity of 20/20 or better.
Informed consent was obtained from each subject after approval was granted by the Human Sciences Ethics Committee of the University of Valladolid. All subjects were treated in accordance with the Declaration of Helsinki.
2.2. Instrumentation
Corneal thickness was measured with 3D OCT-2000, (Topcon, Japan). Three consecutive measurements (#1, #2 and #3) were taken on each cornea during each study visit. The mean of the three scans of each cornea was used as the final result to corneal swelling calculation. The same experimented and masked operator performed all OCT scans during all visits.
The measurement of corneal thickness in the corneal apex was assessed with the tool “caliper” (Figure 1) of the OCT software. This measurement was repeated in all 12 scanned meridians, between 0˚ and 165˚ with 15˚ intervals.
2.3. Procedures
The study was a 1-week, prospective, controlled trial. A CL was randomly fitted in one eye and the fellow eye was used as a control eye. An independent investigator composed the randomized schedule.
This study included five visits over one week: baseline
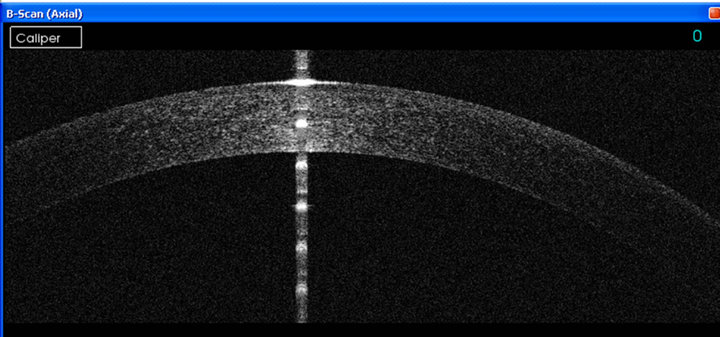
Figure 1. Screen capture of OCT 3D measurements.
and after sleeping with four different CL of +0.50 D, +2.00 D, +5.00 D and +8.00 D (Acuvue 2, Etafilcon-A material, Johnson & Johnson Vision Care, USA) on four different days. Etafilcon-A is a 7 days’ extended wear (EW) approved hydrogel lens in the United States. The difference in power of the CL induces different levels of hypoxia and thus various degrees of corneal swelling.
During the baseline visit (day 0), all participants were screened according to inclusion criteria and pachymetry with OCT was performed. All baseline measurements were performed in the afternoon, between 4 p.m. and 8 p.m., because some authors suggested that this is the time of the day when the eye is physiologically more stable [11]. All follow-up visits were early in the morning and the eye with the CL was occluded while it was worn, to ensure that induced overnight corneal swelling was present at the time of the pachymetry measurement.
2.4. Statistical Analysis
Statistical analysis was performed using the Statistical Package for the Social Sciences (SPSS for Windows software, version 15.0, SPSS, Inc., Chicago, IL, USA). Descriptive statistics included mean, standard deviation (SD), and 95% of confidence interval (CI 95%), were calculated.
Repeatability was assessed with coefficient of variation (CV) and Bland-Altman analysis (mean difference and limits of agreement). Repeated measures analysis of variance (ANOVA) was used to compare the measurements of the every different scan. P value less than 0.05 was considered statistically significant.
3. Results
None of the subjects had significant biomicroscopic signs (grade > 1 in Efron grading scale [12] of CL complications (corneal staining, limbal injection, striae, folds, or others).
3.1. Corneal Swelling
We found an increase of corneal thickness in all eyes after wearing CL. Comparing with control eyes significant statistical differences (p < 0.001 ANOVA) were found between both groups. Eyes who wear CL with lower Dk/t, due to CL thick thickness (more positive power), showed higher corneal swelling, although not significant statistical differences were found (p = 0.614 ANOVA).
3.2. Repeatability of Pachymetry
At baseline visit, (without CL), there were no statistical significant differences between measurements #1, #2 and #3 (ANOVA, p = 0.925). Alike, with every CL used no statistical differences (p > 0.662) were found between repeated measurements (Table 1 and Figure 2).
3.3. Differences in Pachymetry after Wearing CL with Different Power
There were statistical significant differences between corneal pachymetry with and without CL worn (ANOVA p < 0.01). CLs with plus power (+2.00 D, +5.00 D and +8.00 D) showed greater amount of corneal swelling than +0.50 D CL. There was statistical significant different between +0.50 D CL and +5.00 D CL (p = 0.002 ANOVA with Bonferroni correction). Also, there was a difference between +0.50 D CL and +8.00 D CL (p = 0.001 ANOVA with Bonferroni correction) Figure 2.
3.4. Repeatability of Pachymetry of Different OCT Scans in Different Corneal Meridians
Table 2 shows descriptive analysis of pachymetry measurements at 12 different meridians without statistical significant (p > 0.05 ANOVA) differences among them.