GIS-Based Multi-Criteria Decision Analysis (MCDA) and Analytical Hierarchy Process (AHP) Techniques to Derive Flood Risks Management on Rice Productivity in Gishari Marshland ()
1. Introduction
At least 3 million people have died and almost 800 million people have been negatively impacted by natural catastrophes during the previous 20 years (Safaripour et al., 2012b) . One of the most catastrophic natural catastrophes that affect numerous sectors of the global economy and cause major damage is flooding (Sun et al., 2020) . The effects of climate change and fast urbanization can be linked to the rise in the frequency of flooding. According to statistics, floods make up 34% and 40%, respectively, of all natural catastrophes that occur globally (Lyu et al., 2019) and (Petit-Boix et al., 2017) .
Flood catastrophe is one of the challenges farmers have so far encountered, particularly lowland rice growers in Indonesia. Floods have a significant influence on the fall in rice output, which has an effect on the revenue of farmers. According to data for the past three or four years, 39,000 hectares of lowland rice fields are flooded on average every year, which lowers production yields and causes crop failure (Pirngadi, 2022) . In the Nigerian state of Anambra, 100% of the irrigated crop farmers who participated in the study said that floods had destroyed 80% of their crop, compared to 18% of farmers who reported losses of 40% - 70% and 5% of farmers who reported no losses at all (Enete et al., 2016) . Rice production in Bangladesh decreased as a result of crop failures that occurred as a result of flash floods that occurred on 27,754 ha of rice fields in Northeastern Bangladesh at the beginning of 2017 (Ahmed et al., 2017) . Because the flood devastated agricultural infrastructure like rice irrigation, farmers now face crop failure, which has an effect on productivity (Pirngadi et al., 2018) .
Additionally, Asian countries mainly in Iran, as a country with a high rate of natural disasters, has suffered from the loss of over $ 3.7 billion (Okonufua et al., 2019) and (Naieni & Ardalan, 2006) . Flooding is dangerous, particularly along the southern shore of the Caspian Sea and in northern and northeastern Iran, which was afflicted by a powerful flood in August 2001 that killed 210 people and cost $ 31 million in damage. During 2002-2011, there were also dangerous and smaller floods at the same places, which led to a loss of $ 65 million and the deaths of 28 people (Safaripour et al., 2012a) . Flood risk is one of the most devastating natural hazards in Ethiopia, followed by landslide incidents, which have caused significant damage to buildings, crops, farms, infrastructures, and fatalities in African countries, like Ethiopia (Woldearegay, 2013) . For instance, the 2019-2020 flood hazard caused more than 44,500,000 people to be displaced, damaged large tracts of arable land (more than 25,000 ha), 45 damaged a variety of engineering structures, destroyed more than 35 homes, and claimed 46 lives in the Ethiopian regions (Tamiru & Dinka, 2021, Bizimana & Schilling, 2009) while in Rwanda two sensitive sectors of infrastructure, four sensitive economic sectors and approximately 500 people were identified as vulnerable (Bizimana & Schilling, 2009) . In addition, detailed flood risk mapping is necessary to reduce the hazards of flooding and accordingly, GIS was applied as a tool for flood risk mapping (Mugiraneza et al., 2019) .
For the Rwandan case, the scholars like Rwanyiziri and Rugema (2013) proved that Flooding in lower zones of altitude along river Akanyaru have been reported for many times in the study area as causing the submergence of rice fields thereby damaging the growth and reducing the productivity of rice. To date, the use of GIS and RS, along with multi-criteria decision-making techniques, such as the analytic hierarchy process (AHP), have been explored in flood risk assessment of mountain cities (Lin et al., 2020) and (Zhang & Chen, 2019) . Although previous approaches have gained great achievements in the field, they do not pay much attention to uncertainty of floods caused by specific environmental characteristics of mountain cities (Terzi et al., 2019) . Considering Gishari sub catchment as case of interest, there is significant variation on environment (such as elevation difference, surface coverage), socio-economic (such as population, built environment) and disaster-bearing bodies (such as transportation, facilities) in various regions (Zhang et al., 2019) . These features greatly decrease the robustness of the risk assessment method, and further reduce the certainty of the weight of the assessment index and the accuracy of the assessment result. In flood risk assessment, the uncertainty of the AHP cannot be eliminated, but it can be mitigated with a proper flood predictive system (Cai et al., 2021) .
In the review of literature, several methods has been developed for natural hazards susceptibility mapping such as flood, landslides and avalanches, it can be classified as (i) Expert knowledge-based models such as Analytic Hierarchy Process (AHP) (Kazakis et al., 2015, Kumar et al., 2017, Rahmati et al., 2016, Shirzadi et al., 2017) ; information value (IV) (Chen et al., 2015, Hammami et al., 2019) ; certainly factor (CF) (Chen et al., 2016, Hong et al., 2017) ; Logistic Regression (LR) (Mousavi et al., 2011, Chapi et al., 2017) ; weights-of-evidence (WOE) (Tehrany et al., 2014b) and (Rahmati et al., 2016) ; Fuzzy Logic (Pulvirenti et al., 2011) ; Neuro-Fuzzy Logic (NFL) (Bui et al., 2016) ; (iii) Machine learning models such as artificial neural network (ANN) (Kia et al., 2012) ; Adaptive Neuro-Fuzz Inference System (ANFIS) (Shirzadi et al., 2017) ; and (ANFIS-Genetic Algorithm (ANFIS-GA) (Hong et al., 2018) ; ANFIS and differential evolution (ANFIS-DE) (Hong et al., 2018) ; ANFIS and biogeography-based optimization (BBO) and BAT algorithms (BA) (Ahmadlou et al., 2019) ; Decision tree (DT) (Khosravi et al., 2018) ; Support vector machine (SVM) (Tien Bui et al., 2018) ; K-Nearest Neighbour (KNN) (Liu et al., 2016) ; Hybrid/Evolutionary models (Shafizadeh-Moghadam et al., 2018) and Random Forest (RF) (Wang et al., 2015) ; and (iv) Hydrological models such as Hydraulic Engineering Center-River Analysis System (HEC-RAS) (Getahun & Gebre, 2015) ; and Soil Water Assessment Tool (SWAT) (Oeurng et al., 2011) respectively. In order to take precautions and minimize the damage caused by floods in our study area, we are interested in the identification and delimitation of flood areas based on the multi-criteria decision making method (MCDM), integrating geographic information system (GIS) software, remote sensing (RS), shuttle radar topography mission (SRTM), and the AHP. Moreover, the methodology adopted in the present study helps making decisions, based on statistical modelling (AHP) (Hong et al., 2018) . Therefore, we are talking about the combination of the geospatial multi-criteria decision making (GIS-MCDM) and statistical (AHP) modelling (Paquette & Lowry, 2012) .
2. Study Area and Data Used
Figure 1 shows the geographical location of the study area. The Gishari sub catchment area is located in Rwamagana district, the Eastern Province of Rwanda. It is geographically located at 1˚57'12.65"S and a longitude of 30˚26'19.12"E or −1.953513 and 30.438644 respectively. The topography characteristic slope land varies from 7% - 15% and precipitation less than 1500 mm per year, even altitude varies from 1480 - 1550 m Above Sea Mean Level (A.S.M.L). In this study, more than 10 soil types based on soil dominant and taxonomy composed in the Gishari Sub catchment were observed. The major soil were Ferralsols, Acrisols, histosols and water bodies. There are also Gleysols, Combisols, Alisols and Regosols.
The climate of the study area is classified as subtropical monsoon. According to the Rwanda Meteorological Agency (RMA) and Data from NASA (https://power.larc.nasa.gov/data-access-viewer/), the average annual rainfall at Gishari sub catchment weather station, over the period 1990-2021, ranged from 750.5 mm (1990) to 1340.8 mm (2021). On average, there are 11688 mm for the duration of 30 years, and the rainy season from January to December were considered to be 1061 mm per year. The average annual temperature is 20˚C. According to the statistics of the Gishari sector/Rwamagana district, about 1678 people in the study area were affected by flooding. The damage to property has
![]()
Figure 1. Description of the study area.
been estimated at about US$ 2.48 Billion annually. However, very few research articles have been published in Rwanda, or measures taken to predict flood sites and prevent damage. Thus, the researchers were interested in conduction a study on flood risks management and susceptibility assessment in this area.
2.1. Hydrological Map of the Gishali Watershed
Figure 2 pertained to the hydrographical map if the study area. It encompasses the wetlands, rivers, lakes, and roads networks. Understanding the hydrology of Gishari Gishari watershed is crucial for managing water resources, predicting flood events, designing water infrastructure, and maintaining the overall health of ecosystems within the watershed. It has been noticed that the Gisahri watershed is characterized by Lake Muhazi and one tributary which Rwarutemya river. There are also agricultural marshland lands like Kaboroga, Kibonamvugo, Muryango-Bigezi and one part of Muhazi wetlands.
2.2. Methods
2.2.1. Analytic Hierarchy Process (AHP)
The gathering of RS and GIS data used to create the flood danger map is the foundation of the current work. The flood danger map was created using eight
![]()
Figure 2. Hydrographical map of the study area.
![]() Source: Authors’ data, 2022.
Source: Authors’ data, 2022.
Figure 3. Analytic hierarchy process (AHP) technique applied to assess the flood hazard map of the Gishari Agricultural Marshlands.
regulating criteria. To evaluate the flood danger map of the Gishari Agricultural Marshlands, the AHP approach was applied to the thematic maps of these elements.
2.2.2. Multivariate Statistical Analysis (MSA)
A common kind of MSA called logistic regression (LR) takes into account a number of variables that might influence the likelihood that a flood would occur. This technique has the benefit that the data do not require a normal distribution and that the conditioning factors can be continuous, discrete, or any mix of the two types (Tehrany et al., 2014a) . The first time LR was used was by McFadden (1974), who used a particular formula to construct the conditioning factors in order to measure the likelihood of any disaster occurring in a certain location. As shown in the aforementioned subheadings, this approach may analyze the relationship between binary dependent variables using scalar and nominal values as conditioning factors (Jobson, 2012) . Flooding is employed as a dependent variable (binary) in the current study, with values of 0 and 1 indicating whether flooding is present or not (Binary model). The LR generates weights for each conditioning component that may be utilized in GIS to create a map showing the likelihood that a flood would occur (Jobson, 2012) . The multivariate LR analysis was performed using STATA 15.0 and Origin Pro 19b software. It is expected that the higher the value of a logistic coefficient, the greater will be its impact on the occurrence of flooding (Ayalew et al., 2005) . The formula in Equation (2) expresses the probability map generated from the derived logistic coefficient:
(1)
where p denotes probability of flooding as a value between 0 and 1 on an S-shaped curve. Z is the linear combination and thus LR involves the fitting of an equation of the form of Equation (3) to the data:
(2)
where β0 is the intercept of the model, βi (i = 1, 2, 3, 4, 5 and 6) represents the coefficients of the LR model, and xi (i = 1, 2, 3, 4, 5 and 6) denotes the conditioning factors (Slope, topography, soil, geology structures, precipitation and LULC) (Pourghasemi et al., 2012) . If the LR coefficient is positive, the area's presence of the conditioning factor is more likely to result in a flood. The results of the logistic coefficients indicate that the probability of flooding is negatively correlated with each individual element (Ozdemir & Altural, 2013) .
2.2.3. Crop Yield Model
The creation of a crop yield estimation model at the grid scale involved reconstructing NDVI time-series data, as described by Huang et al. (2017) , specifically focusing on agricultural regions in Gishari agricultural marshlands. This process entailed masking the dataset with the shapefile of agricultural areas from Indonesia's Geospatial Information Agency. Prior to analysis, various preprocessing steps were undertaken, including removing unfavorable atmospheric conditions as outlined by Pan et al. (2017) . These steps encompassed image mosaicking to ensure comprehensive coverage of the study area, layer stacking of NDVI images to establish a time series, and smoothing of the NDVI data. The smoothing procedure utilized Savitzky-Golay filtering techniques, as referenced in Chen et al. (2010) , spanning the years 2015 to 2021. Subsequently, non-significant variables were eliminated through stepwise multiple linear regression analysis, following the methodology proposed by Litell et al. (1991) , resulting in the development of a crop yield model for each grid based on the following equation:
(3)
where Y is seasonal crop yield (ton/Ha), ∇0 intercept while ∇1, ∇2 and ∇3 are slopes for X1, X2 and X3 respectively.
3. Results and Discussions
An inverse link between the corresponding conditioning factor and the likelihood of flooding is shown by a negative coefficient. Table 1 displays the coefficients produced by the logistic regression analysis. Contrary to earlier, comparable research (Vojtek & Vojteková, 2019) , (Al-Juaidi et al., 2018) , (Trott et al., 2018) and (Liu et al., 2018) , elevation could take a negative coefficient, indicating that flooding is unlikely at higher elevations. Indicating that each independent variable is statistically significant in predicting flood vulnerability, all the independent variables had p-values lower than 0.05. The main causes of flooding in the Gishari marshes are predicted using economic data from multivariate analysis. The 5% threshold for statistical significance was established. According to the econometric results, elevation (DEM) and changes in land use and cover were the primary causes of floods and statistically significant at the 5% level of significance According to the study’s findings, elevation significantly contributed to floods at a level of significance of 0.0005 percent. The higher elevation in Rwanda results in a larger runoff coefficient, which, in turn, causes a lot more water to collect in the marshes. The risks of a flooding occurrence was also discovered to be reduced the higher one was above the Base Flood Elevation. The negative coefficient of slope implies that flatlands and gentle slopes are highly vulnerable to flooding and agrees with the findings of Abeysiriwardana and Wijesekera (2022) and (Chen et al., 2022) . As a result, the research Islam et al. (2021) , which produced comparable results, supports these findings. Additionally, the results of the study showed a strong and positive link between flooding
![]()
Table 1. Multivariate analysis of the major factors contributing to flooding in Gishari marshlands.
Note that ** stands for level of probability at 5%. Source: Authors’ data, 2022.
status and LULC change in Gishari Marshland. According to the study’s findings, LULC significantly contributed to flooding at a level of significance of 5% percent. The LULC contribute to the cover vegetation and once different types of LULC increases, the runoff coefficient will be reduced; thus these agree with the research conducted by (Zope et al., 2016) . The econometric model can be written as follow:
In which, FS is flood susceptibility, S is slope, E is elevation, Dr is distance from river, R is the annual rainfall while LU is land-use type of the Gishari agricultural Marshlands.
Multivariate analysis of the major factors contributing to flooding involves examining multiple variables simultaneously to understand their collective impact on flood events. This type of analysis helps identify the complex interactions and relationships among various factors contributing to flooding. The econometric model can be written as follow:
Table 1 presents the causal factors to flooding in the Gisahri Agricultural marshlands. The multivariate logistic analysis showed that only three causal factors contributed statistically significant to flooding and impacted on rice productivity in Gishari marshland. For Digital elevation model (DEM), it can explained that the changes in a Digital Elevation Model (DEM) can have a direct impact on flooding analysis, which in turn can reduce rice productivity. From this perspective, A DEM provides critical elevation information that helps model how water flows across a landscape during flooding events. If the DEM is outdated or inaccurate due to changes in the terrain, such as construction, excavation, or erosion, the predicted flood patterns might not reflect the actual water flow. This could result unexpected flood extents and depths, potentially inundating rice fields that were not previously at risk and this, expectedly explained that the increase 1 m in elevation would reduce the rice productivity by 0.17% due to unplanned flood risks in marshland. Flooding can damage rice crops by submerging them under water for extended periods, leading to poor growth, reduced yields, and even crop loss. In conclusion, changes in a Digital Elevation Model (DEM) can disrupt the accuracy of flooding analysis, leading to unexpected flood patterns, inadequate drainage, uneven irrigation, soil erosion, sediment deposition, limited oxygen availability, and increased disease and pest pressures. All these factors can collectively contribute to reduced rice productivity by negatively impacting crop growth, yield, and quality. Accurate and up-to-date DEM data are essential for effective flood mitigation and maintaining optimal rice production.
Secondary, the change in rainfall distribution in Gishari agricultural marshland would also decrease the rice productivity by 0.0018%, which is a sign that rainfall is a major factor of flooding in rice scheme. Rainfall distribution plays a crucial role in flooding analysis and can directly impact rice productivity. From this understanding, rainfall patterns with the marshland would cause the Increased Flood Risk where Uneven rainfall distribution can contribute to sudden and unexpected floods. If heavy rainfall is concentrated in a specific area, it can overwhelm drainage systems and lead to rapid flooding. Floodwaters can submerge rice fields, damaging crops, causing root stress, and reducing photosynthetic activity. Flood-induced stress can result in poor tillering, reduced grain filling, and ultimately, lower rice yields. Therefore, uneven or excessive rainfall distribution can significantly impact rice productivity through effects such as waterlogging, runoff-induced erosion, flood risks, nutrient leaching, disease and pest outbreaks, delayed planting and growth, and challenges in harvesting and post-harvest operations. Proper water management, including effective drainage and irrigation strategies, is essential to mitigate the negative impacts of irregular rainfall distribution on rice cultivation and maximize crop yields.
Oppositely, another causal factor was Land Use Land Cover (LULC), where the Multivariate Logistic Regression Model Analysis findings’ showed that the increase of one unit in Land Use Land Cover would increase rice productivity by 0.17% of the total rice productivity from the Gishari Agricultural Marshland. Land Use and Land Cover (LULC) changes can indeed influence flooding analysis and potentially increase rice productivity. In this analysis, terracing and contour farming techniques can help control water runoff and erosion. These practices involve creating level platforms on slopes to slow down water flow and encourage water infiltration. Terracing can prevent soil erosion and reduce the risk of flooding downstream. Well-managed terraced fields can provide stable conditions for rice cultivation, leading to higher yields. There is also planting vegetation along riverbanks and water bodies, which reduced and stabilized soil, thereafter, reduce erosion, and improve water quality. These buffer strips can slow down floodwater movement and filter sediment and pollutants before they reach rice fields. Cleaner water and reduced soil disturbance contribute to better soil health and improved rice productivity. To sum up, strategic LULC changes can be designed to enhance flood regulation, reduce soil erosion, improve water management, and ultimately increase rice productivity. By incorporating sustainable land use practices that consider the natural hydrology of the region, rice fields can become more resilient to flooding events and more conducive to consistent, high-quality rice yields.
3.1. Factors Influencing Flood Hazard Zoning in Gishari Agricultural Marshlands
Referring to findings generated from the econometric model, the major controlling factors are not only limited to elevation, but also to Soil types, slope, Distance to River/Flow Length, LULC, and Rainfall. The overall map and descriptive data showed that the watershed’s mean annual rainfall shows the highest levels in the Southern East portions (1104.9 - 1166.3 mm∙yr–1) and a southwest gradient toward Muhazi Lake. The lowest rainfall was located in the western zone of the Gishari Agricultural Marshland with a mean precipitation of 973 - 1001 mm∙yr–1.
While it might seem counterintuitive, high elevations can indeed contribute to flooding events under certain circumstances. Flooding can occur in areas with high elevation due to several factors and interactions with other environmental conditions. It is important to note that the risk of flooding in high-elevation areas varies depending on factors like local topography, climate, weather patterns, and land use practices. Proper land use planning, early warning systems, and flood preparedness measures are essential to mitigate the impacts of flooding events in high-elevation regions.
Land Use Land Cover (LULC) plays a significant role in influencing flooding events by altering the way water is managed and flows through an area. Human activities and changes in land use can lead to increased runoff, reduced infiltration, and changes in drainage patterns, all of which can contribute to flooding. To mitigate the impacts of LULC on flooding, sustainable land management practices are essential. This includes maintaining natural vegetation, preserving wetlands and floodplains, designing proper drainage systems, and considering the potential effects of LULC changes on flood risk when planning new development projects.
Slope is a critical factor that can contribute to flooding events, especially in areas with steep terrain. The steepness of the land surface affects the speed of water runoff, soil erosion, and the potential for flash flooding. To manage the impact of slope on flooding, it is important to consider land use planning, engineering solutions, and proper management of natural drainage systems. Implementing measures such as terracing, erosion control, proper grading, and the preservation of natural vegetation can help mitigate the effects of slope on flooding events.
Rainfall is one of the primary factors that can contribute significantly to flooding events. The intensity, duration, and distribution of rainfall can determine the amount of water that enters the drainage systems, rivers, and streams, potentially overwhelming their capacity and leading to flooding. To manage the impact of rainfall on flooding, communities can implement flood forecasting and warning systems, maintain proper drainage infrastructure, adopt sustainable land use practices, and plan for floodplain management. By understanding the interaction between rainfall and other factors contributing to flooding, mitigation efforts can be more effective in reducing the risk and consequences of flooding events.
Aspect factor in flood analysis was selected; due to its impact on the amount of precipitation/rainfall and level of sunshine available in the marshland (Chowdhury et al., 2022) . Excluding flat, which varies from −1˚ to 59.1˚, all other classes of this factor exhibited a relationship with flooding, with the strongest found at the north-west (239.4˚ - 299.5˚) and North aspect (299.5˚ - 359.6˚) (Table 1). The contour map also showed that the elevation varied from 1360 m - 1580 m and most of the samplings points were located at 1440 m of elevation. As the elevation increases, the probability of higher runoff coefficient occurrence, which thereafter results the flooding in the lower altitude. These findings now agree with the research conducted by Getahun and Gebre (2015) use elevation and slope as one of the flood generating factors for flood hazard assessment and mapping. The lower the slope value is the flatter the terrain and in the same way the higher the slope value is the steeper the terrain (Figure 4(h)) ( Tang & Pilesjö, 2011) . Steep slopes tend to result in rapid runoff responses to local rainfall excess and consequently higher peak discharges since rain is less likely to infiltrate into the ground. Based on aspect maps, the regions that are most susceptible to flooding are those that are closest to the river stream when flooding occurs (Fernández & Lutz, 2010) . Drainage channels that are overworked and overflow contribute to flooding. Places close to drainage canals have a higher danger of an overflow flood than farther away areas (Ologunorisa & Abawua, 2005) . There is a significant risk of flooding for distances between rivers of 0 - 35 km and 35 - 70 km; in contrast, lengths of 70 - 105 km, 105 - 140 km, and more than 140 km have decreased flooding susceptibility.
Another factor used to assess flood risk is elevation. Because runoff travels from high to low terrain, low-elevation areas are more likely to experience flooding. As a result, flooding is most likely to occur in the western, lowest-elevation portions of the study area (0 - 100 m above sea level) (Figure 4(c)). The eastern regions, on the other hand, are the least prone to flooding and have the highest elevation (1500 - 4400 m above sea level). Another factor used to assess flood risk is elevation. Because runoff travels from high to low terrain, low-elevation areas are more likely to experience flooding. According to research by Sanyal and Lu (2006) , low-lying areas are more susceptible to flooding since even little floods can overwhelm them. As a result, flooding is most likely to occur in the western, lowest-elevation portions of the study area (0 - 100 m above sea level) (Figure 4(c)). The eastern regions, on the other hand, are the least prone to flooding and have the highest elevation (1500 - 4400 m above sea level). Less than 10˚, 10˚ - 20˚, 30˚ - 40˚, and more than 40˚ slopes are classified as having a very high, high, moderate, or low risk of flooding, respectively. The slope is quite low (10˚) since a sizable portion of the basin is located over the floodplain zone. This slope category, which is found in the southwest, is characterized by having the lowest slope and the gentlest topographic elevation. When it comes to the flood-inducing criterion for percentage distribution by slop category, it has a higher priority among the subclasses. These findings agree with the research conducted by Rahman et al. (2021) who agreed found that, low-lying areas are more susceptible to flooding since even little floods can overwhelm them.
The Agricultural activities in the study area covered about 57.36% of the total area (perennial agriculture with 17.11% and seasonal agriculture with 40.25%).
The open areas or grass land, forest and water bodies are the major LULC types of the study area covering more than 40% of the basin area (Figure 4(c)), and representing moderate to low flooding hazards. Figure 5 shows LULC classification of study area in seven classes. Agriculture (Perenial) has 17.11%, agriculture (seasonal) has 40.25%, forest has 1.51%, open area or grass has 30.57%, settlements and building has 0.37%, sparse forest 0.12%, water 9.74, and wetlands of 0.33%. It demonstrates that agriculture is the major class in the research area (seasonal). However, prior research found that vegetated land cover is less susceptible to floods because of the inverse connection between plant density and flooding Bouamrane et al. (2022) and hence was assigned low flood hazard ranking. Therefore, the runoff coefficient and consequently flood susceptibility of the shrub land in the present study are the lowest.
Table 2 and Table 3 indicated soil classification based on soil Texture triangle (USDA Triangle). The soil texture triangle, also known as the USDA soil texture triangle or soil texture triangle diagram, is a graphical representation used to classify and describe the relative proportions of different particle sizes in a soil sample. The soil map of the study area was categorized into seven classes: sand,
![]()
Figure 5. Land use Land cover classification.
![]()
Table 2. Soil Texture based on USDA Triangle.
![]()
Table 3. Soil texture classification based on USDA triangle.
Source: Application of GIS, Remote Sensing (RS) and Digital Elevation Model (DEM).
loamy sand, loam, clay loam, sandy clay, silty clay, and clay (Figure 4(f)) based on the soil texture and based on soil taxonomy we found Regosols, Acrisols, Alisols, Cambisols, Ferralsols, Gleysols, Histosols and water as optional components.
The soil texture triangle diagram visually shows the various combinations of sand, silt, and clay that make up different soil textures. Soil samples are classified into textural classes based on the percentages of these particles. Some common textural classes include loam, sandy loam, clay loam, silt loam, sandy clay, and clay. Findings revealed that more than 50% of the soil types in the study site are silt clay and are clay loam while the percentage of more than 40% are clay, sandy clay, sandy clay loam and sandy loam soils and were allocated low to moderate ranking in flood hazard estimation.
Figure 6 shows the total area and percentage of each soil types of Buhingo marshland. The study area is mostly occupied Ferralsols, which has 3071.8 Ha (68.1%) of the total area. It also shows that less likely soil Doms that occupy the study are Arisols and histosols with 0.3% and 0.7% of the total area. Based on soil taxonomy and soil Dom of the study basin, the Gishari Agricultural Marshland is dominated by Ferralsols: 3071.8 Ha (68.1%), Acrisols: 92.5 ha (2%), histosols: 30.9 ha (0.7%) and water bodies: 281.4 ha (6.2%) of the total area of the district. In this marshland, there are other important soil types like Gleysols: 307.4 ha (6.8%), Combisols: 491.0 ha (10.9%), Alisols: 13.5 ha (0.3%). The last but not the least class is Regosols: 221.9 ha (4.9%). There are also many kinds of sand used for the construction of houses. The major crops grown in the swamp are sugar cane, tomatoes, carrots, onions, eggplants, and rice for local market and home consumption.
![]() Source: Application of GIS, Remote Sensing (RS) and Digital Elevation Model (DEM)
Source: Application of GIS, Remote Sensing (RS) and Digital Elevation Model (DEM)
Figure 6. Soil taxonomy and classification of Buhingo marshland.
3.2. Rice Productivity Loss by Loading Analysis
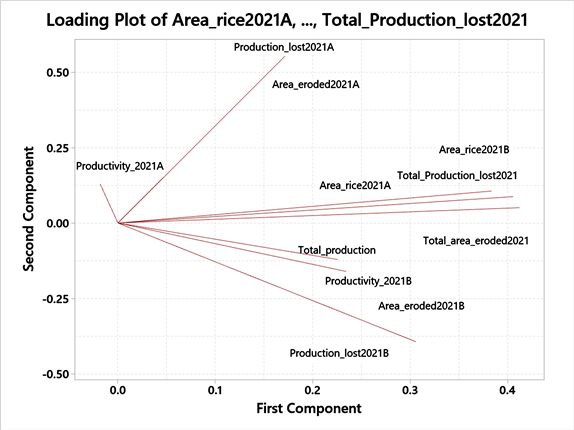
Table 4 and Table 5 present the Eigenvalues Eigenvectors for the total area eroded and rice production loss due to flooding occurrence. To interpret the findings from the provided PCA results, we need to analyze the loadings of the original variables on each principal component (PC). The loadings indicate the correlation between each variable and the principal components. In summary, the PCA results suggest that the variability in rice productivity and related losses can be explained by several factors, including spatial aspects (such as area of production and erosion), temporal aspects (such as differences between years), and specific measures of productivity and production loss. These interpretations can be further supported by examining loading plots, which visualize the relationships between variables and principal components. In a loading plot, variables close to each other are more strongly correlated with each other and contribute similarly to the component they are associated with.
During the interpretation, the study need to focus on the loadings of the variables related to flooding and production loss and these variables related to flooding and production loss in the context of the principal components are summarized as Area eroded 2021A, Area eroded 2021B and Total area eroded in 2021 that are more likely indicators of the extent of erosion caused by flooding. They have high loadings on PC1 and PC6, suggesting that they contribute significantly to the overall variability captured by these components. Higher values
![]()
Table 4. Eigen analysis of the correlation matrix.
on these components would correspond to greater erosion due to flooding. Secondary there are variables like Production lost 2021A, Production lost 2021B, Total Production lost in 2021 that represent the production loss associated with flooding. They have high loadings on PC1, PC6, PC9, and PC11, indicating that they are important factors contributing to the overall variability in rice production loss caused by flooding. Higher values on these components would correspond to greater production loss due to flooding.
Based on the loadings of these variables on the principal components, the represents overall variability in rice production loss, likely capturing the general scale of the impact of flooding on production loss; PC6 indicates spatial variability in the impact of flooding, possibly distinguishing between different areas affected by flooding while PC9 and PC11 capture specific aspects or variations in production loss caused by flooding, which might be related to different years or other factors; and thus variables that are close to each other on the loading plot are more strongly correlated with each other and contribute similarly to the component they are associated with. By examining the loading plots, you can identify which variables have the highest loadings on each principal component, providing insights into their relative importance in explaining the variability in rice production loss caused by flooding.
3.3. Flood Hazards Mapping
The Hazard map obtained highlights five areas as shown in Figure 6. The very low and low classes cover 85% and 223% and 306.5% respectively of Gishari Agricultural Marshlands. The flood hazard maps below show that 430%, 361%, 292%, 223%, and 154% of Gishari Agricultural Marshlands were subjected respectively to very high, high, moderate, low and very low flood hazards. All these areas are within high and very high hazard zones and are dominated by low slope, significant occurrence of rainfall, tertiary sand, ferralitic soil strongly desaturated and low drainage within the Gishari Agricultural Marshlands. Zones with a high risk of flooding typically correspond with areas that have heavy runoff, which is driven by a number of factors. The low and the very low flood hazard zones are primarily situated in the South East (59˚ - 119˚) areas and the very southeastern areas of the basin. The areas labeled as ‘high hazard’ are positively affected by the distance to the river, DEM, slope, and drainage density. The Hazard map obtained highlights five areas as shown in Figure 6. The very low and low classes cover 85% and 223% and 306.5% respectively of Gishari Agricultural Marshland. The flood hazard maps below show that 430%, 361%, 292%, 223%, and 154% of Gishari Agricultural Marshlands were subjected respectively to very high, high, moderate, low and very low flood hazards. All these areas are within high and very high hazard zones and are dominated by low slope, significant occurrence of rainfall and are localized nearby by the Muhazi lakes as the drainage outlet.
Flood hazard mapping plays a crucial role in understanding, mitigating, and managing the impacts of flood events. It provides valuable information to governments, communities, and individuals, helping them make informed decisions and take proactive measures to reduce the risks associated with flooding. The generated map (Figure 7) indicates that the center of the basin is particularly vulnerable to flooding, while the inundation map reveals that the areas most affected by floods are mostly those near river courses (Figure 7). The results are also consistent with Jones’ (2014) research, which indicated that runoff from dry regions’ upper slopes is diverted from the drainage system because it is prevented from reaching river courses by infiltration. This may result in the runoff created at the plot size being cut off from the main channel and only the event runoff produced at regions near the channels flooding the river course (Cerdà et al., 2021) . In summary, flood hazard mapping serves as a foundation for informed decision-making and comprehensive flood risk management strategies. By understanding the potential consequences of flooding, communities and authorities can work together to reduce vulnerabilities, enhance preparedness, and ultimately minimize the impacts of flood events.
4. Conclusion and Recommendation
The objective of the study was GIS-based spatial multi-criteria evaluation framework with the application of AHP method at Gishari Agricultural Marshland. Rainfall, topography, soil, land use, and flooded-area datasets were gathered and incorporated into spatial datasets for the mapping of flood susceptibility. The
![]()
Figure 7. Flood risks map classification of Gishari agricultural marshland.
findings show that regions close to rivers, with low height and slope, and with high drainage density are the most risk-prone since floods are more likely to occur there. The AHP methodology’s results were overlaid with flood inundation models and historical flood data to evaluate its accuracy. Urban regions and agricultural areas are most susceptible to flooding, with 430% and 154% of these areas falling within extremely high and low risk zones, respectively, according to comparisons of land use patterns across index-based hazard zones. Nonetheless, it is advisable to use AHP technique along with fuzzy AHP methods for future planning work for more effective outcomes that could be useful to predict the flood areas. The findings of this paper provide preparatory risk evaluation that can be used by the local disaster management authorities, planners, researchers, and line agencies dealing with flood hazard management including Ministry of Infrastructure, MIDIMAR (Ministry of Disaster Management and Refugee Affairs) and REMA (Rwanda Environmental Management and Authority). Reducing flood risk intensity in agricultural marshlands involves implementing a combination of engineering, ecological, and management strategies to control and mitigate the impacts of flooding. Thus, the following recommendation can boost rice productivity through various like the assessment and planning, construction of natural water storage and retention structures as well as the installation of dikes and Levees strategically to provide flood protection in the identified key agricultural areas. There is also a need to install improved drainage systems like ditches, culverts, and pipes to efficiently move excess water away from agricultural fields.
Authors’ Contribution
Ideation and conceptualization: J.N.N., S.N & P.M; Literature review: J.N.N., P.M, J.M. N, F.S, Y.A, M.M.C.; Data collection and analysis: J.N.N., M.M.C, E.N and P.M; Methodology: J.N.N., J.M. N, P.M., & M.M.C; Writing original draft: J.N.N., P.M. & S.N; Review, editing & proof reading: J.N.N. & F.S.