China’s Coal Power Policies: Stock Market Reactions and Investor Expectations ()
1. Introduction
1.1. Theoretical Background
The transition to a global low-carbon economy will require profound structural changes across the board and will result in a loss of fossil fuel value, which is reflected in investor expectations of firm value and thus in market prices (Vermeulen et al., 2021) . According to calculations by Semieniuk et al. (2022) , the upstream oil and gas sector is responsible for more than $1 trillion in lost profits in the event that climate policy affects investor expectations. Once the losses in the fossil fuel sector are unanticipated by investors, their assets will be prematurely devalued or “stranded” (Caldecott, 2018) , and if the stranding involves too much scope, it can trigger financial instability and crisis (Monasterolo, 2020; Van der Ploeg & Rezai, 2020) . This rapid correction in market prices can lead to a loss of wealth for owners of fossil fuel assets, and further losses can be spread to other entities through closely interconnected financial networks.
The dual carbon target proposed by China in September 2020 to address global climate change (Fan et al., 2022; Dong et al., 2021) means an unprecedented low-carbon transformation of the whole society (Ren et al., 2021) . As a major energy consumer, China’s resource endowment is dominated by coal. In 2021, China’s raw coal output accounted for 50.5% of the world’s raw coal output, coal-fired power generation accounted for 52.1% of the world’s coal-fired power generation, and 62.6% of its total power generation. The low-carbon transformation of the power industry plays an important role in realizing the dual-carbon goal. After the dual carbon goal is put forward, China has put forward many coal power policies to influence the market supply and demand through the power of the policy end, to reduce the carbon emission level of the coal power industry. However, the low-carbon transition will cause high-carbon assets to lose value, regardless of the risk that the depreciation of high-carbon assets due to policy shifts could have costly consequences for the entire economy (Curtin et al., 2019; Caldecott, 2019; Caldecott et al., 2021; Shimbar, 2021; Greenwood & Warren, 2022; IRENA, 2017; Dietz et al., 2016) . The devaluation of financial assets caused by the low-carbon transition will trigger the reaction of investors in the financial market. In China, the transformational dynamics of the power sector can be simply described as policy-driven changes (Semieniuk et al., 2021; Yuan et al., 2012) . So, as a key sector to support China’s dual carbon goals, any policy that causes changes in the coal power sector will have an impact on sectors with high carbon emissions. To realize the dual carbon goal, it is valuable to study the reaction of investors in the Chinese financial market to the coal power policy.
1.2. Current Research Situation
There have been many studies on the market reaction of financial markets to low-carbon transition policies, but their conclusions are inconsistent due to different research samples, research events, and institutional contexts (Alsaifi et al., 2020; Guo et al., 2020; Sen et al., 2020) . In general, three types of research conclusions are derived: one is that the announcement of tighter climate policy does trigger a market reaction from investors, but is associated with negative returns for affected firms (Barnett, 2019; Donadelli et al., 2019; Koch et al., 2016; Griffin et al., 2015) . Pham et al. (2019) analyze the impact of 20 announcements related to the Paris climate agreement on 17 industries using the event study methodology, and the results of the study showed that the announcements has an impact on the polluting industries and caused a negative abnormal rate of return for the polluting industries. The findings of Diaz-Rainey et al. (2021) also show that the signing of the Paris agreement has a significant negative impact on the oil and gas industry. Birindelli & Chiappini (2021) investigate the impact of climate change policies on EU shareholders and find that all industries are affected by at least one policy announcement and that negative impacts are more widespread. Similarly, Li et al. (2020) analyze the impact of environmental regulations on shareholder value and show that high polluting stocks significantly underperform low polluting stocks. Chen et al. (2024) , after examining the impacts of a variety of climate policies on the stock market, find that the abnormal returns of carbon-intensive industries are significantly negative and that this effect diminishes over time.
Other findings suggest positive returns to affected firms from climate policy announcements. Studying the impact of the 2010 U.S. Senate climate effort, Lemoine (2017) finds that stronger environmental policies increase emissions and lead to positive excess returns in the coal futures market. Using the event study method to analyze investors’ market reactions to CCS technology progress and setbacks, Byrd and Cooperman (2018) find that CCS progress is associated with positive abnormal returns of coal enterprises. Trump’s campaign speeches about maintaining existing climate policies have reduced investor concerns about the risks of a low-carbon transition, with coal and other fossil fuel companies having a positive impact (Ilhan et al., 2021) . In addition, other literature shows that low-carbon emission reduction measures do not elicit any reaction from market investors (Mukanjari & Sterner, 2018) . Batten et al. (2016) use the event study method to study most climate policy events from 2011 to 2016 and find that the abnormal returns caused by most events are not significant. Hansen & Pollin (2022) conduct a detailed econometric analysis of the financial loss and stock market price impact of the divestment movement on fossil fuel companies and find that there is no significant economic loss.
A review of the above literature reveals that the market responses triggered by climate change policies are not the same due to differences in study samples, study events and study subjects, and that most of the literature focuses mainly on a specific type of climate policy. Therefore, this paper applies the event study method to analyze the coal power policies that have received less attention, and explores the market reactions triggered by the coal power policies at different stages and analyzes the reasons behind them.
1.3. Thesis Framework
In this paper, based on sorting out China’s coal power policies after the dual carbon target is proposed, we use the event study method to analyze the market reactions of coal power policies at different stages. To increase the credibility of the research findings, we apply four event Windows for the study at the same time. We chose the event study method for two reasons: on the one hand, compared with the traditional ex-post evaluation, the event study method has a short event window, which has the advantage of avoiding the cross-influence of many factors; On the other hand, ESM is considered to be a better method for causal relationship identification, with the advantage of event accuracy and the ability to analyze the impact of events very quickly and in close real-time (Eden et al., 2022) . We find that the market reaction triggered by different coal power policy stages is different. Firstly, the policy of strictly controlling coal power projects triggers a strong and significant negative market reaction from investors. Secondly, policies aims at phasing out outdated coal power units triggered a significant positive market reaction from investors. However, the policy to halt new overseas coal power projects does not trigger any market reaction from investors. Different from Yousaf et al. (2022) using the event study method to examine the influence of a single event of the Russia-Ukraine conflict on the stock market, this paper makes a special study on the coal power policies after the dual carbon target is put forward and draws more abundant research conclusions. In addition, this paper studies the market reaction from the perspective of investor expectations, and the sequential release of coal power policy provides an opportunity for us to better understand investor expectations.
Next, we use beta value to measure investor expectations and construct multiple regression model to explore the impact of green factors on investor expectations. The reason for choosing beta to represent investor expectations is that investors have accumulated a large amount of information on key policies of listed companies through macro policies, annual reports, professional coupon analysis, magazine reports, and personal experience. If the stocks of these companies are candidates in his portfolio, an investor will compare the sales strategies or relative market shares of each company based on his knowledge of these companies and overall macroeconomic policies to determine which companies will benefit the most and which will suffer the most from rapid growth or sharp decline in the overall economy. After the comparison and selection of many domestic sectors and investors, the market as a whole determines the relative volatility or sensitivity of each company. That is to say, the volatility and sensitivity of each enterprise are the results of investors’ expected choices. The coal power policies aimed at promoting the low-carbon transformation of the whole society will inevitably affect investors’ expectations for enterprises with high carbon emissions. Logue & Merville (1972) use beta to measure investor expectations to gain an in-depth understanding of how financial policies affect investor expectations and to provide some evidence on the relative importance of investment and financing decisions.
In the multiple regression analysis, we mainly consider ESG score and carbon emission intensity as green factors that affect investor expectations. Pedersen et al. (2021) point out that the ESG score of each company has two functions, one is to provide information about the fundamentals of the company, and the other is to influence the preferences of investors. Amel-Zadeh & Serafeim (2018) find that 63% of investors surveyed use ESG score data because ESG score contains important financial information and is significant for investment performance. Khan (2022) finds that ESG disclosure is an important manifestation of a company’s sustainability and that ESG disclosure had a positive impact on the company’s financial performance. Stock price declines and bankruptcies caused by disregard for ESG risks demonstrate the importance of ESG metrics. Compared to companies with low ESG performance, companies with high ESG performance face lower litigation risk while having more diversified investors (El Ghoul et al., 2011) . The improvement of the ESG performance of enterprises will bring about a significant reduction in financing costs and an increase in market valuation (Qiu & Yin, 2019) . We apply carbon emission intensity as another indicator of green factors. In et al. (2017) use actual emissions of greenhouse gases from the Trucost database to measure firm-level carbon intensity and find that stocks of carbon-efficient companies outperformed stocks of carbon-intensive companies. And a strategy of buying and selling shares of carbon-efficient companies yields abnormal returns of 7.7% to 8.9% per year. Green stocks have far outperformed brown stocks in recent years as climate change has intensified (Pástor et al., 2022) . Matsumura et al. (2014) document the link between higher emissions and lower corporate value.
In addition, this paper also selects return on assets (ROA), turnover rate (turnover), operating income (income), age (age), and asset-liability ratio (Assetratio) as control variables. The primary objective of investors investing in company stock is to maximize wealth through market stock returns. Anwaar (2016) believes that investors can take financial information as one of the important components to help them choose to invest resources in enterprises. Accounting information in financial reports can provide early warning of a slowdown in the financial condition of a firm, thus helping investors in their investment decisions (Obeidat et al., 2013; Tayeh et al., 2015; AlHarrasi et al., 2016) . Allozi & Obeidat (2016) study the relationship between financial ratios and stock returns and find that there is a significant relationship between profitability indicators and stock returns. Setayesh & Daryaei (2017) show that investors expect stocks with high turnover rates to get high returns, which is consistent with the existing research conclusion that stock portfolios with high turnover rates can get higher returns (Easley et al., 2002; Jun et al., 2003; Dey, 2005) . Matemilola et al. (2017) find that enterprise age has a positive impact on stock returns. With the increase of enterprise age, enterprises will use their own experience to make effective capital structure decisions, thus improving shareholder returns. Therefore, this paper controls some corporate characteristics that may have an impact on investors’ expectations.
We conduct a set of robustness tests on the findings of this paper. Since 17 of the 73 high-carbon emission firms studied in this paper are included in the SSE 180 index, there may be an endogeneity problem in using the SSE 180 index to predict excess returns within the event window. To reduce the bias caused by endogeneity problems, we conduct synthetic control estimation. For the CARs of the 17 companies included in the SSE 180 index, after excluding the 17 companies, we select 60 companies from the remaining 163 companies to construct appropriate counterfactual portfolios for re-estimation. In the comprehensive control estimation, we only match the return on assets of these firms, and the estimation results are in conformity with the benchmark results. In addition, we also use the method of changing the estimation model and estimation sample to verify the empirical results of market reactions, and the results are robust.
The possible marginal contributions are reflected in the following two aspects: First, it enriches the empirical results of investors’ market reactions triggered by coal power policies. On the one hand, this paper focuses on the coal power policy that other scholars have paid less attention to. Past studies in this field mainly document the influence of a specific type of policy, such as carbon pollution reduction policies (Ramiah et al., 2013) . As the climate awareness of investors has been significantly enhanced, it is helpful for us to understand the changes and effects of investors’ expectations by studying the market reactions to coal power policies successively released and implemented after the proposal of the dual carbon target. On the other hand, the issue of climate change has become a prominent global issue. However, as developed countries have a greater responsibility for controlling carbon emissions, most literature focuses on the market response of investors in developed countries to carbon emission reduction measures, while ignoring developing countries. Especially, China, being the world’s largest carbon dioxide emitter and developing country (Zheng et al., 2021) , plays a crucial part in shaping worldwide electricity configuration and mitigating climate change (Zhang et al., 2020; Zhao et al., 2022) .
Second, the existing research is mainly from the perspective of enterprises, while ignoring the role of investors. We try to explain the market reaction triggered by the coal power policy from the perspective of investor expectations. The existing literature shows that only when investors pay attention to new information will the stock market react to it (Huberman & Regev, 2001) . At the same time, since investor expectation is an indicator of comparative difficulty, most of the literature uses CAARs estimated by the model to directly represent it. Beta value is a choice made by investors after comprehensive consideration of various factors. Therefore, this article selects a beta value that better reflects investors’ expectations for measurement. Understanding the reasons for market reactions from the perspective of investors can provide valuable lessons for future policy formulation and implementation.
The rest of this paper is organized as follows: Section 2 mainly introduces the development of China’s coal power policies after the dual carbon target is put forward. Section 3 mainly describes the empirical methodology adopted in this paper. In Section 4, we introduce the companies with high carbon emissions affected by the policy and explain the data and data sources. Section 5 presents the main empirical results and robustness checks. And the conclusions and discussion are presented in Section 6.
2. China’s Coal Power Policies
Being the world’s largest coal producer and consumer (Shi et al., 2022) , China’s coal-based energy construction supports the rapid development of China’s economy but also causes serious damage to the ecosystem (Jeuland et al., 2021; Cui et al., 2019; Lin & Du, 2017) . After the dual carbon target is put forward, China is deploying and promoting carbon emission reduction with the greatest determination. As a key area to serve the carbon emission reduction of the whole society and support the low-carbon transformation of the economic society, the power industry is undergoing extensive and profound changes. To realize the low-carbon transformation of the power industry, the coal power policy will inevitably affect the industry of the whole society. Therefore, we sort out the coal power policies proposed and implemented since the dual carbon goal is proposed and find that they present three stages characteristics.
The policy is first made public in April 2021, and we examine the market response of investors to enterprises with high carbon emissions triggered by China’s coal power policies. The evolution of coal power policies offers an appropriate opportunity to survey investor expectations. In our analysis, the three stages of policy development have different characteristics and represent different policy events. In the first phase of the coal power policy, it is proposed to strictly control coal power projects. It is the first signal that China would limit coal-fired power. As a complement to the first phase, the next two policy phases aim to achieve the dual carbon goal of controlling carbon emissions. In the rest of this section, we concentrate on the evolution of coal power policies.
Stage 1: Strict control over coal power projects
On April 22, 2021, the Leaders’ Climate Summit, initiated and supported by US President Biden, holdvia video. The summit invites leaders from 40 countries and international organizations, including leaders from 38 countries and the presidents of the European Commission and the European Council. Leaders Climate Summit Focuses on Climate Change Challenges, Solutions to Climate Change, Financial Assistance, Innovation, and Other Issues. Considering the responsibility of a great nation to build a community with a shared future for mankind and the urgency of mitigating global climate change, China has committed to strictly controlling coal power projects. The specific plan is to strictly control the growth of coal consumption during the “14th Five-Year Plan” period and gradually reduce coal consumption during the “15th Five-Year Plan” period. This is the first time that China has proposed to strictly control coal power projects since the dual carbon target is put forward, releasing a signal of carbon tightening, which will have an important impact on industries with high carbon emissions.
Stage 2: Eliminate and shut down coal-fired power units below 300,000 kilowatts that do not meet the standard
On September 2, 2021, the National Energy Administration proposes that it will seriously study the classification and disposal of coal-fired generating units or cogeneration units with a single unit capacity of 300,000 kilowatts and below. At the same time, it will continue to urge local governments to implement relevant work requirements such as eliminating and shutting down coal-fired power units below 300,000 kilowatts that do not meet the standards. The coal power policy at this stage aims to eliminate backward coal power units.
Stage 3: Completely stop new overseas coal power projects
On March 28, 2022, the four departments, involving the National Development and Reform Commission, the Ministry of Ecology and Environment, the Ministry of Foreign Affairs, and the Ministry of Commerce, jointly issue the “Opinions on Promoting the Green Development of the Belt and Road Initiative”, proposing to completely stop new overseas coal power projects and proceed with caution Overseas coal power projects under construction. “The opinions” will encourage overseas enterprises to strengthen the use of clean and efficient coal, the application of advanced technologies such as efficient desulfurization, denitrification, dust removal, carbon dioxide capture and storage, and the active upgrading of energy conservation and environmental protection facilities. This will greatly promote the green and low-carbon development of overseas coal power projects.
To summarize, China’s coal power policies have gone through three stages of evolution since the dual-carbon target is proposed. The first stage is the strict control of coal power projects, which is the first time the Chinese government releases a signal to limit coal-fired power generation. The second phase is to eliminate and shut down substandard coal-fired generating units below 300,000 kilowatts. The second phase is the first step taken by the Chinese government to limit coal-fired power generation. The third phase, a complete halt to new coal-fired power projects outside China, is a further step taken by the Chinese government to limit coal-fired power generation and ensure that dual-carbon targets are met.
The event study method is a very common method used to analyze the impact of regulatory and policy changes. In event research, it is very crucial to determine the dates of events when policies may change investor expectations. Therefore, we widely examine several official webpages to determine the date on which the related coal power policies might have been publicized in the media. We also exclude cases where there are other significant policy announcements around the coal power policy announcement date. Table 1 shows the three stages of coal power policy development and their release dates.
3. Empirical Methods
To explore whether the coal power policy has triggered the market reaction of investors of companies with high carbon emissions, we adopt the short-term event study method to study whether high carbon emissions companies have abnormal returns caused by the policy. Based on the hypothesis that the market is efficient, all valuable information is fully reflected in the stock price, and it is impossible to obtain excess profits just by analyzing the stock price in the past.
To analyze the effect of coal power policies, we employ an event study method with dummy variables added. Therefore, the following specification is applied to evaluate the effect of an individual event on date on the return of a specific asset i:
, (1)
![]()
Table 1. China’s coal power policies after the dual carbon goal is proposed.
Note: The release dates of the different policy phases are in parentheses.
in this model,
represents the continuously compounded rate of return of asset i on the trading day . The normalreturns of the asset are predicted by the vector of covariates
. And is used to measure the radius of the event window.
represents the risk-free rate of return per day. From the description of the equation, we can know that some important variables in the equation, including coefficients
and errors, are specific to certain assets. The event day dummies,
, are applied to measure the possible influences of the event on the returns, where
. Also,
measures the distance to the event date T. The significance test for the coefficients of the dummy variables is the standard regression coefficient t-test.
In order to get more accurate prediction results, our parameter
is not only specific to the company but also specific to each coal power policy announcement, that is to say, for each coal power policy announcement, we use different sample data to estimate the parameters
separately.
Therefore, we employ the following equation to estimate the cumulative average abnormal returns (CAARs):
, (2)
in this equation, j is the announcement index.
In the following robustness test, we change the estimation method of CAARs in the event study method, as shown in the following equation, and use the market model for estimation. The meaning represented by the variables is the same as in Equations (1) and (2).
, (3)
In addition, we use the following model to explore the influencing factors of investor expectations. This paper uses betas estimated by the capital asset pricing model (CAPM) on daily data to represent investor expectations. The beta value is used as the explained variable, and the carbon emission intensity is used as the core explanatory variable. In order to increase the reliability of the conclusions, we use the ESG score to replace the carbon intensity in the regression. The reason for this is that how investors judge whether an enterprise will be affected by the coal power policy is mainly based on the carbon emission intensity (cstrength) and ESGscore (ESG) of the enterprise, that is, the effect of coal power policy on the enterprise is mainly reflected in the carbon emission intensity and ESG score. Since the return on assets (ROA), turnover rate (turnover), operating income (income), age (age), and asset-liability ratio (Assetratio) will all affect investors’ expectations of enterprises, they are selected as control variables.
(4)
In the above equation, β represents investor expectation, ESG represents ESG score, represents carbon emission intensity (cstrength), and controls represent control variables, including age (age), return on assets (ROA), turnover rate (turnover), operating income (income), and asset-liability ratio (Assetratio).
4. Data and Descriptive Statistics
In estimating the market response, we collect data on daily stock returns for 180 firms over the period from August 28, 2020 to April 13, 2022, with the SSE 180 as the market return and the 10-year bond yield as the risk-free rate of return, from the CSMAR database. Coalpower policy related announcements are from the Chinese government website. SSE 180 Index includes 73 high carbon emission enterprises studied in this paper. Based on the scientific and objective sample selection method, the most representative 180 sample stocks are selected, accounting for 50% of the outstanding market capitalization of SSE. It aims to establish a benchmark index that can reflect the overall operation of the Shanghai stock market and can be used as a basis for financial derivatives and investment evaluation scales.
Due to the availability of carbon emission data, 73 enterprises with carbon emission data are selected as research objects. The industry to which the enterprise belongs is shown in Table 2. There are 22 enterprises in the electric power industry, 20 enterprises in the steel industry, 9 enterprises in the cement industry, 6 enterprises in the coal industry, 4 enterprises in the aviation industry, 4 enterprises in the construction industry, 3 enterprises in the petrochemical industry, 2 enterprises in the non-ferrous finance industry, 1 enterprise in the shipping industry, 1 enterprise in the communication industry and 1 enterprise in other building materials industry. These enterprises are characterized by high carbon emission intensity, and all of them are in the top 100 of the 2021 carbon emission intensity list. The industry and carbon emission intensity ranking data
![]()
Table 2. Industry and number of 73 high carbon emission enterprises.
of enterprises are from China Ecological Network (https://www.eco.gov.cn). Table 2 is manually collected according to the data of China Ecological Network.
As the basic assumption of classical regression analysis, whether the data is stationary is the key problem to be solved in time series regression analysis. The non-stationarity of time series data breaks the “consistency” requirement of statistical inference for large samples, and the prediction based on non-stationarity time series is also invalid. In econometrics, the most common method for testing data stationarity is the unit root test. In order to avoid “pseudo-regression”, this paper uses the ADF test to test the stationarity of the SSE 180 index and 73 enterprises with high carbon emissions before regression estimation. The data on SSE 180 index and corporate returns span from August 28, 2020, to April 13, 2022.The results of the ADF test and statistical description are shown in Appendix Table A1, and all variables are stable.
In the multiple regressions to explore the influencing factors of investors’ expectations, ESG score, and control variables (age, ROA, turnover, bincome, and Assetratio) are from the Wind Financial Terminal database and the core explanatory variable carbon emission intensity (cstrength) is from the website of Ecology China (https://www.eco.gov.cn). Toincrease the reliability of the regression results, the data from 2020 are selected for these variables. The beta data used to measure investor expectations are estimated by Statasoftware using daily stock data and capital asset pricing model. The estimation period is from the first stage to the last stage of the coal power policy, that is, from April 22, 2021, to March 28, 2022. Table 3 shows the descriptive statistics of the variables that explore the influencing factors of investors’ expectations after Z-Score normalization. The data in Table 3 are obtained by running Stata software.
![]()
Table 3. Descriptive statistics of multiple regressors.
5. Results and Robustness Test
In this section, we first present the results of the market reaction caused by the coal power policy, and then present the multiple regression results of the exploration of the influencing factors of investor expectations. At the same time, in order to make the regression results more credible, we also conduct some robustness tests.
5.1. Market Reaction of Coal Power Policy at Different Stages
Using four event Windows of three, five, seven, and nine days, the event study method is used to analyze the overall stock market response of coal power policy to firms with high carbon emissions. CAARs are used to measure the stock market reaction triggered by the coal power policies, and the results are shown in Table 4. In order to increase the credibility of the empirical results, this paper uses four event Windows to verify the market reactions of investors, and based on using the t-test, a non-parametric test Wilcoxon signed-ranks testis also added.
The empirical results show that the market reaction triggered by the announcement of the policy of strictly controlling coal power is significantly negative in all four event Windows. And the CAARs of the four event Windows show significance at least at the 5% level on the t-test and the Wilcoxon signed-ranks test. Obviously, the strict control of the coal power policy has exceeded investors’ expectations. According to the “primacy effect” that exists when people receive information, the first release of the coal power policy sends a negative signal to the coal power market, triggering a negative reaction from investors. From the proposal of the dual carbon goals on September 23, 2020, to the issuance of the “Carbon Emission Trading Management Measures (Trial)” by the Ministry of Ecology and Environment on January 10, 2021, plus a series of supporting policies and measures to reduce carbon emissions, no one does not reflect China’s determination to reduce carbon emissions and releases a signal of low-carbon transition risks. However, because a large amount of power supply in China mainly relies on coal power generation, and there are various shortcomings in the power
![]()
Table 4. CAARs for 73 high carbon emission enterprises in the three stages of coal power policy.
Notes: Select 3, 5, 7 and 9 days centered on the event date as the event window. The 140 days before the event window is taken as the estimation window excluding the event window observations. t corresponds to the T value of the t test for parametric tests and the t value of the Wilcoxon signed-ranks test for nonparametric tests, respectively. *p < 0.10, **p < 0.05, ***p < 0.01 indicates different statistical significance levels.
generation technology of other energy sources that can replace coal power generation in a short period, investors believe that the loss of asset stranding in a short period of time will be small. Therefore, when the Chinese government first explicitly proposes strict restrictions on coal power generation projects, it surprises investors and causes a strong negative reaction from investors.
As for the second stage, the coal power policy triggers significant positive investor reactions within the four event Windows. And the CAARs of the four event Windows show significance at the 1% level on both the t-test and the Wilcoxon signed-ranks test. The reason for the significantly positive reaction of investors is that, on the one hand, the capital market has received the signal of the coal power policy, and the information at this time has been absorbed by the market and forms stable expectations. On the other hand, investors believe that the coal power policy at this stage is mainly to phase out backward coal power units, in line with China’s low-carbon development theme.
For China’s announcement of a complete halt to new overseas coal power projects, the market reaction of investors is negative in most of the event Windows, but only the 7-day event window shows 5% significance on the Wilcoxon signed-ranks test, and the rest of event Windows are insignificant on the t-test and the Wilcoxon signed-ranks test. The coal power policy is mainly aimed at enterprises with overseas coal power projects. However, among the 73 high-carbon enterprises studied in this paper, the proportion of overseas coal power projects is very small, so the coal power policy at this stage has not triggered significant market reactions from investors.
5.2. Impact of Low Carbon Factors on Investors’ Expectations
Due to the serious consequences of multicollinearity, it is often necessary to first diagnose the multicollinearity of variables when considering multiple regression analysis. In general, when the variance inflation factor of the independent variable is greater than or equal to 10, it can be determined that there is serious multicollinearity between the variable and the other variables. The variance inflation factors of the selected variables are shown in Table 5, and the VIF of all variables is less than 10, so there is no multicollinearity.
According to the description above, this paper uses the beta calculated by the capital asset pricing model to measure investor expectations. Firstly, the beta value of each enterprise is calculated by using the stock return data of 73 high-carbon enterprises and the SSE 180 market return data from April 22, 2021, to March 28, 2022. Secondly, on the premise of passing the multicollinearity test, the multiple linear regression model is used to investigate the influencing factors of investors’ expectations during the implementation of the coal power policy. Whether coal power policy will affect investors’ expectations of an enterprise is mainly reflected in the carbon emission intensity and ESG score of the enterprise. Therefore, carbon emission intensity (cstrength) or ESG score (ESG) is selected as core explanatory variables, and turnover rate (turnover), return on assets (ROA), operating income (bincome), asset-liability ratio (Assetratio), and age (age) are selected as control variables.
After controlling the influence of other factors, we first use carbon emission intensity as the core explanatory variable and beta value as the explained variable for regression, the regression results are shown in Table 6. The results show that the correlation value between β and carbon emission intensity is −0.4236 and shows significance at the level of 1%, indicating that there is a significant negative correlation between β and carbon emission intensity. That is to say, during the implementation of the coal power policy, the higher the carbon emission intensity of the enterprise is, the lower the expectation of investors for the enterprise is. Therefore, when the signal of strictly controlling coal power projects is released for the first time, it exceeds investors’ expectations, thus triggering a significantly negative reaction of investors to enterprises with high carbon emissions.
To increase the reliability of the empirical results, we use the ESG score to replace carbon emission intensity as the core explanatory variable and conduct regression with the explained variable investor expectations. Of course, before the regression, the variables are also tested for multicollinearity, the results of which are shown in Table A2 in the Appendix, and there is no multicollinearity problem. The regression results are shown in Table 7. The correlation value between
![]()
Table 6. Regression results of factors influencing investor expectations.
Note: *p < 0.10, **p < 0.05, ***p < 0.01 indicates different statistical significance levels, and the t-values are in parentheses.
![]()
Table 7. Regression results of factors influencing investor expectations.
Note: *p < 0.10, **p < 0.05, ***p < 0.01 indicates different statistical significance levels, and the t-values are in parentheses.
ESG score and investor expectation is 0.3214 and shows significance at the level of 5%, indicating that there is a significant positive correlation between ESG score and investor expectation. ESG score and carbon emission intensity, as the regression results of core explanatory variables and investor expectations, respectively, complement each other and verify that the issuance and implementation of coal power policy have changed investor expectations.
5.3. Robustness Test
In order to ensure the reliability of the estimation results, this paper adopts four event Windows in both the benchmark regression and the robustness test. In addition, this paper also tries to conduct a robustness test from the following three aspects: 1) Synthetic control method; 2) changing the estimation model; 3) Changing the estimation sample.
5.3.1. Synthetic Control Method
Among the enterprises studied in this paper, 17 enterprises are included in the SSE 180 index. In order to eliminate the endogeneity problem caused by the inclusion of the research objects in the SSE 180 index, this paper uses the synthetic control method to re-estimate the 17 enterprises with high carbon emissions. Since the market reaction of investors triggered by the coal power policy in the third stage is not significant, the synthetic control regression is only conducted on the first two coal power policies that pass the significance test.
We use the synthetic control method to select assets to form an appropriate counterfactual portfolio and estimate its weights. Assume that
is the company affected by coal power policies. The essence of the synthetic control is to form a weighted average over the units in the donor pool of I units that are not affected by the coal power policy. The weights
of each particular synthetic control need to satisfy
. The selection and determination of the weights are based on the pre-event characteristics
. In particular, the outcome variable can also be included as a potential feature. That is, we have
. Indeed, Toalleviate the considering interrelated to unobserved factors in ,the values of outcome variables before event can be taken into account in the matching process (Abadie et al., 2010) . We determine the weights according to the following criteria:
, (3)
in Equation (3) above, v is the variable weight vector. Then, the synthetic control estimation of abnormal returns is given by:
(4)
We calculate the cumulative abnormal returns as the sum of abnormal returns. In order to eliminate the endogeneity problem caused by the inclusion of sample companies in the SSE 180 index, the sample companies in this paper are excluded when estimating the synthetic portfolio, and 60 companies from the remaining companies in the SSE 180 are selected to form a suitable counterfactual. We form a counterfactual portfolio of investors based solely on the asset returns of these firms.
We only present the results of the 5-day event window synthetic control estimation for two firms, GD Power Development Co., Ltd. and Huaneng Power International, Inc. In the results presented in Figure 1, the grey line represents
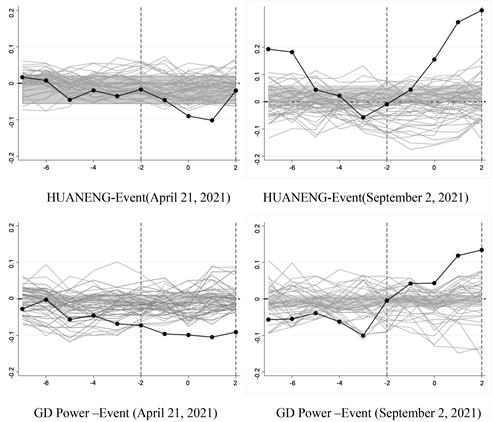
Notes: This figure shows the synthetic control estimations of the CARs of HUANENG and GD Power in the corresponding stages of the coal power policy. The event window (−2, −1, 0, +1, +2) is a five-day rolling window with the dotted line as the event day. The days before the event window are the placebo days, and the 140 days before the placebo window is taken as the estimation window excluding the event window and pseudo window observations. Grey lines indicate in-place placebo tests and shaded areas represent 95% confidence interval.
Figure 1. Robustness check: synthetic control estimations.
the estimated impact of the events in the control group, and the broken line represents the estimated impact of the events for the two coal-fired power companies we studied. The shaded area represents the 95% confidence interval. It can be seen that the CARs of the two coal-fired power companies during the event window are much higher than those of the control group, which is consistent with our basic estimation results. The estimation bias caused by this endogeneity problem is so small that it can be ignored for all policy events.
5.3.2. Change the Estimation Model
In the benchmark regression, both CAARs, which measure stock market reactions, and betas, which represent investor expectations, are estimated using the capital Asset pricing model. Therefore, in order to increase the reliability of the estimation results, this paper uses the classical market model to calculate CAARs, and the results are shown in Table 8. Comparing the new estimates with the results in Table 4, it can be seen that the results have not changed significantly.
![]()
Table 8. Robustness check: CAARs for 73 high carbon emission enterprises using market model.
Notes: Select 3, 5, 7 and 9 days centered on the event date as the event window. The 140 days before the event window is taken as the estimation window excluding the event window observations. t corresponds to the T value of the t test for parametric tests and the t value of the Wilcoxon signed-ranks test for nonparametric tests, respectively. *p < 0.10, **p < 0.05, ***p < 0.01 indicates different statistical significance levels.
5.3.3. Change the Estimation Sample
In the benchmark regression and the robustness test of changing the estimated model, the estimation sample used to estimate CAARs is 140 days before the event window. In order to increase the credibility of the empirical results, the estimation sample is changed to 100 days before the event window, and the results are shown in Table 9. Comparing the new estimates with the results in Table 4 and Table 8, it can be seen that the results have not changed significantly.
6. Conclusion and Discussions
This paper mainly applies the event study method to analyze the market reaction of investors to enterprises with high carbon emissions triggered by coal power policies and analyzes the reasons behind it. We find that different stages of the coal policy trigger different market reactions: 1) in the first stage, the release of the signal to strictly control coal-fired power generation triggers a significant negative reaction from investors. According to the “first cause effect” of receiving information, it is obvious that the coal power policy at this stage exceeds investors’ expectations, thus triggering negative reactions from investors; 2) in the second phase, the policy of phasing out outdated coal power units triggers a significantly positive investment response. The reason for the significantly positive investor response in this phase is that the information released by the coal power policy in the first phase has been absorbed by the market and has formed stable
![]()
Table 9. Robustness check: CAARs for 73 high carbon emission enterprises with changed estimation samples.
Notes: Select 3, 5, 7 and 9 days centered on the event date as the event window. The 100 days before the event window is taken as the estimation window excluding the event window observations. t corresponds to the T value of the t test for parametric tests and the t value of the Wilcoxon signed-ranks test for nonparametric tests, respectively. *p < 0.10, **p < 0.05, ***p < 0.01 indicates different statistical significance levels.
expectations. In addition, investors believe that the coal power policy at this stage is mainly to phase out outdated coal power units, which is in line with the theme of low-carbon development in China; 3) in the third stage, the policy of completely stopping the construction of new overseas coal power projects does not trigger any reaction from investors. The coal power policy in this stage mainly targets enterprises with overseas coal power projects, and the proportion of overseas coal power projects among the research enterprises in this paper is very small, thus not triggering any significant market reaction from investors. The results of the above study are still credible after the robustness tests of the synthetic control method, changing the estimation model, and changing the estimation sample. On this basis, we further conduct a multivariate regression using the beta measure of investor expectations, and the results show that carbon emission intensity and ESG scores have a significant effect on investor expectations. The significant negative correlation between carbon emission intensity and investor expectations, and the significant positive correlation between ESG score and investor expectations complement each other, indicating that coal power policy affects investor expectations.
From the empirical results, in the context of the low-carbon transition, investors are generally optimistic about low-carbon assets. But at least for some stocks of high-carbon-emitting companies, investors do not seem to have incorporated the risk of low-carbon transition into their stock prices, because the introduction of strict coal power control policies triggers a significant negative reaction from investors at the beginning. Similarly, policies to deal with outdated coal power units have elicited a significant positive response from investors. Policies to deal with overseas coal power projects draw no reaction from investors. Perhaps investors at this stage of the policy have already factored in the low-carbon transition risk.
Our results have two guiding significance. First, understanding the interaction between policy formulation and investor expectations is necessary for policy design. Therefore, considering the devastating and immeasurable consequences of a sudden change or a sudden tightening of carbon emission control policies for financial markets and investors, on one hand, policymakers need to comprehensively consider various factors in order to formulate a relatively reasonable policy. On the other hand, policymakers should send clear and early signals to financial markets before policy implementation. Second, whether individual investors or institutional investors, the risks of low-carbon transition should be taken into account, and corresponding measures should be taken when observing the low-carbon transition signal released by the policy. We believe that further research in a similar context could help generalize these results or identify important factors that shape climate-related risk expectations.
Appendix
![]()
Table A1. Descriptive statistics of the rate of return of the SSE 180 Index and 73 enterprises.