Modeling Study of the Evolution of the Climate Crisis over Time ()
1. Introduction
The topic of climate change is not new, but it is broad and complex in its interior for study, therefore, what has happened in millions of years in the past, with regard to changes related to climate, they would have been noticed in a constant way, based on the normality of the beginning of life, everything has a beginning, development and growth, and an end, until closing the cycle and starting again.
In the midst of this cycle, transformations have been highlighted over time on our planet, naturally, but also anthropogenicly. The harmonization and coexistence of man with the native environment that the earth offered in those times, promoted our ancestors to take advantage of natural resources in a rational way.
With the passage of time, man's need to stand out with new technological inventions, the excessive use of natural resources, oceanic and atmospheric pollution, were the main anthropogenic activities to unleash the fury of nature in an accelerated manner, materializing in what yesterday was called climate change, and today, is called climate crisis.
For more than 70 years, we see that climate change has gone from being noticed constantly to being noticed at an accelerated rate, and the effects are more noticeable in our environment, highlighting the greenhouse effect caused by high pollution from gas emissions, causing the warming in the atmosphere and oceans.
The issue of climate change or climate crisis is an argument that evolves over time. Interest in the study of the climate crisis is growing more every day, because new natural phenomena are appearing and with greater intensity, which impacts human life.
To understand the wide world of the climate crisis, it is important to take a retrospective to see the behavior of the different natural phenomena, and project the results obtained with mathematical and statistical models, and in this way generate harmonious scenarios with the natural environment, and propose mitigating responses to be able to live with the precious mother earth.
Thus, the idea of the thesis proposal was born, referring to the modeling of the evolution of the climate crisis over time.
The research proposal has the following scope. In relation to the general objective, the aim is to model the evolution of the climate crisis over time taking as variables global warming, greenhouse gases, atmospheric temperature and ocean temperature, as well as the continuity of the natural phenomena in terms of their measurement, temporality and projection. To achieve the above, the description of the following specific objectives is proposed: Identify the variables corresponding to the climate crisis, their relationship and correlation between them; Develop projection models with mathematical and statistical arrangements to project them in a given time and, in this way, propose mitigation measures for different unfavorable scenarios.
2. Methodolgical Design
The topic to be developed is Climate Action, which corresponds to Sustainable Development Goal number 13, in which the aim is to study a modeling of the evolution of the Climate Crisis over time”, so questions arise such as: Will they be correct? The variables identified for the analysis of the incidence in the manifestation of accelerated climate change? Is the projection of scenarios using models with mathematical and statistical arrangements sufficient to define a methodology to mitigate the effects of climate change? And will the variables be sufficient? Do proposed mitigation measures mitigate unfavorable scenarios caused by climate change?
This thesis work will be designed under the quantitative approach, since this is the one that best adapts to the characteristics and needs of the research.
Now, from the quantitative approach, the collection of databases and the analysis of the data will be used to answer the research question, the same approach that relies on “numerical measurement, counting and frequently the use of statistics and mathematical models to accurately establish behavioral patterns in a sample” [1] .
From the quantitative approach, the technique of collecting existing data (continuous statistics), content analysis of documents and texts will be taken to describe the perception of the evolution of the climate crisis over time, as well as measuring natural phenomena and correlating them with arrangements of mathematical models.
The present work is very pertinent, because the databases of the different variables will be studied through the memory of models of the evolution of the Climate Crisis taken with a baseline of the results of the past to project into the future.
The developed model will allow us to identify the different findings found with the manipulation of the different study variables.
And, through the application of mathematics and statistics, you will be contributing to science by proposing climate scenarios both in the past and in the future.
Primary Sources
National Oceanic and Atmospheric Administration (NOAA) website. https://www.noaa.gov/
World Air Quality Index website (WQI). https://waqi.info/es/#/c/10.053/2.836/3.2z
Website of the Program of The European Union COPERNICUS. https://www.copernicus.eu/es
Nicaraguan Institute of Territorial Studies, Nicaragua (INETER). Meteorology Directorate.
Secondary Sources
The research is based on the following bibliography as secondary sources: del Olmo, W. (2022). Ideas para combatir el cambio climático. Revista de la Sociedad Geológica de España, 20-27; Díaz Cordero, G. (2012). El Cambio Climático. Ciencia y Sociedad, 227-240; Jodar Abellan, A., Ruiz, M., & Melgarejo, J. (2018). Evaluación del impacto del cambio climático sobre una cuenca hidrológica en régimen natural (SE, España) usando un modelo SWAT. Revista Mexicana de Ciencias Geológicas, 240-253.
López de la Cruz, J. & Francés, F. (2014). La variabilidad climática de baja frecuencia en a modelación no estacionaria de los regímenes de las crecidas en las regiones hidrológicas Sinaloa y Presidio San Pedro. Tecnología y Ciencias del agua, 79-101; Osés Rodríguez, R., Fimia Duarte, R., Iannacone, J., Saura González, G., Gómez Camacho, L. & Ruiz Cabrera, N. (2016). Modelación de la temperatura efectiva equivalente para la estación del Yabú y para la desnsidad larval total de mosquitos en Caibarién, provincia Villa Clara, Cuba. Revista Peruana de Entomología, 1-7; Sanabria, J., Marengo, J. & Valverde, M. (2009). Escenarios de Cambio Climático con modelos reionales sobre el Altiplano Peruano (Departamento de Puno). Revista Peruana Geo-Atmosférica RPGA, 134-149; Sanchez Vega, M. (2008). La capa de ozono. Revista Biocenosis, 65-68; Toro Valencia, V., Mosquera, W., Barrientos, N. & Bedoya, Y. (2019). Circulación oceánica del golfo de Urabá usando campos de vientos de alta resolución temporal. Boletín científio CIOH, 41-56; Yañez-Arancibia, A., Twilley, R. & Lara-Domínguez, A. L. (1998). Los ecosistemas de manglar frente al cambio clímatico global. Madera y Bosques, 3-19.
Data Collection Methods
Quantitative observation is the method par excellence for collecting data for this work. It aims to observe systematically using the technique such as counting the number of data for each variable studied, in a given time.
The other method that will be used is the review of documents, in which the effectiveness of data collection is very accurate, it is a supplementary method to strengthen and support the research work.
Data Analysis and Verification Method
The method to analyze the data refers to mathematical and statistical modeling techniques, manipulating the variables and determining their correlation, projection, and their impact on the frequency, magnitude and repetition of natural phenomena. They are analyzed using comparative graphs of linear, logarithmic and/or exponential trends, depending on the trend that best fits. All graphs will be built in Microsoft Excel, and based on the results, the possible projected scenarios will be analyzed, generating climate crisis matrices. The expected result of data analysis will subsequently be compared with other climate modeling methods to verify their effectiveness.
3. Theoretical Framework
There are various climate models that determine the occurrence and its effects in real time. Within the climate models, variables such as: precipitation stand out, according to [2] , the first approach in modeling the flood regimes under non- seasonal conditions, describes that it consisted of the implementation of models in which time was incorporated as the only explanatory covariate, taking into account the distribution of precipitation according to temporal trend models adjusted to 38 years as time series of floods of the study sites, through which an attempt was made to describe the interannual variability present in the flood regimes over time.
The author [3] , in his conclusions, reports that there is a collateral effect between the population density of mosquitoes in Caibarién and the increase in effective temperature. The effect of the proliferation of the mosquito, its population density is accelerated due to the increase in temperature, in the future this type of mosquito will cause specific epidemics, an effect generated by the change in temperature, a factor that is directly linked and in correspondence with climate change.
The speed of the winds is another factor that influences the humidity and quality of an area of the planet, and more so in the oceans, in this sense according to [4] , the physical processes that has the greatest influence on the ocean dynamics inside the Gulf of Urabá, are the variability of the wind fields, the differences in density and the river discharges. Also [4] states that the influence of the dynamics of the wind fields on the ocean circulation is affected by the latitudinal variation of the intertropical convergence zone that generates two climatic epochs, dry season (December to March) and rainy season (May to November). That is, the analysis that was carried out was a time-resolved modeling of how wind fields influence the ocean circulation that confines fresh waters in the south of the Gulf of Urabá.
Now, in the parameters found that is directly in contact with the hydrometeorological factors, it is the stratospheric Ozone layer (O3), according to [5] , indicating that it is a gas that forms a layer that protects us from ultraviolet radiation type B (UV-B), harmful to life on the planet. The ozone layer is located in the stratosphere. The amount of ozone is decreased due to its reaction with pollution of anthropogenic origin. Among the most harmful pollutants for the ozone layer are: chlorofluorocarbons (CFCs), methane gas (CH4), nitrous oxide, chlorine monoxide (ClO), carbon monoxide, among others. [5] states that the destruction of the ozone layer causes ultraviolet rays to reach the surface of the biosphere and can interfere with the photosynthetic capacity and growth of plants. Another consequence is the increased risk of skin cancer in humans and animals.
Regarding climate change, [6] develops a model with SWAT applied to a hydrological basin in SE, Spain. Precipitation and temperature data come from the global climate models (GCMs) bcc-csm-1-m, MPI.ESM.MR and bcc; csm 1.1, are regionalized with analogue techniques, under the RCP4.5 and RCP8.5 emission scenarios (period 2010-2050). The fitting results improve with Nash Sutcliffe Efficiency (NSE), with respect to Kling-Gupta Efficiency (KGE), in the calibration and validation series. Personally, regarding the analysis of the data, it is necessary to introduce, for example, the atmospheric index, a variable that influences the variation of the other factors, leaving open the possibility of continuing to address this issue by proposing another climate model.
Currently, worldwide, there is monitoring of climate behavior with real-time software, with viewers from international agencies, which can predict a phenomenon once it is formed, however, the predictions are not made, since they do not calculate its magnitude and its repetition in the short, medium and long time.
Other agencies that carry out surveillance modeling through viewers are: the National Oceanic and Atmospheric Administration (NOAA), the Spanish National Atmospheric Environment Surveillance Agency (AEMET), the European Space Agency COPERNICUS, among others. According to [5] , in his research he reports that during the calibration and validation of SWAT applied to the upper basin of the Taibilla River, an NSE efficiency was chosen as an objective function, since according to the research it is the one that best adapts and contributes, with respect to KGE efficiency, this is manifested.
4. Results
Reports state that since industrialization began, the presence of carbon dioxide in the atmosphere has skyrocketed, concluding that the main source of fuel combustion is the main reason for the increase in CO2 in recent decades, contributing to the production of CO2 fossil fuels such as coal; the combustion of liquid fuels such as gasoline, petroleum, diesel and kerosene; and the combustion of fuels from gases such as natural gas.
Also, it is worth mentioning that excess CO2 emissions cause the percentage of CO2 to skyrocket, which causes air pollution, and the so-called global warming and ocean acidification. For the analysis of this variable, use is made of the information provided by https://datosmacro.expansion.com/energia-y-medio-ambiente/emisiones-co2?anio=2021, in the period from 1980 to 2021, totaling 41 years. of historical records of fossil CO2 emissions data for each country, collecting magnitudes from 184 countries on different continents. It includes sources of fossil fuel use either by burning or combustion, industrial processes of cement, steel, chemicals and urea, in addition to the use of the products.
Regarding the climate index of the North Atlantic Oscillation (NAO), in its own words, it is what dominates the variability of winter climate in the North Atlantic region. The database of this variable is obtained from the website: https://psl.noaa.gov/data/climateindices/list/, in the period from 1980 to 2021, considering 41 years of historical records.
Continuing with the description, there is the relationship between precipitation and temperature, overall, it is a linear trend approximation, in this case the variability of precipitation and temperature at the Managua airport station, Nicaragua, in the period of 1980 to 2021 each. The database is obtained from the information provided by the Nicaraguan Institute of Territorial Studies (INETER) in the period from 1980 to 2021, having 41 years of historical records. The variables are compared and correlated with the variability of CO2 and the NAO climate index.
Wind speed is another variable that is affected by sudden changes in climate, in this case the information, wind speed database, is obtained from the Nicaraguan Institute of Territorial Studies (INETER) for the period from 1980 to 2021, having 41 years of historical records. Similarly, the speed variable is compared and correlated with the variability of CO2 and the NAO climate index.
Historical Behavior of Each Studied Variable
The result of each of the variables is manifested in the historical behavior in the 41 years of studies, which ranges from 1980 to 2021. The results can be shown in the following Graphs 1-5.
Graph 1 shows a linear behavior, with a correlation R2 = 0.94, this means that CO2 pollution worldwide grows linearly and it increases rapidly.
The behavior of the climatic index variable is a moving average of two periods, with a sinusoidal movement moving over time, with a variable historical magnitude in each year.
The behavior of the precipitation variable is a moving average of two periods, with a sinusoidal movement moving over time, with a variable historical magnitude in each year.
The behavior of the temperature variable is a moving average of two periods, with a sinoid movement moving positively over time, with a variable historical magnitude in each year.
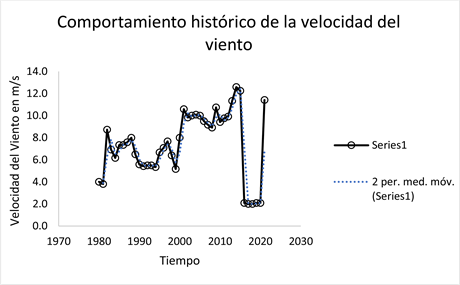
The behavior of the variable wind speed is a moving average of two periods, with a sinusoidal movement moving positively in time, with a variable historical magnitude in each year. Each variable is synthesized in a single graph, as presented below in Graph 6, a linear behavior is observed for the CO2 variable and for the rest of the variables a moving average trend, with sinusoidal movement
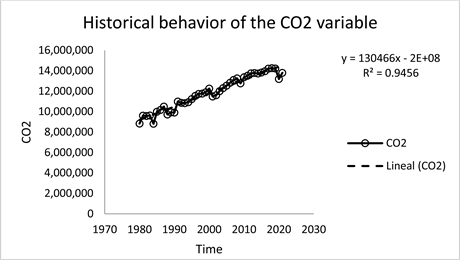
Note: the construction of the graph is based on the magnitudes obtained from the CO2 database at https://datosmacro.expansion.com/energia-y-medio-ambiente/emisiones-co2?anio=2021
Graph 1. Historical trend of the CO2variable.
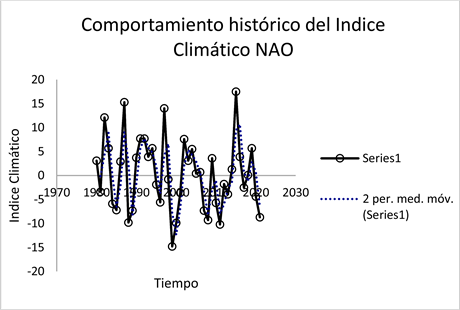
Note: the construction of the graph is based on the magnitudes obtained from the NAO climate index database https://psl.noaa.gov/data/climateindices/list/.
Graph 2. Historical trend of the NAO climate index variable.
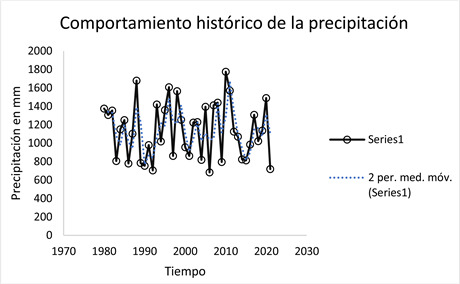
Note: the construction of the graph is based on the magnitudes obtained from the precipitation of the airport station in Managua, Nicaragua.
Graph 3. Historical behavior of precipitation in mm.
and with two periods., are compared with the CO2 variable and the impact it has on the other climatological variables can be seen.
The linear trend of CO2 corresponds to the baseline to compare the behavior of the other climatological variables studied. It is observed that the increasing production of CO2 causes a sinuous and unstable behavior in time and space, manifesting itself in climatic variability and presence of natural phenomena of great magnitude, persistence and repetition, felt by man as a threat and multiple
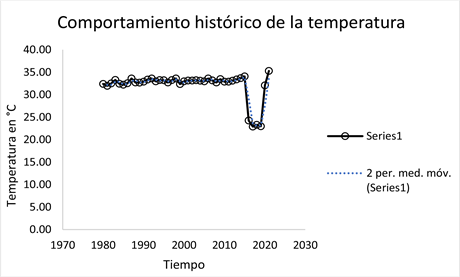
Note: the construction of the graph is based on the magnitudes obtained from the temperature database of the Managua airport station, Nicaragua.
Graph 4. Historical temperature behavior.
Note: the construction of the graph is based on the magnitudes obtained from the speed database of the Managua airport station, Nicaragua.
Graph 5. Historical behavior of wind speed in m/s.
threats causing disasters and catastrophes in the world.
Correlation between Variables
For the correlation between variables, the work data is the annual accumulated data, then each data is ordered from lowest to highest, the Statistical Normalization model is used, this to change the values of the data set and be able to use a common scale, Without distorting the differences in the intervals of values or losing information, the scale will be between −1, 0 and 1. Starting with Normalization, the comparison continues to understand the correlation and the trend to which it is closest. See Graph 7.
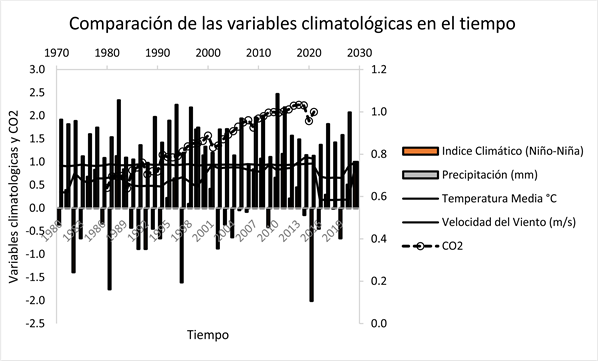
Note: graphs of historical behavior over time of climatological variables compared to the CO2 produced in each year.
Graph 6. Behavior of climatological variables over time.
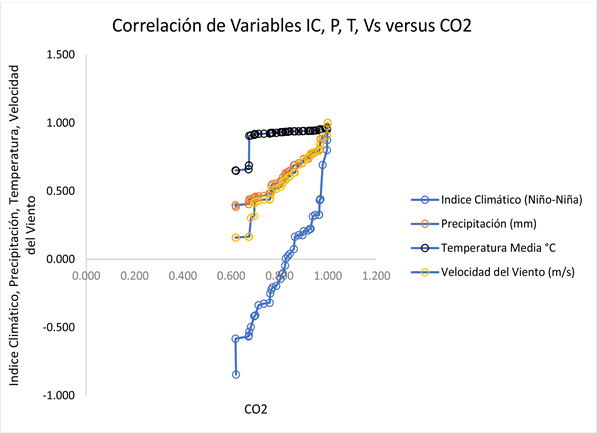
Note: IC = Climate Index, P = Precipitation, T = Temperature, Vs = Wind speed, and CO2 = Carbon Dioxide.
Graph 7. Correlation of variables IC, P, T, Vs versus CO2.
Below is a comparative table of the correlation of the variables with CO2, see Table 1.
Graph 7 shows the correlation that exists between the climatological variables with the amount of CO2. In the case of CO2 with the climate index, it represents a very high correlation of 0.934, meaning that the linear trend of CO2 over time influences the variability of the climate index; In relation to CO2 with precipitation, it represents a very high correlation of 0.9621, meaning that the linear trend of CO2 over time directly influences the variability of precipitation; In the case of CO2 with temperature, it represents a correlation of 0.44 from medium to low, meaning that the linear trend of CO2 moderately influences the variability of temperature; The correlation between CO2 and wind speed represents a very high magnitude of 0.9617, meaning that the linear trend of CO2 over time directly influences the variability of wind speed.
Projection of the Variables
Starting from the base year 2021, the variables were projected for the year 2035, having 14 years of analysis. See Graph 8.
Below is a comparative table of the projection of each variable versus CO2, associated with a trend (Table 2).
Graph 8 shows the correlation that exists between the climatological variables with the amount of CO2 projected for the year 2035. In the case of CO2 with the climate index, it represents a very high correlation of 0.9099, meaning that the polynomial trend of CO2 over time influences in the variability of the climate index; In relation to CO2 with precipitation, it represents a very high correlation of 0.9505, meaning that the polynomial trend of CO2 over time directly influences the variability of precipitation; In the case of CO2 with temperature, it represents a very high correlation of 0.9237, meaning that the polynomial of CO2 directly influences the variability of temperature; The correlation between CO2 and wind speed represents a very high magnitude of 0.9169, meaning that the polynomial trend of CO2 over time directly influences the variability of wind speed.
![]()
Table 1. Equation and correlation of climatological variables with CO2.
Note: Own elaboration, (2023).
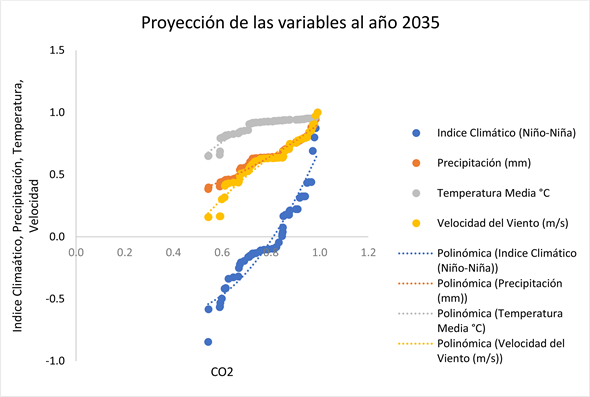
Note: IC = Climate Index, P = Precipitation, T = Temperature, Vs = Wind speed, and CO2 = Carbon Dioxide.
Graph 8. The projection of the different climatological variables versus CO2 to 2035 is shown.
![]()
Table 2. Equation and correlation of climatological variables with CO2 projected to 2035.
Note: Own elaboration, (2023).
5. Conclusions
According to the development of the research, the main variables that are currently directly linked to Climate Change are: CO2, the atmospheric index, precipitation, temperature and wind speed. The correlation that exists between the climatic elements of atmospheric index, precipitation, temperature and wind speed versus CO2, is very high, both in the historical behavior and the projected behavior to 2035, its correlation is estimated at 0.90, 0.95, 0.93 and 91 respectively.
The mathematical models used to manipulate the historical and projected analysis of the variables studied: are the normal arrangements, this ensures that the values can be used on a common scale; Then there is the analysis of the historical variables using the linear trend, establishing the correlational equations; and finally, there is the analysis of the variables projected to the year 2035 using the polynomial trend. In both situations, the direct relationship of greenhouse gases, mainly CO2, is directly related to the variations of the variables over time, which is a very worrying result because we can no longer talk about climate change, but rather about CLIMATE CRISIS.
To a large extent, a change in the paradigm of exploitation of the resources of our mother earth is required. Alert in an SOS manner to the great powers, which make reasonable use of technology. And that the actions are led to:
· Build resilient cities with low carbon emissions.
· Increase energy efficiency and the use of renewable energy.
· Apply smart agriculture in relation to the climate and take care of forests.
· Increase the recycling culture.
· Plant a tree.
· Promote a global environmental education program.