Development of a Web-Based GIS of Flood Zones in the Municipality of Ouagadougou in Burkina Faso ()
1. Introduction
Of all natural disasters, flooding has the greatest impact on highly urbanized areas in terms of the economy and loss of life [1] . Floods occur in many parts of the world, causing loss of life, damage to the economy, infrastructure and so on [2] . Flooding in urban areas is common worldwide and is associated with significant mortality and economic losses [3] . This is why flood risk assessment, management, response and preparedness are crucial [4] . According to documentary research carried out in two print media, Ouagadougou has experienced flooding almost every year. The rainfall associated with these floods varies between 43.8 mm and 261.3 mm. These floods have caused loss of life, casualties, injuries, house collapses and other major damage to economic infrastructure.
Cartography is a decision-making tool for land-use planning. They can be used to locate areas at risk from natural hazards, such as flooding and marine submersion, so that construction and human activities can be organized around them and their vulnerability reduced [5] . The maps can be used for many purposes, such as regulating building in flood-prone areas, identifying properties that require flood protection measures and educating the public about local flood risk [6] . Flood Awareness Maps are communication maps used to inform members of the public about the history of flooding in their communities, as well as the potential for future flooding and the risks such flooding would pose to residential properties, businesses, cultural assets, infrastructure and human life [7] .
The prevention of natural disasters should be systematically integrated into school curricula at all levels of education. This part of the curriculum should not be limited to a brief knowledge of natural hazards and safety measures. On the contrary, it must take into account the prevention of natural disaster risks, their reduction, vulnerability to these risks and the ability to withstand them [8] .
Various flood mitigation efforts are available. One such effort is education through classroom learning. The education effort can be done by developing learning on disaster mitigation topics such as flooding for elementary school students [9] . Unfortunately, most studies on flooding in Ouagadougou have not taken into account the aspect of learning how to mitigate the impact of flooding.
While flood-related disasters are the result of the interaction of natural and human factors, the human dimension is still sometimes underestimated in flood management [10] . Consequently, particular emphasis needs to be placed on the role of human capacity, especially education, training and communication on water-related risks, in mitigating the impact of floods.
Disaster mitigation is a series of efforts to reduce disaster risk, both through physical development and through awareness and capacity building to cope with the threat of disaster. Primary school pupils are individuals in the cognitive development phase at the operational level of the conference, which means that, in the delivery process, knowledge about disaster mitigation needs to be translated into concrete and tangible forms [11] . It is in this context that our study aims to fill these gaps in form and counterfactual figures to translate and raise awareness of the impacts of flooding to the development of an informative Web GIS for communication and awareness of the impacts of flooding.
Web GIS is the coupling of Geographic Information Systems (GIS) and the Internet, enabling geospatial data to be created, published, queried, shared and analyzed via the Internet. Nowadays, it is commonplace to find an Internet connection which, with an ever-increasing bandwidth, enables the use of powerful, interactive and constantly updated cartographic tools. Consequently, the development of a Web GIS informing the public of the flood zones of the city of Ouagadougou is necessary.
The development of GIS-based web applications supports decision-making and planning activities, and the integration of near-real-time information components into the system is very essential [12] . The strong combination of GIS and the Internet makes it possible to run a geographic information system wherever there is an Internet connection. Web GIS increases the audience for geographic information, disseminates and simplifies the exchange of geographic data, provides specific structured information and enables users to access geographic information system applications without using specific desktop software [13] . Why Web-GIS for floods, “because of the character of GIS: that is, the ability of a GIS to manipulate and analyze spatial information”. They can be used to answer questions about what exists today or what existed at some point in the past. More importantly, they can be used to predict what will happen or has happened in a particular place [14] .
In this work we used a Web-GIS comprising the following elements: a client (Mozilla Firefox, Google Chrome); a web server (Apache Tomcat); a map server (GeoServer); a data server (PostGIS from PostgreSQL); a map library (Leaflet JS).
An increase in flood risks and impacts as well as their global distribution is expected in the coming decades [15] . As a result, how can we design and implement an effective Web GIS for flood management in the municipality of Ouagadougou, in order to reduce the risks and mitigate the impacts of flooding on the population and its property?
The aim of this research is to produce an informative web map of areas liable to flooding in the city of Ouagadougou, with a view to providing information and raising awareness of the natural risks of flooding, so that the impact of these risks can be mitigated.
This paper presents a Web GIS application of flood-prone areas to serve as a means of communicating and raising awareness of the impacts of the effects of climate change on flooding. In this paper, after the summary and introduction, we have adopted a clear and precise methodology by describing the study area, the data and tools used and, above all, the Web GIS technology deployed. We then describe and discuss the results we obtained. Finally, we conclude the article with a few recommendations.
2. Methodology
2.1. Presentation of the Study Area
The city of Ouagadougou is located in the province of Kadiogo, itself in the Centre region. Ouagadougou has twelve (12) arrondissements and fifty-five (55) sectors (Figure 1). It is the capital of Burkina Faso and the country’s largest city. It covers an area of 518 km2 (SDAGO, 2010), or 0.2% of the national territory. It
![]()
Figure 1. Location map of the study area.
is bordered to the north by the rural communes of Pabré and Loumbila, to the east by Saaba, to the south by Koubri and Komsilga, and to the west by the rural commune of Tanghin-Dassouri. It is located at 12˚21'56'' North latitude and 1˚32'01'' West longitude.
2.2. Data and Tools
2.2.1. Data Used
Several types and forms of data are used in this study. Table 1 below shows the data used and what they were used for.
2.2.2. Tools
Data processing and analysis were carried out using the following tools: Office Word for writing texts, Office Excel for calculations, graphs and analyses, QGIS for cartography and spatial analysis, ENVI for processing satellite images, Expert-GPS for transferring data from the GPS to the computer and from the computer to the GPS.
2.3. Conception of Flood Zone Database Used for the Web GIS
2.3.1. Saaty AHP Technique Method
Saaty’s AHP technique starts with the identification and selection of decision criteria. We were able to identify and choose eight decision criteria: hydrographic network, altitude, slope, rainfall, soil types, land use and soil moisture index. We then mapped the different decision factors. Finally, the factors were classified, standardised and normalised. This phase involves comparing the factors in pairs, assigning weights to each factor and calculating indicators, i.e. calculating the eigenvalue, coherence index, coherence ratio and random coherence index.
2.3.2. Integrating Decision Factors in GIS
Knowing the weights and standardized values of each criterion enables us to calculate the flood susceptibility index, given by equation:
The equation:
![]()
Table 1. Data and characteristics of the data used.
Below is the application of the formula to obtain the flood susceptibility map for the municipality of Ouagadougou. The final mapping result is obtained using the formula:
(river system criteria × 0.21) + (altitude × 0.153) + (slope × 0.217) + (rainfall × 0.175) + (soil types × 0.058) + (land use × 0.072) + (soil moisture index × 0.115).
where, FSI: Flood Susceptibility Index, Wi: the weight of criterion i and Xi: the standardized value of criterion i.
2.4. Web GIS Platform Components
Table 2 below shows the technology used to develop the Web GIS platform.
2.5. Web GIS Platform Architecture
Below (Diagramme 1) is the general architecture for the development of the Web-GIS platform.
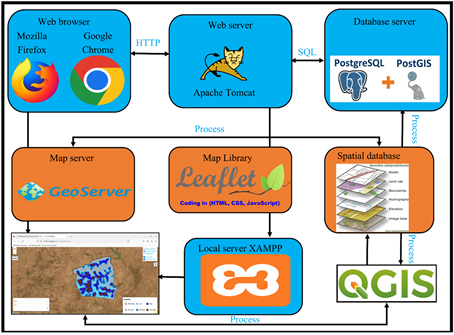
Diagramme 1. Web GIS architecture.
![]()
Table 2. Components and modules use for Web GIS.
2.6. Preparing the Leaflet Page
Leaflet is a mapping library written in JavaScript. For example, it is used by the free and open mapping project OpenStreetMap.
A free library designed for interactive web and mobile maps. It’s a light, powerful and simple tool that offers a multitude of functions with a minimum of HTML, CSS and JavaScript code [15] . The HTML (Hypertext Markup Language) is a language for describing (or marking) Web pages. It is used to present hypertext documents for display on the browser. It is a client-side language (like CSS and Javascript). CSS stands for “Cascading Style Sheets”. CSS is a computer language used to format web pages (HTML or XML). JavaScript is a programming language used by developers to design interactive websites. JavaScript functions can enhance the user experience of a website, from updating social media feeds to displaying animations and interactive maps. As a client-side scripting language, it is one of the leading web technologies.
3. Results
3.1. The Leaflet Web-GIS Platform
3.1.1. Web GIS of Flood-Prone Areas
The Web-GIS data is essentially the shapefile layer (shp) of the flood-prone areas of the municipality of Ouagadougou and the boundary of the study area, which is the municipality of Ouagadougou (refer to Figure 2).
3.1.2. GIS Layer Information
The platform is interactive. To find out more about an entity, just click on it and you’ll get the information it contains (see Figure 3 below).
![]()
Figure 2. Web GIS of flood-prone areas in leaflet.
![]()
Figure 3. Displaying details of mapped features.
The map below shows the areas at greatest risk of flooding in the Ouagadougou municipality (Figure 4 below).
3.2. Analysis of the Platform
The resulting flood susceptibility map shows 5 distinct classes of flood susceptibility zones. These are areas classified as very low flood risk, low flood risk, medium flood risk, high flood risk and very high flood risk (Figure 5).
In the Ouagadougou municipality the boroughs 3, 4, 6, 7, 8, 9, 11 and 12 are areas at high risk of flooding. These are the arrondissements of Baskuy, Nongr-Maassoum, Boulmiougou, Bogodogo and Sig-Nonghin. The figure above shows that only 7.47% of the territory of the municipality of Ouagadougou is highly exposed to the risk of flooding. What we need to look at in this context is not the extent of the municipal territory exposed to the risk of flooding, but the impact that flooding could have in terms of loss of human life, damage to property, etc.
![]()
Figure 5. Percentage susceptibility to flooding.
3.3. Uses of the Web-GIS Platform
The primary use of Web GIS is educational, offering a wealth of information to a wide group of users, helping to communicate about natural hazards, and acting as a preventive information tool [16] . The GIS web platform developed in this way is a truly decisive tool for the authorities in charge of flood management in the Ouagadougou municipality and the resident population. According to [17] Web-GIS applications make it possible to respond to needs, carry out missions, help in decision-making and solve cartographic problems that are feasible within the framework of the theory of graphic semiology. The development of the geoweb offers the public the opportunity to interact with maps and data [17] .
The platform shows a web map of very low flood risk areas to very high flood risk areas in the Ouagadougou municipality. You can choose to view only areas at high risk of flooding or vice versa. The image backgrounds are optional. You can choose which background image to use.
4. Discussion
The interactive Web GIS is used to inform, communicate and raise awareness of risks. It is available and accessible at all times. Web GIS is a high-impact communication medium in terms of information. It makes it easy to understand the message being conveyed. On the web map, the reality on the ground is represented in a simplified, understandable and informative way.
Given that there is no such thing as zero risk, we need to develop simple, common-sense measures that can be standardized and proven to be cost-effective [18] . The development of an informative Web GIS for mitigating the impact of flooding in the Ouagadougou municipality is part of this context. In these studies, we have used the database of flood-prone areas in the Ouagadougou municipality, designed as part of a project process, to develop the Web GIS. Indeed, Disaster mitigation is a series of efforts to reduce disaster risk, both through physical development and awareness and capacity building to cope with the threat of disaster [19] .
The Web GIS developed is a powerful tool for understanding, visualizing and managing flooding in the municipality of Ouagadougou. It thus helps to reduce risks and save lives. It is therefore necessary to continue developing and improving it in order to meet the growing challenges posed by flooding.
However, like any tool, the Web GIS platform has its limitations. The Web GIS platform is developed using the Leaflet JavaScript library, which could be a limitation of the platform in terms of the amount of geospatial data it supports. Rendering maps with numerous layers or large datasets can considerably slow down application performance. Data visualization is limited to 2D, and 3D cartographic visualization is not possible on the platform [20] . According to [21] Interactive maps can be limited by the server’s response to client requests. But it is important to note that these limitations can be mitigated by combining Leaflet with other mapping libraries.
5. Conclusions
This study presents a Web GIS of flood-prone areas in the municipality of Ouagadougou. The Web GIS platform developed is based on open-source software (Leaflet). It is interactive, intuitive and easily accessible. The application was mainly built using Leaftlet (JavaScript, HTML and CSS). The PostgreSQL database was used with the PostGIS spatial extension to manage spatial data types. GeoServer was used as the map server and OSM map data was adopted to support the application’s background processing. QGIS was used for processing, analysis and cartographic formatting.
The result is a map of flood-prone areas accessible via the web. The legend on the map shows areas at high risk of flooding, at high risk of flooding, at medium risk of flooding, at low risk of flooding and at very low risk of flooding. This online map is dynamic and interactive.
The platform provides information on flood-prone areas at different scales. This tool helps the authorities to manage, prevent and mitigate flood risks in the municipality of Ouagadougou. The project must continue by locating infrastructures such as schools and health services in flood-prone areas. The integrated geospatial data must be regularly updated. The GIS web platform developed will be used as a geography course to raise awareness of climate change and its effects.