Availability, Accessibility and Contribution of Infant Flours to the Diet of Children Aged 6-59 Months in Benin ()
1. Introduction
In Benin, complementary feeding practices for infants and young children have been inadequate for several years now. Indeed, according to the results of the 2017 Benin Demographic and Health Survey [1] , only 42% of children aged 0 to 5 months were exclusively breastfed, compared with 33% in 2011. However, contrary to breastfeeding recommendations, 28% of children under 6 months receive water in addition to breast milk, and 12% receive complementary foods [1] . Also, only 15% of children aged 6 - 23 months are fed according to the three best practices for feeding infants and young children, namely breastfeeding, number of food groups, and meal frequency [1] .
In addition to breast milk, 88% of children aged 9 to 11 months and 86% of those aged 12 to 17 months received complementary food in 2017 [1] , whereas these percentages were even lower in 2012 (69% and 71% respectively) [2] . Among breastfed children aged 6 to 23 months, just one in four (26%) received a varied diet, i.e. the child was fed foods from at least four distinct food groups. Of these children, less than half (45%) were fed a minimum number of times in an age-appropriate way to meet their energy needs [1] . Similarly, in 2012, less than half (43%) of breastfed children were fed the minimum recommended number of times, and just 29% were fed at least four different food groups. As for non-breastfed children aged 6 to 23 months, less than half (44%) were fed at least four times a day; in contrast, almost three-quarters received food from at least four different food groups [2] . In 2017, only 45% of non-breastfed children were fed at least four times a day, and just 38% were fed with at least four different food groups, according to WHO recommendations [1] . Overall, most children aged between 6 and 23 months, whether breastfed or not, are not properly fed. Only 16% and 15% of these children were fed according to the minimum standards of the Combined Index of Recommended Feeding Practices, in 2012 and 2017 respectively [1] [2] .
These inadequate complementary feeding practices have been shown to lead to poor nutritional status in children. Nutritionally-inadequate feeding is a major risk factor to growth, development, and health in the first years of life [3] . In fact, developmental disorders associated with stunted growth have been detected in infants as young as 7 months of age [4] [5] and persist into childhood and even later into adolescence [4] [6] . In addition, poor complementary nutrition has been shown to be a risk factor directly associated with growth retardation [4] [7] . Much of the decrease in height relative to age occurs during the period of complementary feeding, between 6 and 24 months of age [4] [8] [9] . In Benin, 32% of children aged 6 to 59 months are stunted, including 12.2% with severe stunting [10] . Other types of malnutrition issues, such as wasting and underweightness, affect 5% and 17% of children under 5 respectively [1] . These afflictions appear mainly during the period corresponding to the introduction of complementary food meant to supplement breast milk, which would have become insufficient to fully supply the infant’s needs in terms of energy and nutrients from 6 months up [3] .
From 6 months up, in line with the progression of its nutritional needs, an infant must receive complementary foods that are safe and nutritionally adequate, while continuing to breastfeed until the age of two years or more [11] . The guiding principles of an appropriate complementary diet include: 1) starting at 6 months with small food portions and gradually increasing the intake as the child gets older; 2) gradually increasing the consistency and variety of the foods; 3) increasing the frequency of meals: 2 or 3 meals per day for infants aged 6 to 8 months, and 3 or 4 meals per day for infants aged 9 to 23 months, with one or two additional snacks, as needed; 4) using fortified complementary foods or vitamin and mineral supplementation, as appropriate [12] .
Complementary foods for 6- to 23-month-old children should basically be composed of cereal products such as wheat, rice, barley, oats, corn, millet, and sorghum. Blends may also contain legumes or oilseeds in smaller proportions as they provide proteins and lipids in substantial quantities. A vitamin and mineral premix can also be added to better meet World Health Organization (WHO) recommendations and, hence, the nutritional needs of both infants and young children [13] [14] .
In 2016, Ouattara et al. assessed the nutritional richness of foods used in complementary feeding of young children in Burkina Faso and found that 50% of infant flours had nutritional characteristics in agreement with the Burkinabè standard NBF 01-198-2014, while 62.5% are in agreement with the Lutter and Dewey recommendations and 75% are in agreement with that of the standard Codex CAC/GL 08-1991, rev. 2013. However, no porridge pellets in Burkina Faso meets the technical specifications of any standard [3] . Similarly in 2018, Dimaria et al. studied the adequacy of locally-produced and marketed complementary foods in Benin, Burkina-Faso, Ghana, and Senegal and found that only 22% of the products could be considered satisfactory [15] .
In Benin, local ingredients-based infant flour formulas, designed to meet the nutritional needs of children aged 6 to 24 months, are increasingly offered on the market, particularly in urban and peri-urban areas. Despite these efforts, the nutritional status of children still has not improved. In this respect, the following questions are worth asking: Do all households have physical access to these flours? Are those flours affordable for households? What types of flours are found in households, and how are they used there? This research aims at answering these questions by examining the availability, accessibility, and uses of the flours and infant formulas available on the market and in some households in Benin. That type of information is essential to developing certified infant flour formulas based on the local ingredients encountered in Benin which will meet nutritional and safety criteria and yet be accessible and affordable in both urban and rural settings.
2. Materials and Methods
2.1. Study Design
This study is a descriptive cross-sectional survey based on food ethnography methods focusing on infant flours: 1) an inventory of infant flours available on the market and in households; 2) a food consumption survey about the uses of infant flours at the household level [16] [17] [18] .
2.2. Study Area
The survey took place in four urban areas (Cotonou, Porto-Novo, Natitingou, Parakou), peri-urban area (Abomey-Calavi), and two rural districts (Bopa and Zè). Cotonou and Porto-Novo are the main metropolis of the country and represent a commercial hub where most food products converge in the south. Parakou and Natitingou are the two most important cities in Northern Benin. Abomey-Calavi was selected due to its proximity to Cotonou, as the latter influences it. Bopa is a town with a critical level of food insecurity, with 40% of its households being food-insecure [19] , while Zè is a landlocked area equally threatened by food insecurity. The various study areas are defined on the map of Benin as follows (Figure 1).
2.3. Participants and Sampling
Children aged 6 to 59 months were the main target of this study. A sample size of 420 children (60 per survey area) was considered sufficient for estimating the mean (±sd) energy intake from the infant flours as taken by the children, at a 95% confidence interval and 80% power [20] . Households were randomly selected through multi-stage cluster sampling. In each town/district, a probability proportional to size was used to identify the neighborhoods to visit over a list of all of the neighborhoods. In each selected neighborhood, the entry points were the agents of municipalities, health centers, social promotion centers, and NGOs working in the area who helped establish the geographical distribution of the households. The random walk method was then used to enroll the households with at least one child aged between 6 and 59 months—until the sample size is reached. A total of 427 households were enrolled for the study. In the enrolled households, it was noticed that complementary food is introduced at three months of age for more than 58% of the children [1] . Therefore the lower limit of the target age was set at 3 months. In each household, all children aged 3 - 59 months were subsequently sampled for the survey.
2.4. Data Collection
· Survey on availability and affordability of infant flour
The free-listing method was used in the five urban areas. Overall, sixty-one
![]() Source: Food Ethnography_2023.
Source: Food Ethnography_2023.
Figure 1. The various study areas.
(61) retail outlets (open markets, minimarkets, supermarkets, drugstores) were visited during the study period, with an average of twelve (12) outlets per area. The method consisted in listing all of the products identified as infant flour at those points of sale, followed by a brief discussion with the merchants. Data about the various infant flours (brand, recipe, nutritional composition, packaging, expiry date, quantities sold, prices per time interval, and storage conditions) were recorded.
Discussions with key informants at the household level were also conducted in both urban/peri-urban and rural areas. Two types of key informants were relied upon: i) resource persons with knowledge and experience in agriculture and health (agribusiness agents, NGOs involved in the field of nutrition, local agriculture promotion stakeholders specialized in food security; health centers, social promotion centers) and ii) knowledgeable people who have lived in the community for a long time, in order to obtain relevant information regarding the local diet and its changes over time; this second group brings together local leaders, the elderly, and the members of various groups, associations, or professional organizations. Discussions conducted with the informants were about: 1) quality of infant flours used to feed children, 2) availability and accessibility issues, 3) the ingredients used in making the flour, forms of storage, and preservation methods.
· Survey on the uses of infant flours
The survey was conducted combining a food frequency survey (involving all children aged 3 - 59 months among the 427 identified households) and a weighed food record (WFR) involving a sub-sample of 74 children aged 3 - 23 months (10 children per study area identified among the 61 households that participated in the food frequency survey). The subsample was mainly based on the conditions of being in the habit of using infant flours and willingness to participate in the study.
The consumption frequency consisted of a recall of infant flour consumed by the children during the seven days preceding the day of the survey. Data were collected through a semi-structured interview based on a standard questionnaire with the child caregivers found in the households (mothers, guardians, etc.). Mothers were asked to describe how many times their children consumed infant flours the past week and the number of times per day. The daily portions consumed by their children were estimated from pre-calibrated household utensils which were presented to them. This recall enabled the evaluation of the proximal composition (energy, fat, protein, fibers) and the micronutrient contents (iron, zinc, calcium, vitamin A and C) of the flour porridge taken by the children. Estimated portions were converted to a standard unit (gram) according to the standardized Gibson procedure [21] . The amounts of relevant ingredients in the porridges were determined using the standard recipe method. The nutritional composition for 100 g of each porridge recipe was calculated using the mixed method developed by FAO [21] . For this purpose, the West African food composition table which was updated in 2019 [22] , the Malian food composition table [23] , Tanzania table [24] and the USDA table [25] were used. For pre-manufactured flour bought from retail outlets, the nutritional information mentioned on the packaging was recorded and taken into account. For purposes of calculating intakes, the US nutrient retention factor table version 6 [26] and the one integrated into the West Africa composition table have been used to account for nutrients lost during the porridge cooking process.
As for the WFR, all foods consumed by the children over a 24-h period was weighed before consumption, as well as the amount of ingredients used in cooking the meals and the whole amount of the cooked foods. All the ingredients used in making the porridge were weighed (including the water) before their introduction in the cooking pot. Cooked porridges, as well as those served and the leftovers, were weighed. The extra ingredients added to the porridges before their ingestion by the children were also quantified. The quantities of porridge consumed were used to determine the daily nutritional intake for the children (macronutrients, iron, zinc, Ca, Vit C, Vit A). Also, information on forms and relating to consumption of infant flours, the main processing operations and culinary processes were recorded. Foods were weighed using kitchen digital scales.
2.5. Data Analysis
Statistical analyses were performed with SPSS 16.0 software. Data were analyzed with descriptive statistics. Shapiro Wilk test was used to check the normality of the variables distribution. Descriptive analyses were used to compute frequencies in order to characterize the inventoried flours, the information contained on the packaging, the storage methods and storage duration of the flours in households, the forms of consumption, daily and weekly number of times consumption has occurred. The average age of the children was calculated as well as the average daily quantities of the porridges consumed. A comparison of average unit prices was made from different periods of the year and within each retail outlet, using Mann-Whitney U-statistic at a 95% CI 5% significance.
Based on calculated nutrient intakes and recommended daily allowance (RDA) (Institute of Medicine and FAO/WHO 2002 for micronutrients), the coverage rate of the nutritional requirements for children aged 3 to 23 months was computed. Kruskal Wallis H statistic was used to make comparisons of average dietary intakes between study areas.
3. Results
3.1. Socio-Demographic Characteristics of the Informants
A total of 151 informants were interviewed. The average age of respondents in both urban and peri-urban areas is 37 ± 10 with a minimum of 20 and a maximum of 60; 54% of those were women. Almost all of them (99%) were married and 1% is widowed. Their occupation is as follows: health worker, doctor, midwife, nurse, assistant nurse (44%); food technology technicians (4%); agronomists, head of an agricultural promotion center, nutritionist, food safety officer (10%); pharmacy staff 16%; social worker 12% and 14%other (quality control officer, daycare manager, teacher, etc.).
In rural areas, respondents were mainly women, mothers or caretakers. The average age of the women was 31 ± 8 with 15 and 53 as the lowest and highest, respectively. Twenty-seven percent (27%) were housewives, 37% retailers, 17% handicraft (hairdressing, sewing, etc.), 9% employed (accounting secretary, caregiver, teacher), and 10% farmers.
3.2. Inventory and Description of the Infant Flours
The inventory of infant flours in the 61 retail outlets of the five urban/peri-urban areas resulted in a total of 313 infant flours of different brands and varieties (Figure 2), distributed as 31% in Cotonou, 22% in Porto-Novo, 16% in Abomey-Calavi, 13% in Parakou, and 8% in Natitingou. Flours are mostly found in drugstores in all of the visited areas. As for households, a total of fifty-seven (57) flour types were identified of which 8% were manufactured, the remaining 92% (52 flours) being home-made.
![]()
Figure 2. Distribution of infant flour types by points of sale in urban and periurban areas (n = 313 infant flours).
Ingredients and flour processing
At the points of sale, it is found that several ingredients were mentioned on the packaging of the inventoried 313 infant flours: cereals of which corn (41%) is the most frequently mentioned, then come wheat (27%); rice (14%), and millet (13%); milk powder skimmed or whole (43%); sugar (41%); soybean (28%); red palm oil (13%) and other vegetable oil (10%). Some ingredients are mentioned on less than 10% of the flours, such as tubers (8%), carrot (6%), honey (4%), fish (3%), rye (3%), banana (3%), and apple (3%). A share of 12% had vanilla added for the taste. Vitamin and mineral supplements appear to be noticeable ingredients, since they are mentioned by 45% of the flours, especially by the imported ones. Figure 3 shows the most used ingredients in the production of infant flours encountered at the points of sale (n = 313 formulas).
In rural areas, of the 8% manufactured infant flours, the most used ingredients were cereals. Of those cereals, the most frequently used is corn (86%), followed by sorghum (39%), millet (37%), rice (27%), and, to a lesser extent, wheat (9%) and fonio (4%). Soybean is the most frequently used legume (57%), and fish is added to the recipe by 25% of the mothers. Other ingredients used are cassava (4%), groundnut (7%), milk powder (4%), and sugar (14%). Of the 52 home-made infant flours, 82% were made of a single ingredient namely corn (66%), sorghum (19%), millet (11%), soybean (3%), or cassava (1%). The raw grains are purchased (81%). Another 1% of the household receives the ingredients as gifts from family members or neighbours. The processing operations of the flours include milling (27%), sorting (22%), washing (13%), soaking (1%), sieving (1%), drying (12%), and roasting (9%).
![]()
Figure 3. Most used ingredients in the production of infant flours encountered at the points of sale (n = 313 formulas).
Packaging and labeling
At points of sale, flour packaging is presented in three categories: transparent or opaque polyethylene bag packaging (43%), double or single bag packaging (30%), and cardboard packaging (5%).
With regards to labeling, targeted consumers, their age, the flour’s nutritional composition and its expiry date are some of the basic but required information consumers would need. However, most (88%) of the flours sold at the visited retail outlets are not adequately labeled. In fact, only 38 flour types were adequately labeled with the basic essential information and, of those 38, 95% were on sale in drugstores.
Storage conditions
Infant flours storage conditions, both in households and at the retail outlets, are shown in Figure 4. All flours produced at home were stored in bulk in containers at room temperature, with only 34% of the containers covered. At the retail outlets, 67% of the packed flours were left at room temperature and only 33% were kept in ventilated room, with or without air conditioning. Flours stored at home were used over time periods of varying length: fifty-two percent (52%) of the flours were used within one week of its making, while 4% were used over the subsequent 21 days or more. Another 26% and 18% were used respectively within 1 to 14 days and 14 to 21 days.
Cost of the flours
At the retail outlets, the flours cost between 1 and 16 dollars US per kilogram, depending on the brands, formats, and variety offered. We observe that the difference in price among brands is large. For instance, the unit price of “Pépite d’Or” is 4.6 USD whereas that of “Cérélac” is 13.48 USD. Within the same brand, prices vary depending on the product considered: the unit price of “Blédine lacté croissance” was 10.64 USD while that of “Blédine fruit et lait” or “Blédine legume” was 11.35 USD.
![]()
Figure 4. Storage means of infant formulas.
At open-air markets, the average portion sold is 0.4 ± 0.18 kg ranging 0.2 - 2 kg for an average price of 7.26 USD. The average unit price (per kilogram) during the abundance and lean periods are respectively 7.25 ± 4.52 USD and 7.26 ± 4.52 USD, with a range of 1.06 to 16.83 USD. Comparison of the average unit prices between the abundance and lean periods showed no significant difference. The unit price at any time in a drugstore is 7.43 ± 4.65 USD. In supermarkets, this price is 6.80 ± 4.01 USD. There was no significant difference between the average unit prices in pharmacies and supermarkets.
3.3. Consumption of the Infant Flours
Consumption frequency
The flours are consumed by children in the form of porridges with either a thick or watery consistency. The average number of days per week when the porridge is taken by the children was found to be 5.3 ± 2.24 days. It was also found that more than half 50% of the children take this porridge every day of the week, in both urban (57%) and rural areas (62%). The average daily consumption was 2 ± 1.13 times. The number of consumption days per week is not different between study areas (Table 1) but differs between age groups (p = 0.000). The number of times the consumption takes place a day was significantly different between urban and rural areas (p = 0.015) and between age groups (p = 0.000). More of the children under 24 months of age (67%) take the porridges seven days per week and two to four times per day (67%) than those aged older than 24 months. Table 1 shows the frequency of consumption of infant flour porridge by children aged 3 to 59 months in urban and rural areas.
3.4. Nutritional Content and Intake by Infants
The average daily amount of infant flour porridge consumed by children is 434 ± 351.41 g with a minimum of 24.33 g and a maximum of 2312 g. The average energy intake from the infant flour porridges varies from 150 kcal (Ze/rural) to 427 kcal (Abomey-Calavi/periurban). Except for Zinc intake (p = 0.043), there was no significant difference between urban/periurban and rural areas in energy and nutrient intakes (Table 2). The contribution of the porridge to the recommended nutrient intake is highest for proteins (64%) and about a third for zinc (33%) and iron (28%). The recommended nutritional intake (RNI) was low for calcium (10%) and was the lowest for both vitamins C (3%) and A (2%). Table 2 shows the nutritional requirements satisfied by various flour porridges consumed by children by study area.
![]()
Table 1. Consumption frequency of infant flour porridges by children aged 3 - 59 months in urban and rural areas in Benin (n = 436).
![]()
Table 2. Nutritional composition and daily nutrient intake of the infant flour porridges taken by children aged 3 to 23 months.
*Values are mean ± SD, otherwise Kruskal Wallis Test.
Table 3 below shows the nutritional value per 100g of each type of porridge consumed by the children.
Table 4 shows the percentage of nutritional needs met per age group children aged 6 to 12 months have their energy needs covered up to 26%, their protein needs covered up to 69%, iron up to 24%, and their need in vitamin A is barely covered (0.85%). As for children aged 12-23 months, 31% of their energy needs were covered, 64% of their need for protein were covered, 46% of their need for iron were covered, and 3% of their need for Vit A were covered.
4. Discussion
The aim of this study was to assess the composition and accessibility of infant flours on both the market and in households in Benin. The results obtained reveal that physical accessibility and availability of infant flours to the populations varies according to the level of urbanization of the study area. This could be explained by the fact that the cities of Cotonou, Porto-Novo and Parakou are the most urbanized and have many more retail outlets than the rural area. As a matter of fact, it is observed that retail outlets in urban areas are not only numerous but also of various types, namely drugstores, supermarkets/grocery centers, etc.). Not only that, some retail outlets are set up along many pedestrian passageways as well as in the vicinity of homes i.e. within residential areas. As a result, city dwellers have easy access and can easily acquire the said flours. This finding is consistent with those of Donkin et al. who argued that easy access of consumers to businesses is an important physical factor which influences food choice in a given population and that ease of access, in turn, is dependent upon resources such as quality of the means of transportation and geographical location [27] .
The average sales price of the flours available on the market was 6.87 USD per kg, and no significant difference was found between the average prices from abundance and lean periods (p = 0.985). As the price of the flours did not vary from one period to another, no distinction could have been made between the abundance and lean period of infant flours. As a result, infant flours can be bought at relatively the same price in either a drugstore or a supermarket (p = 0.133).
A quantity of 50 g of adequate complementary food was suggested by Lutter & Dewey [28] as a reasonable daily ration to properly feed children aged 6 to 23 months. Therefore a household must spend 0.42 USD per day to feed such a child. Also in 2010, Dimaria et al. found that the sales price of locally-produced flours varies between 2.18 USD and 7.42 USD per kg averaging 4.80 USD per kg [15] . That means it takes 0.24 USD per day to feed a child aged 6 to 23 months. Yet, as in many other developing countries, about a third of the population of Benin lives on less than $1 a day [29] and, additionally, is the segment of the population which suffers the most from malnutrition. Consequently, many households cannot feed their children with those store-purchased foods, because the price is out of their reach-being deemed too high. Indeed, 92% of the flours
Table 3. Nutritional value per 100 g of the various ingredients entering the porridge recipes.

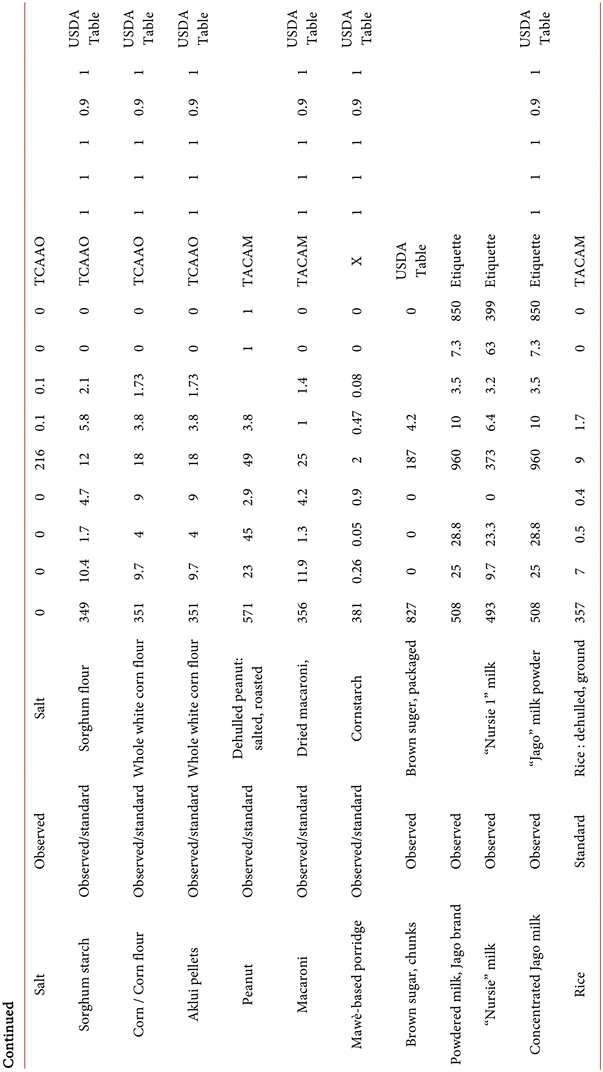
x = http://www.lanutrition.fr/fraliment/fraliment/3849-fecule-de-maïs.html: Accessed on January 13, 2023; y = https://i-dietetique.com/: Accessed on January 13, 2023. NRF = Nutrient Retention Factor; TACAM: Mali Food Composition Table; TCAAO: West African Food Composition Table; TCAT: Tanzania Food Composition Table; *USDA Table of nutrient retention factors.
![]()
Table 4. Percentage of energy and micronutrient needs met per age group.
*RNI Institute of Medicine and WHO/FAO 2002; These results are provided by the consumption of flours of which 81% are homemade (Traditional) and 19% pre-manufactured.
found in the household were homemade, with a traditional processing method. We note that the findings here are similar to those of Kouton et al. in 2017 [30] .
Given our availability and accessibility results, it is to be expected that it would be difficult for households to use infant flours sold in the retail outlets. This is because, for the flours to be consumed by a greater number of children, it has to be of affordable price and be steadily available in the right places [31] .
The ingredients used in the production of the flours found at the retail outlets are comparable to the recommendations of the Codex Alimentarius [12] [13] which suggests that children’s formulas are to be composed of cereal products such as wheat, rice, barley, oats, corn and millet, and then sorghum, and legumes or oilseeds in smaller proportions. Dimaria et al. found similar results in 2018 [15] . Plus, our results show that milk is the first protein source, ahead of soybean and small fish; unlike Dimaria et al. in 2018 who found that soybean is the primary source of protein ahead of milk [15] . Sugar was added to many of the formulations found at the retail outlets. This one finding is somewhat similar to that of Dimaria who found that sugar is added to 20 of the 32 flour types investigated [15] . In accordance with WHO recommendations, mineral and vitamin premixes are added to most of the flours imported from overseas. Dimaria et al. found such a result. Indeed, mineral and vitamin premixes are added to 18 of the 32 flour products we’ve studied [15] .
On the other hand, homemade flours see no addition of milk nor of mineral or vitamin premix. Sugar, which is almost nonexistent in infant flours, does not get added until the moment the porridge is ready to be taken by the child. This is probably because homemade flours are often made of a single ingredient (most often corn, and then sorghum or millet once in a while) which also serves as a staple food for the whole household. Soybeans were the main protein source in some households and were sometimes enhanced with the addition of fry fish. Such results were found by Kouton et al. in 2017 [30] . We observe that the complementary foods used in the households are neither rich nor diversified. This can be explained by their low purchasing power and lack of knowledge about the design of the right complementary foods.
Packaging plays an important role as an interface between the product, the company and the buyer. It helps protect and preserve the product. According to Olivier Bruyeroon, product conservation depends on its initial water content and the possible interaction between the product and the outer environment through the agents that water, air, and light are [31] . In this regard, the packaging must be strong and waterproof. Throughout our study, more than half of the packaging found are cardboard packaging (53%) and only 3% were made of polyethylene. This result is corroborated in the case of cardboard packaging but is antagonized in the case of polyethylene bags to that of Olivier Bruyeroon [31] . However, our finding on polyethylene use as a packaging material is still corroborated by results from Serge Trêche [32] . Single or double plastic bags (30%) constitute the second type of packaging found at the retail outlets, a finding comparable to that of Serge Trêche, who found that several production units for infant flours use two plastic bags between which labels are slipped [32] . Container/plastic or metal box packaging account for 13% of the various forms of packaging. According to Olivier Bruyeroon, the aluminium boxes enable a very good display of the product but they are generally too expensive to be affordable [31] . This potentially explains their low use by producing companies.
For the whole flours, only 12% provide information on the age of the children the flour is earmarked for, the nutritional make-up of it, and the expiry date. In contrast to Dimaria, the packaging of almost all the flours we’ve investigated (97%) displayed an expiry date, 56% mentioned the age of introduction of complementary foods, and 69% provided information on the energy value and nutritional content [15] . These three pieces of information are part of the Codex Alimentarius minimum requirements for the labelling of infant flours [31] . These results prove that most agri-food companies producing infant flours do not go out of their way for quality assurance in order to fully deserve the trust of customers.
There is a clear difference between the storage modes at the retail outlets and in the house. In fact, the flours stored in open containers at the house are exposed to air, water (vapor), and light. They are therefore prone to rodent attack, mold growth, and oxidation of lipids causing rancidity, especially since 48% of these flours are kept for anywhere between 7 and 21 days or more. So the microbiological and sanitary quality of these flours can rapidly degrade.
Also, the microbiological and sanitary quality of the flours stored at the retail outlets can be altered in the long run if they are not sold quickly because no packaging is absolutely waterproof, even if some have extremely low permeability coefficients [31] . The development of mold is favored by the water content of the product. Mold growth occurs when this water content exceeds 12% [31] . Therefore, the shelf life depends on the time that the flour takes to reach 12% moisture content. This time will depend on the permeability of the packaging used and, therefore, on its type and thickness [31] , especially as it is either left at room temperature or in an air-conditioned environment. Cardboard packaging would thus better preserve infant flours if they were used in addition to a polyethylene packaging. In the same way, polyethylene bags would better preserve the infant flours if they had a thickness of between 150 and 200 microns [31] . As for the plastic bags, a thick plastic bag should preferably be chosen to prevent weevils and mites from piercing them. The minimum recommended thickness is 0.35 mm; if two such bags are used, then the recommended minimum thickness is 0.20 mm each [33] .
In terms of processing the ingredients to obtain the flours, washing removes impurities [34] , sieving removes the undigested fibers, soaking reduces the phytate content of some cereal and legume species [35] , while roasting reduces microorganisms and improves the organoleptic qualities as well as the digestibility of the food [13] . Roasting also allows pre-cooking of the ingredients and the partial degradation of the starch. Furthermore, dehulling removes seed husks, thus partially removing fibers, tannins, phytates and other phenolic compounds that compromise the bioavailability of nutrients [34] , while fermentation improves the content of crude fiber, lipid, and protein [36] . In this study, sieving, soaking and roasting are almost absent from the flour production stages in the home. On the other hand, washing is practised by few households. But dehulling and fermentation are absent among the unit operations. These results are contrary to previous studies [36] [37] [38] and [39] , but all the households conduct milling operations. Indeed, any transformation process requires milling, and the resulting flour should be finely powdered and dry for good preservation. Because the adult diet is not suitable for a child whose digestive tract is not yet able to digest and absorb complex foods, the way complementary foods are designed should allow them to be easily digestible and, therefore, easy to assimilate. As a result, households should be aware of the steps involved in producing such a digestible complementary food. In that regard, special emphasis should be placed on roasting as it increases the mineral, carbohydrate, and energy content—in the same way fermentation, which is not observed in households should be taught as it increases the lipid content [36] .
The culinary process observed in this study is contrary to previous studies [37] in terms of ingredients combining. Indeed, the porridge makers in the households respected no ratio: neither in combining the ingredients nor between flour and water proportions. However, we’ve found that the cooking times were comparable [37] .
Regardless of the study area considered, flours produced by households are more commonly used. Thus the use of homemade flours for the preparation of porridge is a relatively common habit among mothers in both urban and rural areas. The highest consumption frequency (3 - 4 times) is observed in children aged 3 to 24 months. These results are in line with WHO recommendations [11] . This is explained by the fact that infant flours are foods specially designed for children in complementary feeding, and these foods are more suitable for them than for children aged 25 to 59 months who are completely on the family dish already.
The average mineral composition of the various porridge recipes identified during the consumption frequency study is very low. This could be explained by the type of flour used, and the very low proportions of ingredients used in the home. Indeed, 74% of flours consumed by households are traditional flours produced by the households themselves. As result, those children did not consume porridge from pre-manufactured infant flours in 92% of the cases, of which only 18% were compound flours and 82% were simple flours (made of corn, sorghum or millet or soy). Similar results were found in previous studies by Dimaria et al. (2018). In fact, only 22% of the flours studied could be considered as having a satisfactory nutritional value with certain flours having calcium, zinc, lipid low or very low content compared with the recommendations of the Codex Alimentarius [15] .
There was no significant difference between intakes from any two study areas (p > 0.005) except for Zinc (p = 0.043). From one area to another, Abomey-Calavi has the highest coverage rates for almost all the nutrients (energy, protein, Ca, Fe, and Zn) with a protein coverage rate beyond 100%. The lowest coverage rates were found in virtually all areas with nutrients such as Vit A, Vit C and Ca. The highest coverage rate for children aged 6 - 12 months involved protein intakes (69%). Grembombo in 2003 had found a similar result; in fact, the protein coverage rate (105%) of this age group was higher than that of the other nutrients [40] . On the other hand, Mitchodigni in 2002 found that Iron has the highest coverage rate which was 356% [41] . For children aged 12 to 24 months, the coverage rate remains high as far as protein is concerned. For this age group, the coverage rate remains high for Iron, at 523% in 2003 according to Grembombo [40] and 86% in 2002 according to Mitchodigni [39] . In general, the coverage rates of children’s nutritional needs from our study remain low compared to the results of Mitchodigni and Grembombo, and this is especially true for all age groups. This can be explained by the fact that the present study is devoted exclusively to infant flours while Grembombo and Mitchodigni studied all of the foods consumed by the children during the day.
5. Conclusion
This study on the availability of pre-manufactured infant flours shows that they are more available and physically accessible in urban areas than rural ones. It is observed that the cost of the flours is expensive for households in both rural and urban areas, which does not make it easy for the households to acquire them. The porridge recipes consumed by households in all the study areas varied and their mineral composition was very low. Given these results, we suggest that public authorities ensure that outlets of quality infant flours do exist in the vicinity of households and at a reasonable price. It is also necessary to educate mothers on the importance of complementary feeding and train them in the design of quality flours. In so doing, they will be able to produce safe and adequate flours on their own.
Author Contributions
Conception, design, supervision, review of draft: N.F.-F; validation: N.F.-F., D.J.H.; statistical analysis, results interpretation, final manuscript write-up, M.S.K., N.F.-F.; draft review and editing: F.T.F.L., N.F.-F., F.J.C., Y.E.M., B.H.B., M.A., D.J.H.; supervision: N.F.-F., D.J.H. All authors have read and agreed to the published version of the manuscript.
Acknowledgements
We would like to say a sincere thank you to the INFLOR project which provided the resources for conducting this study. Our thanks also go to the Faculty of Agricultural Sciences who coordinated this work.
Data Availability Statement
The data presented in this study are available on request from the corresponding author. The data are not publicly available due to the presence of personal information of the respondents.