1. Introduction
The evaporation rate is dependent on the properties of the liquid and conditions of the environment, such as temperature, velocity, humidity and turbulence of the air. Because of the numerous changing and variable parameters, the accurate determination of the evaporation rate is a complex problem. The general correlations used to determine the evaporation rate can be found in the literature. The phenomenon of evaporation can be divided into two main groups, one that occurs at natural convection and one that occurs at forced convection. In natural convection, mass transfer occurs due to the movement of air caused by the difference in density of gas at the liquid surface and the gas above it. In the case of gas flow being present, the saturated layer of gas is carried away and is replaced by drier gas, thus accelerating the rate of evaporation, this is called evaporation at forced convection. Many studies have been done on water evaporation in recent years. Li et al. (2011) [1] performed an experimental study of falling water film evaporation on newly designed enhanced tube bundles and investigated the influence of film Reynolds number on heat transfer coefficient and temperature on convective heat flux. Schwartze and Brocker (2000) [2] studied water film evaporation in moist air with different humidities. Raimundo et al. (2014) [3] numerically simulated water film evaporation in the airstream and discussed the effects of air velocity, water-air temperature difference and air relative humidity on the evaporation rate. Yang and Yan (2011) and Yu and Wang (2012) [4] [5] studied water film evaporation on solid surfaces using molecular dynamics simulation method. Leu et al. (2006) [6] experimentally investigated water film evaporation on a vertical plate covered with a thin porous layer and found that such a layer enhanced the heat and mass transfer during the evaporation process. In addition to the studies on water film evaporation, there are also studies that have focused on water droplet evaporation (e.g., Lee et al., 2012; Deendarlianto and al., 2014; Nakoryakov et al., 2012; Takata et al., 2004) [7] [8] [9] [10] . In most cases, the correlations that describe the phenomena were determined by regression analysis of the data collected during measurements. The equations that define the evaporation rate are only useable in narrow ranges of interpretation and specific conditions; this hinders their general use.
Tang and Etzio [11] did their experiment outdoors, where they compared the evaporation from the water surface with the evaporation from wet material. The measurement of the evaporation rate was derived from measuring the variation in water weight. The analysis of the results has shown that the evaporation rate is not directly proportional to the difference of the partial pressures corresponding to the water temperature and the dew point of the air as other researchers have claimed before. They have also found that if the air velocity is very low, then the evaporation rate from the surface of the wet towel is higher than from the water surface. The opposite is true at high wind velocities; however, their results can be used in the case of small water surfaces.
Jodat et al. [12] examined two kinds of evaporation models, the Dalton-based correlations, and the similarity theory. These were compared with their results on a wide range of water temperatures and air velocities. During their study, they found that with the increase in air velocity and partial pressure difference, the evaporation rate also increased. At forced convection flow regimes, the Dalton correlations showed acceptable results; however, when significant ripples started appearing on the water surface, the similarity theory underestimated the evaporation rate. In the case of a mixed flow regime, neither of the theories was able to describe the evaporation rate due to the mild, non-linear nature of the partial pressure difference.
Raimundo et al. [13] investigated the evaporation rate of heated water at various air velocities, relative humidities and temperature differences between water and air. In order to do this, they created a simulation with the help of a CFD program and also took measurements in a low-velocity wind tunnel. The results were compared to other researcher’s results and were used to validate the simulation. They found that the difference between the temperature of water and air and the relative humidity does influence the evaporation rate; however, this effect is less significant than that of the one caused by the air velocity. At low air velocities, the temperature difference and the moisture content are determinative while at higher values, the air velocity is more important.
Inan and Atayilmaz [14] also performed low-velocity wind tunnel measurements to determine the evaporation rate to create an equation that depends on the air velocity and the partial pressure difference. During the evaluation, the evaporation rate showed a dependence on the three mentioned parameters that were similar to the one in theory. If the air velocity and the air temperature increase, and the relative humidity decreases, then the evaporation rate increases. The correlation they made is similar to the one by Carrier [15] , but the evaporation rate is not directly proportional to the partial pressure difference. This is backed by the claims of Pauken [16] , Tang and Etzion [7] , and Moghiman and Jodat [17] .
Mohammed Shah [18] presented an improved model of evaporation from water pools in his publication. In the paper, there is a correlation he created for evaporation under both natural and forced convection, and the former was conducted in a purely theoretical way. He used 24 different datasets to validate his results, where he performed a wide range of interpretations. Besides, he compared the results of the equations with each other and found quite significant differences between them. According to all studies, the particularity of our study is its broad character on large water reservoirs.
The primary goal of the present paper is to numerically analyze the heat transfer of supercritical water in three dams in the Nakanbé basin in Burkina Faso for a period of thirty years, that is to say from January 1, 1991 to March 15, 2020. Physical mechanisms of both enhanced and deteriorated heat transfer are revealed with numerical results. Effects of various dimensionless parameters are studied extensively.
2. Study Zone
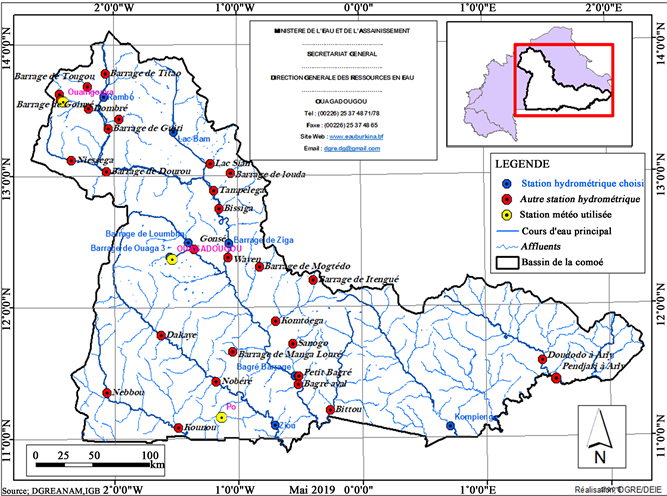
From a hydrological point of view, the Nakanbé drains the entire central and northern part of the Mossi plateau and only flows during the rainy season. The first intermittent flows can occur in May, but it is only in July-August-September that the flows become permanent at the Wayen station (catchment area of 20,800 km2) and strengthen downstream to reach Bagré (catchment area of 33,120 km2) an average value of 65.4 m3/s in July, 145 m3/s in August and 107 m3/s in September. The hydrometric network of the Nakanbé basin is composed of several dams schematized according to the following network map.
3. Position of the Problem
Let’s consider a parallelepiped impoundment domain with the length L = 2 m and the height H = 0.5 m. The upper face is in contact with the ambient environment and is therefore the seat of evaporation by natural convection. Under the solar flux, there is a difference in water temperature, generating natural convection transfers.
Let’s consider the following simplification hypotheses:
· Transfers are bi-dimensional, the domain width is supposed to be very large
compared to the other dimensions,
· Water is an impressible and Newtonian fluid;
· Viscous dissipation according to the energy equation is not significant. There is no chemical reaction;
· Water physical properties are constant, except for the volume mass that aligns with the BOUSSINESQ approximation.
4. Mathematical Formulas
After By adopting the simplifying hypotheses made above, the equations that govern the natural convection transfers in the impoundment are written in the Cartesian reference system (O, X, Z):
· Continuity Equation
(1)
· Equation of movement quantity
Following component [OX)
(2)
Following component [OZ)
(3)
· Energy Equation
(4)
where
is defined by:
(5)
with
the incident flux at z and
the solar constant given by:
4.1. Initial Conditions
To avoid divergences, we must start from an initial state that is close to reality; physical volumes are therefore taken as follows:
Being the time when the solar flux is captured by the water’s surface.
(6)
(7)
(8)
4.2. Boundaries Conditions
These various conditions are summarized as follows:
being the time when the solar flux is captured by the water surface.
Et
(9)
(10)
Et
(11)
(12)
Et
(13)
(14)
Et
(15)
(16)
(17)
where
: the evaporation velocity is written:
(18)
(19)
(20)
5. Numerical Methodology and Validation of the Model
The integration of Equations (1)-(4) and their boundary conditions (6)-(17) by the finite volume method described by Patankar (S. V. Patankar, 1980) leads to an Algebraic equation system that we solved using Thomas’ method and the SIMPLE algorithm. The meshing is non-uniform in both directions. In order to validate our calculation code, we compared our results to those obtained by V.P.SINGH et C.Y.XU (Singh, V.P. et al., 1997) during the study. As shown in Figure 2, our results perfectly correlate with those obtained by V.P.SINGH et C.Y.XU. Indeed, the maximum relative gap between data noticed and those calculated by our code is 5.12%.
6. Results and Discussions
6.1. Loumbila Dam
It was built in 1947 (Inventory of water reservoirs in Burkina Faso-Water balance sheet). Its initial volume, which was 36 Mm3, was increased to 42.2 Mm3 from May 14, 2004. The purpose of the Loumbila dam is to supply drinking water to the city of Ouagadougou. The Loumbila dam has a high evaporation rate, as shown in Figure 3(a) and Figure 3(b). We evaluated this evaporation rate over a period of thirty years (30 years), that is to say from January 1, 1988 March 15, 2020. By applying the calculation code to the Loumbila dam knowing the
![]()
Figure 3. Validation volume of water stored and evaporated from January 1 to December 31, 1988-2019 for the Loumbila dam in two dimensions (a) and in three dimensions (b) of the model.
different characteristics of the dam such as the daily volume of water stored, the daily rating, the area of the dam, we estimated 48.9% as a rate evaporation from the Loumbila dam, i.e. approximately 50% of the total volume of water stored in this reservoir during this period.
6.2. The Dam (2 + 3) of Ouagadougou
It was built in 1934 for N˚3 and in 1962 for N˚2 (Inventory of water reservoirs in Burkina Faso-Water balance sheet). It is a drinking water supply structure for the city of Ouagadougou. It results from the combination of dam N˚2 and dam N˚3. Multiple repairs have been made, the most recent and oldest being that of August 2002 which increased the nominal capacity from 5.6 Mm3 to 6.87 Mm3.
In dams, Ouaga (2 + 3) the rate of evaporation occupies an important place because it represents almost half of the volume of water stored for each given year (Figure 4) represented in 2 dimensions and in 3D. Through our model, we
![]()
Figure 4. Validation volume of water stored and evaporated from January 1 to December 31, 1988, for the ouaga 2 + 3 dam in 2D (a) and 3D (b).
![]()
Figure 5. Volume of water stored and evaporated from January 1 to December 31, 1988 for the Bagré dam in 2D (a) and 3D (b) and volume rate evaporated and stored (c).
evaluated this evaporation rate at 49.4% over a period of approximately thirty years (1988 to March 15, 2020). This huge loss of water by evaporation is a phenomenon often forgotten in the design of our large water reservoirs (ponds, dams, etc.) because it is very often difficult to assess.
6.3. The Bagré Dam
Considered as a hydroelectric and hydro-agricultural work, the construction of the dam ended in 1992 followed by impoundment on July 1, 1992. Its catchment area is 34,000 km2. It is equipped with two 8 MW turbines. The average turbine flow is 30 m3/s. Its total capacity is estimated at 149 billion m3 or 1.14% of that of the Akosombo dam in Ghana.
The analysis of Figure 5(a) and Figure 5(b) shows that the Bagré dam like all the other dams is exposed to the phenomenon of evaporation. This phenomenon is well and truly present at such a high rate estimated at 40.4% of the volume of water stored in this reservoir. Thus, the evaporation rate increases with the water filling rate in the reservoir (Figure 5(c)) which is itself a function of the volume of water stored in the reservoir. Depending on the years and the types of months given, the rate of evaporation increases with the increase in the climatic variables (solar flux, air temperature, wind speed, etc.) or decreases with the decrease in them.
7. Conclusion
In short, we can say that our calculation code estimates the evaporation of the 3 dams in Burkina Faso at approximately 50% of the total volume of water stored in these reservoirs. We can then affirm that the evaporation rate represents approximately half of the total volume of water stored in the reservoir.
Acknowledgements
Avoid The authors are grateful to the International Science Program (ISP), Uppsala University for their support to BUF 01 research group and to this work.