India’s 2023 “Economic Corridor” versus the “21st Century Chinese Maritime Silk Road”: A Modern David against a Recent Goliath? ()
1. Introduction
The Seaborne Trade-ST is an international activity by which the places of production are connected, by ships, with the places of potential consumption or use. This way shipping adds value to the global Production.
The specific activities of the ST are manifested in two important functions: the international exports and imports in volume (Figure 1 & Figure 2) and in value.
![]()
Figure 1. The share of the international exporting regions, 2020. Source: Author; data from ISL (2021).
![]()
Figure 2. The share of the international importing regions, 2020. Source: as in Figure 1; (*) and the Caribbean.
As shown, Asia was most active2020 reaching the 42% of the total exports vis-à-vis 14% of Europe and 10% of N America!
As shown, “Asia” handled the 66% of the total imported volumes, where Europe achieved 15% and N America 8%.
As far as the “North-South” ST is concerned, the developed countries excelled in its $ exports, as expected, with more than $12tr in 2021 (56%), where the “developing” economies added about $10tr. So, the developed counties’ exports were more valuable than those of the developing ones, having apparently a higher value added or CIF prices!
More interesting than the above is that the developed countries became even less competitive overtime, and more dependable on the rest of the world, because they imported2021 goods valued $909b more than that exported! This dependence we expect to increase as time goes-by because—apart from Agricultural products—Europe-28 has already depleted2005 all its raw materials (but bauxite)! This issue is very crucial for Europe-28 as without local raw materials many enterprises will have to import them from China or India or elsewhere!
The Chinese exports arrived2020 at $2.6tr (about 14% of the total of ~$18tr), while that of USA was 1.4tr (~8%) and that of the EU-28 reached the impressive amount of about $11tr (61%) (ISL, 2021). In imports2020, China arrived at about $2.1tr (about 12%), USA at 2.4tr (13.5%) and EU-28 at $10.3tr (58%) (ISL, 2021). This last statistic justifies why both China and India look forward to export their products to Europe!
We have distinguished 2 periods for the global ST: (1) the one before the Global Financial Crisis-GFC, i.e., since 1987 (Figure 3) and the one after 2009 (Figure 2).
In the 20 years1987-2007, ST increased by more than 2 times, having a certain low growth rate1998 (0.01%) and2001 (1%), and a faster one2006 (7.1%) (ISL, 2008). For 5 continuous years1997-2001, the ST was stagnant. It started with 3000 million tons1975, peaked-up1979 at ~4000 and increased, after1983, from 3000, and till2007, reached ~7600 (ISL, 2008).
In the 10 years2011-2020, the ST performed better than previously (Figure 4).
It increased from 9495 m tons to 11,539, or more than 1.2 times. Apparently, 2020 showed a fall, and the2018-2019 period was stagnant! We can attribute this partly to the detrimental influence of the Covid-19!
Shipping has 2 allies, which however, may become very easily enemies: the cargo volumes, and their distances1 ! In fact, shipping is a blessed industry, we believe, because the places of production, (e.g., USA, EU-28, etc.)—are located
![]()
Figure 3. The seaborne trade, 1987-2007. Source: data from ISL (2008).
![]()
Figure 4. Seaborne trade, 2011-2020. Source: ISL (2021).
round at least 3000 major commercial ports2007 (Stopford, 2009, Chap. 9) —which moreover are far away from the places of consumption or use (e.g., India, China, etc.)!
The international competition, fortunately, moderates the—at times—emerging high freight rates2003-2008 determined by the supply and demand of ship space—when and where it works, and taking its time, to about 10% on average on goods’ FOB price, given elasticity of demand.
The Geography of the ST, though very important, it has been often taken as rather constant by Maritime Economists, and thus its deeper study did not appear frequently in the scientific journals dealing with maritime economics.
The new element of this paper is its dealing with the emerging potential “antagonism” between the modern “Chinese Silk Road”2013-2023 and “India’s Economic corridor”May2023.
The Aim and Organization of the Paper
The aims of this paper are: 1) to evaluate the effort2023 of India to establish an “economic corridor” to Europe-28, vis-à-vis the prior example of the Chinese “Silk Road”2013-2023. 2) To focus—naturally and exclusively—on the two key-countries: China and India, and spell-out their advantages and shortcomings in the above two grant international endeavors, which will affect the global GDP!
The paper is organized in 5 parts, after literature review, as follows: Part I dealt with an Anatomy of the Seaborne Trade; Part II dealt with the 21st century “Maritime Chinese Silk Road”; Part III dealt with China as a case-study; Part IV dealt with India as a case-study; Part V dealt with India and China in comparison. Finally, we concluded with the Concluding Remarks and the main Conclusions.
2. Literature Review
Lorange (2009: p. 36) argued that the strong growth in trade, par excellence to/ from China and India, together with the strong propensity of USA and Europe-28 to import, determined the freight rates2003-2008! However, he predicted that a slowdown, in the Chinese demand for oil and raw materials, would be likely to lower the high freight rates, as it happened. For China, he said, much depends on the terms of finance provided to foreign ship-owners by the Chinese shipbuilding industry.
Tamvakis (2012) argued that the ST retarded, due to the GFCend 2008, but since2012, ST recovered. He also admitted that certain countries, like par excellence China and India, caused the expansion of the ST as a result of their desire to grow. He also admitted that the climatic issues will become central, affecting the use of the fossil fuels, especially after the failure of the Copenhagen summit2009, as it happened.
Lyridis and Zacharioudakis (2012) argued that as long as crude oil will continue to be the main energy source, the oil tanker industry will remain one of the fundamental sectors of the world trade.
Summarizing, we may recall what Japan eventually understood. It understood that a major worldwide importing and exporting country like itself “had to” help foreign ship-owners to achieve a lower operating cost than hitherto! This lower cost-given world competition—it would mean a… lower transport cost for Japan also!
The above particular task was undertaken by the Japanese shipbuilding. Because, if it is essential to help national shipbuilding, more essential is to help international shipping to become more competitive…! While, providing subsidies to national ship-owners, one may invite the reaction of OECD for distorting competition, as it happened with S Korea.
Greece e.g., owned (01/01/2023) 393 m dwt, (4936 ships; average size ~80,000 dwt) and China owned 302 m dwt, (8839 ships; average size about 34,000) (UNCTAD01/01/2023). No doubt the world fleet is a serious global industry contributing ~$1.3tr, where Greece owned ships valued $149b (12%), China $139b and Japan $135b!
3. A Theoretical Background
In the international trade theory, various unclear doctrines advanced from time to time. After the 2nd world war e.g., the theory for autarky appeared, where “a country has to isolate itself from the international trade by imposing tariffs etc., so that to become self-sufficient in production…”
The above worked against nature, we believe, because countries are endowed differently with various natural resources as well a number of people (population) with varying degrees of intelligence! These endowments in quantity and quality—together with the proper technology—shape the cost of production. This gave birth to the early theory of the “comparative (labor) advantage” due to Ricardo (1772-1823), advocating “Free Trade2”.
A more recent theory refined the above by paying attention on the prices of the (same) goods among countries, or what we today mean by CIF prices. Of course, the parity between exchange rates can play a substantial technical role by making the export prices lower and the import prices higher…!
One difference between producing for country’s people and producing for foreign people is to gain foreign exchange in the 2nd case, so that to be able to import what else is needed, but the wise move is mainly to import for further growth! This last task is not always possible, as e.g., Greeks import very expensive cars, and oil as well gas, which they lack!
Theories were also advanced for countries to seek to replace part or all of their imports with national production—known as “import substitution”. This meant to establish domestic industries protected—technically—by tariffs and quotas, e.g., in consumer goods first, and then in capital goods. This theory seems to have failed in practice.
A rather recent policy is to boost exports, the proper name of which is the “export-led growth” one, meaning to focus on exports for an economy to expand, and to accumulate foreign exchange!
Summarizing this part, every country is recommended to specialize in producing what is endowed by nature3—often neglected—given endowments’ quantity, quality, and technology as well CIF prices, and then export them in exchange!
A further research, about what a country is endowed with is self-understood, as this is not always known, and because technology is all the time advancing (e.g., in relation to batteries; to semi-conductors; to material matters; to solar panels; to nuclear fusion; to climate’s protection, etc.)!
As CIF prices obviously are related to the productivity of people, as well to its number, intelligence and education, an applied research in boosting productivity is highly recommended—as this paid-off in Asia4. Certain countries educate their people abroad for the latest knowledge, or even export their unemployment (Greece; India, and others). These activities are recommended as providing short- and long-run benefits!
But most important of all is a country to be able to import the latest technology! Developing countries need obviously foreign exchange for this, and thus a prior positive trade balance seems to be required. The latest knowhow goes with technology, we believe! Advanced countries most probably will avoid selling their latest copyright technology, but perhaps their previous vintage. Here national people’s intelligence counts so that “the student to surpass the teacher”… (the Japanese paradigm in manufacturing cars)!
Part I: An anatomy of the Seaborne Trade
The 2 main factors in the global ST are the volumes of exports and of imports (Figures 5-7), as well the distances required to be covered (Figure 8),
![]()
Figure 6. Exports from the 5 main areas, 2020. Source: data from ISL (2021).
between the ports of departure and those of arrival.
3.1. The Seaborne Trade in the Atlantic & in the Pacific/Indian Oceans
As shown, the Exports and the Imports from/to the Atlantic5 and the Pacific/Indian Oceans, were balanced62005 (48% - 50% and 50% - 52%). The difference was greater between Exports and Imports from/to Maritime Asia (where:
Japan held 7%, China 9% and S&E Asia 16%). The exports there covered 23%, but the Imports held 41% (4594 m tons)! Thus, Maritime Asia depended2005 heavily on the rest of the world so that to import, mainly, crude oil and iron ore!
However, the excess of the $ imports over $ exports do not help economies, because they build-up a $ deficit in their trade-balance, retarding also their growth for lack of adequate foreign exchange.
Worth noting, and also a warning at the same time, is that both ST volumes and distances—are changeable, modifying accordingly the demand or the supply of sea transport or both, as the recent war of R-U has shown! New quality supply centers, e.g., often appeared, and old ones—from time to time—also disappeared, due to higher prices, or to depletions, or due to longer distances, as this happened with the iron-ore from Brazil to Japan.
Nowadays, a number of countries like Mexico (par excellence near USA), India, Vietnam, Thailand and Malaysia, look forward to “grasp” a portion of the USA trade, perhaps by counting on the shorter distances, or on new political alliances than hitherto.
Moreover, Crude oil as well oil products, as we all know, faced the different distances over time due to embargoes, local wars and various OPEC+ policies (Stopford, 2009) . The geography of the sea transport, therefore, is dynamic, and it should be studied by the ship-owners all the time, and especially after the Ukraine-Russia war2022. This paper may contribute towards such an endeavor.
3.2. The Recent Global Distribution of Exports
Exports increased by more than 62% between2005-2020, where Middle East—as shown—maintained the 1st position—due mainly to crude oil exports—of almost 18% of the total—followed by S.E. Asia (~15%).
As shown, (Figure 7), the crude oil dominated in the past in the ST, with a 29% share in distances & volumes, in a total of more than 32b ton-miles, followed by iron ore with 15%, or of about 5b ton-miles. Crude oil has achieved2020 more than 16% in m.t. or 1885 million tons.
The above situation is not surprising, because 2008 was the last year before the GFC, and where distant markets for iron ore and for crude oil—like those of China—had already appeared.
3.3. The Distances in Seaborne Trade
The distances also varied from 4600 n m to 4000, after they peaked1980,2005 (Figure 8).
As shown, the average trade-distance shortened1980-2008, the last 28 years, by as much as 600 nautical miles! And the recession2002 was due also to a lower average distance, which fell to 41002002 from about 43802000-2001. Distances will further shorten if China reduces its activity. The trade with India will cut the average trade distancesafter 2023, we reckon (India is nearer to EU-28 than China).
Analysts (Intermodal in 10/10/2023) believe that USA will increase its demand for crude oil because its stock fell to 350 m.b.—a very low number, followed also by EU-28, as well by China, which is expected to increase its crude oil imports from S Arabia and Russia.
3.4. The Attraction Exercised by EU-28 to China’s and India’s Products!
One may wonder why China and India look forward to export to Europe-28 (West, Baltic and Med)… Figure 9 gives an answer, where 23% of the global trade emanated from Europe 2005.
As shown, Europe-282005, of more than 353 m people, and almost of a $12tr GDP, traditionally held a substantial portion of the global ST—double than that of N America—and more important, Europe-28 is a net importer of 0.9b tons (2.1b imports and 1.2b exports). Europe depends on imports for raw materials, as mentioned. EU-282020 imported from China PR products valued $440b and exported $226b! India exported only $38b to Europe-28.
Summarizing this part, N America and Europe-28 historically were2005 the dominant players in the worldwide imports in the Atlantic, while in exports, one has to add the East Coast of S America7. For the imports in the Pacific: China and India excelled with a 41% trade share8, as mentioned.
Part II: The 21st century Maritime Chinese Silk Road
According to Iftikhar and Abbasi (2016) , the term “Silk road” has been used by the German F. von Richthofen, in 1877, to indicate a number of Chinese land and sea routes, from Asia to Europe and Africa (red lines in Scan 1). In 2013, China revitalized the Silk Road, targeting at a regional grant economic cooperation project (blue arrows) with 154 countries!
As shown, the “21stcMCSR”—started from China, went on to S Chinese Sea, S Asia, Indian Ocean, Africa and Europe and to S Pacific! This “road” is clearly longer and more ambitious than the “economic corridor” of India. The “21stcMCSR”, according to “China’s national development & reform commission”2015, has the most novel intentions, like the “mutual: respect—non-aggression—benefit and non-interference; equality—and peaceful coexistence”!
It seems that one way to build a trade connection—and perhaps not only—is when a powerful economy, like e.g., the Chinese, the Japanese, the USA, and the Russian—“invests” in other countries! Japan as well others have taught us this.
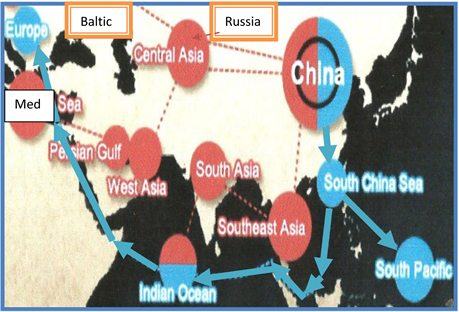
Scan 1. The 21st century maritime Chinese silk road, 2013-2023. Source: modified from that in Iftikhar and Abbasi (2016) .
Globalization also has taught us the same lesson!
Another way is to lend countries $, as China, and others, did. This last way, however, attracted a bad name, i.e., that of the “debt trap”, meaning that when one country lends to another $ for various—mainly infrastructural projects—with a view to get its money back, the beneficial country may be—after all—unable to repay it, as this has happened in 7 cases so far involving China!
Figure 10 shows the $ provided by China 2013-2023—to other countries related to “Silk Road”.
China invested $722b2013-19 (75%) out of $966b2013-2023 in infrastructural works in… 154 countries concerning roads, railways, ports etc., so that to connect them—trade wise—especially the developing countries of Africa—with Europe! China signed 200 trade etc. agreements with these countries, and 32 ones with various organizations!
As shown, the $ devoted, were reduced2020-23, however, to 1/2 or even to 1/3, vis-à-vis2015. The Chinese construction companies involved employed also a few million Chinese workers! Of course the above task-of the Chinese economy—was possible, we believe, due to the trade balance surpluses, which the Chinese economy achieved, through the Chinese banks. China2022 exported $3.4tr, almost 15% of the world total, and had an almost 30% annual growth in exports, and imported $2.7tr, about 12% of the world total. Thus, the Chinese trade-balance left $675b surplus for just one year! If this surplus is achieved every year, then during the above period2013-2023 China could have gathered about $7tr in foreign exchange! To spend $1tr for the Silk Road is not so important!
The data below show the 7 countries, which were unable to repay an amount
![]()
Figure 10. The funds invested by China in other countries along the “21st century Maritime Chinese Silk Road”, 2013-2023. Source: data from “Kathimerini”, Greek Weekly Journal, 01/10/2023.
of $240b or 25% of the total2013-2023 to China.
True is that China faced a number of unfortunate events: 1) in initiating the “21stc MCSR” had to face a Pandemic 6 years latter2019. 2) Had to apply sound banking principles in lending foreign countries so that to protect its banks. 3) Had to charge a rather high interest rate of 5%. 4) Missed to transfer a certain “vintage of its knowhow” to the beneficial country. 5) Not thought an equal % employment between local labor and Chinese one. 6) Not thought to ask a certain, e.g., a maximum 40% of imports, from China by the beneficial country, if this allowed by the WTO. We hope India to avoid all or certain of the above obstacles!
The world economic growth surely played a primary role in all the above endeavors: China2019-2022 grew respectively by 6%; 2.3%; 8.1% and 3.9%, above USA and EU-28! The Chinese mentioned that their GDP increased by 5.5%1st semester2023.
The Chinese, naturally, support the “21stc MCSR” with reference to what they call “the initiative” → “One Zone, One Road”, with further reference to over 3000 projects, in co-operation, carried-out so far! According to World Bank, the world GDP will increase by 1.3% p.a.2030, due exactly to the above Chinese initiative of the Silk Road (or $1.6tr)!!
The Chinese, moreover, do not miss any opportunity to mention the good investment they did in “Piraeus Port” (Greece)! The Chinese, moreover, look forward to invest further in the Greek economy for projects like: the “Green Growth”, the “digital economy”, the production of energy from the N Greek winds, the so called “State Grid”, and… looking forward to the export Chinese electric cars… to Greece!
We believe that China will pursue further the production of cars (Scan 2) for exports, and following the example of Japan one day to… sell quite a number of cars in USA (Besanko et al., 2017: p. 190) !
As shown, China1st quarter 2021 produced about 5.8 m cars (or over 23.2 m p.a. est.), above EU-27, Japan and S Korea!
We were, however, impressed personally by China’s increase of funds, by 23%, in scientific research, something, which we consider it as the most important of all other Chinese achievements! In addition, France, UK, Japan and Germany increased their investment in China! The foreign companies established in China were 24,000, as mentioned—in the Greek Sunday Press—by the Chinese Ambassador in Greece Sept. 2023.
Let us have a closer look at China.
Part III: China as a case-study
Mr. J.D. Sachs—Professor at Colorado University10/09/2023 in the Greek Sunday press—and a supporter of China—argued that USA is very sensitive when other countries try to obtain a higher economic and technological advantage! He mentioned the cases of USSR (during the Cold War), of Japan1980-1990 and of China2015.
Japan—as we all know—achieved an advantage in shipbuilding, in semi-conductors, in popular electronics and in private cars, and not only. USA then asked Japan… to revalue the Yen1990. China2015 decided a policy: “Made in China, 2025”, focusing on sectors concerning the robots, information technology, renewable sources of energy, etc.
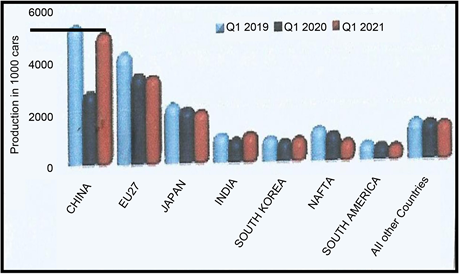
Scan 2. Global car production, 2019-2021, per quarter, in 1000 cars. Source: modified from that in ISL (2021).
China2013 announced the initiative: “one belt, one road”. USA imposed tariffs on the Chinese imports—against the international trade regulations—and other restrictions. China2017 exported to USA 22% of the total, which by2021 this fell to 19% and by2023-mid fell to 13%. Nowadays17/09/2023 the importing of photovoltaic systems—with cheap solar panels—from China alarmed both EU-28 and Norway.
EU-28 indeed is trapped in the search for renewable sources of energy to achieve the 45% mark2030, given its recent green agreement! Tariffs imposed2012 by EU-28 on China, but2018 China came back. EU-282022 spent more than 25b Euro in the solar energy systems! China in its West area is endowed by the raw material required for the solar panels (the pyrite), producing the 2/5 of global production! This gives China a serious comparative advantage.
The cases of rivalry between EU-28 and China will crop-up all the time, we believe: $ e.g., belonging to USA and EU-28 are invested now in India, Mexico, Vietnam and Malaysia (according to the “Rhodium Group”). India received more than $65b2021-2022 from the US and EU $, while China received only about $20b2022 vis-à-vis $120b2018! Of course, the one producing semi-conductors may win a part of the final “battle” between East and West…
Another issue is the prices of the electric cars made in China, and exported to Europe-28, amounting at 14 m2023 (est.) at the moment, and aiming at a 15% share2025…Of course Europe-282023 is the most vulnerable area, because it is expected to import cars covering eventually a 106% share. It is expected also that the EU-92023 to import 700,000 electric vehicles!
Buyers are interested in low priced electric cars of a certain quality and fast delivery, no matter who produces them, we believe! Japan was the first to apply the formula: “make low priced cars and not only—of a good quality—export them—even at a loss—and profit from the sales of their spare parts! Clever!
Also: “as volumes of exports increase, so the average cost will fall”, applying an “after sale research” as well. The more one exports, the more one is able to reduce the FOB price, and increase quality! Of course the car sector is extremely important for EU and for Germany, Italy, Volvo, Citroen, Renault, etc. and the rest of the world (USA; S Korea; Japan) producing cars, bringing in $560b and concerning 14 m cars, and the battle here will be great, we believe.
But, we have noticed a paradox, however, and this concerns the cars, using gasoline, produced already in China and amounting at about 15 m, for which… there is no Chinese demand! These cars are/or will be exported abroad, to Russia and Australia-Belgium-Spain and UK, concerning 6 m cars p.a., and expected this number to reach the 9 m2030… Of course Tesla, Ford, Nissan and Hyundai, which produce cars in China they will wish to export them!
China is also keen in the “digital infrastructure” by having invested in 165 countries a system called “Beidou” made by “Huawei”. This is a 4G satellite system covering already 70% of Africa’s network! Eighty (80) countries have Chinese systems of security and surveillance. They have also Chinese systems to access Internet, involving about 3b people worldwide and in countries like Indonesia. Another project is the railway-express to connect China with Laos. India also rests on constructing railway connections with the adjacent areas and neighboring countries.
Summarizing this part, China has the advantage, as having started first, i.e., 10 years ago, (the first mover theory9), to establish tight connections and bonds with almost the entire number of UN, acquiring extensive experience in infrastructural projects and inside knowledge of the beneficial economies, so that to be in a position now to draw vital conclusions by carrying-out cost/benefit studies for future action or inaction and potential withdrawals, we believe.
China knows by now “where, and why, it burned its fingers”, and it may withdraw from there, given also the fewer $ spent2020-2023. India only then will have an opportunity in countries where China will withdraw from, we believe. But the experience of China is going to be valuable for India too if can be passed-on or sold-out. Thus, a kind of China-India cooperation it would be fruitful! As the big powers know, antagonism between them is going to benefit the small powers-except in the case of a nuclear war—where nobody will get-out alive.
Moreover, the Chinese shipyards obtainedOct 2023 ship orders at a % 60 - 726 vessels of about 18 m CGT vis-à-vis 25% of S Korea, having also a 48% on ships on order under completion (Scan 3).
Part IV: India as a case-study
India’s economic corridor-IEC is shown below (Scan 4).
As shown by our black arrows, India wishes to connect itself with Dubai (UAE), Riad (S Arabia), Haifa (Israel), Salonika (Greece), and Europe-28. This is a shorter road than the Silk Road to Europe-28. India looks forward to use the
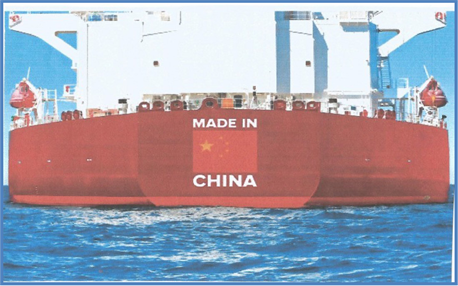
Scan 3. The supremacy of the Chinese shipyards (Oct. 2023). Source: modified—not recorded.
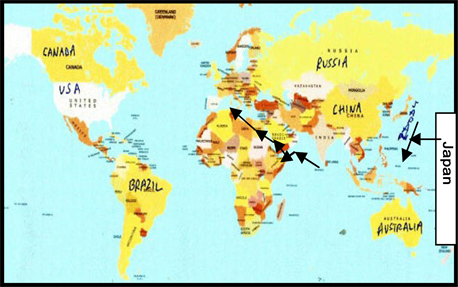
Scan 4. India’s economic corridor, 2023. Source: modified from that in internet.
Port of Salonika for proximity of India’s products to EU-28. In our opinion, Salonika port, however, is not the most suitable for EU-27, as much as is Patras. India also nominated Greece as one of its “strategic partners”, together with France and Germany!
India has shown also interest17-09-23 in establishing in Greece Pharmaceutical factories, investing in Tourism, together with building the Iraklion/Crete airport, in making chemicals etc. for plantations, in manufacturing clothes and in promoting India’s exports! India also wishes to export… its unemployed people by requesting work permits mainly from UK (as well visas)!
IEC is a part of a strategy of India, demonstrated by the personal visits2023, in various countriesafter2012 of its Prime Minister, Mr. Narendra Modi, including Greece! India clearly wishes to play a greater role in the ST of Europe-28 than hitherto!
The G-20 summit has already provided the opportunity09/09/23 to Mr. Biden and Mr. Modi to chair the signing of a “memorandum of understanding”-MOU about an “India-Middle East-Europe’s” economic corridor… China was absent in G-20 summit-something unpleasant, we believe. Unpleasant is also to EU and USA, the Russia-China common understanding over Russia’s war in Ukraine.
India of course may copy Japan—developed-out successfully! But the knowhow is urgently needed in such cases! This can be obtained by buying it—if for sale. Also it can be obtained by importing the relevant (top?) technology (machinery etc. and copy it), if the proper foreign exchange exists. Most countries prefer to obtain knowhow the easiest way—but this is not recommended by us—i.e., by FDI. The ground seems suitable, as USA and not only, supports the adventure of India.
There are also the joint ventures and the international partnerships, etc., but the essential issue is the locals to make the relevant production, under the supervision of foreigners, and not the other way round. In other words, the industries established locally, to be able to stay/exist and after the departure of foreigners—for various reasons—from the country!
India’s exports of iron ore to the “Pacific Rim” should be mentioned. We have also to mention the production of the 25% of the world rice by India—but the majority of it is used inside the country. Moreover, India needs to import energy sources to produce electricity in rather serious quantities (for power generation).
If India, however, could find abundant oil, or gas, or even coal, locally, then its future could be brighter, provided that it has also its own iron ore to produce steel.
India imported2020 coal from Indonesia (69 m. tons; 48%) and from Australia2020 (30 m.t.; 29%), totaling10 at 144 m.t. China also imported2020 coal from Indonesia (80 mt; 35%) and Australia (72 mt; 32%) out of 226million tons (Figure 11).
As shown, India2016 reached China2019 and Europe2018. In more detail for China and India2010-2020 (Figure 12).
As shown, India2015-2016 reached, and passed over, China, in the imports of coal, following, however, a certain decadence2018-2020.
The essential advantage of India is its vast, and cheaper, labor, and its people’s efficiency in computers, we believe! Japan e.g., based its economic development—not so much on resources-based industries—because it lacked oil and iron ore—but on the knowledge ones (Goulielmos, 2018) ! Of course Japan had first to obtain the approval, and the required knowhow—somehow, and at any cost—mainly from USA… This, we believe, is the proper strategy also for India
![]()
Figure 11. Imports of Coal by China & India etc., 2011-2020. Source: modified from that in ISL (2021).
![]()
Figure 12. Imports of Coal by China and India, 2010-2020. Source: data from ISL (2021).
to have another case of successful growth!
We will try next a comparative analysis between China and India.
Part V: India versus China
As shown, (Figure 13), as far as India’s imports2016 is concerned, they reached Europe2018 and China2020! Then, India’s imports fell from 225 m tons2016 to near 1502020!
India2017-2018 surpassed Japan, which showed remarkably steady imports round the 175 m tons2013-2019. So, India has the background in imports to “claim” from Europe an increased share or role. But, imports do not create growth, as much as this is done by Exports, as mentioned!
India2006-2007 indeed exported goods valued $120b and $145b respectively, but these were much behind China’s exports, which reached $969b and $1218b! More perhaps important is that the $ exports of China were below the $ value of its imports (=$791b and $956b). Moreover, China2007 achieved 26% annual growth in its $ exports, while India achieved 20%.
Table 1 summarized the records achieved by China and India in the production of certain selected commodities.
Figure 14 shows the dependence2016-20 of China and India on global crude oil and oil products.
As shown, China2020 imported 2.73 times more crude oil than India (557 m. tons vis-à-vis 204) and 1.82 times more oil products (82 vis-à-vis 45 m tons) than India.
4. Concluding Remarks
All countries—or certain of them—producing/exporting “coal, oil, gas, iron ore & steel”, will continue to “blackmail” the rest of the world! Steel and cement are
![]()
Figure 13. Imports by Sea by 5 countries/areas, plus others, 2011-2020. Source: modified from that in ISL (2021).
![]()
Figure 14. Imports by China and India of Crude oil and Oil products, 2016-2020, in million tons. Source: data from ISL (2021).
![]()
Table 1. Performance of China and India in Production of selected commodities, 2020.
required par excellence… for industrial development! As far as the fossil fuels is concerned, the 47% of them appeared2008 in the carriage of trade by sea, something, which was very bad for climate then and today!
The World nowadays is seriously concerned with a number of crucial challenges:
• From Climate—in the form of fires, floods, drains, cyclones, etc. and of course deaths of humans, of animals and of plantations, costing also an unknown, but considerable, $ amount. Economists, and not only, consider now, what is preferable: “a precaution or a cure?” Humans seem systematically to destroy their own and unique planet by “burning” their forests in Australia, Canada, USA, Spain, Greece, and elsewhere! Our children are going to ask us: “What my Father have you done to protect environment?”
• From God, in a pedagogical fashion—causing 1 Pandemic for the time being, several earthquakes (in Turkey, Hawaii, Afghanistan and elsewhere), several local wars, famines all of which caused million deaths and vast $ expenditures.
• From Russia, concerning Ukraine—this being really a semi-world war of NATO against Russia—costing an unknown number of lives so far, houses, roads, bridges, etc., and an unknown amount of b$—perhaps over $300b—in the form of military aid. We may add here the recent rapid local war in Armenia and the recent war between Palestine and IsraelOct.2023! World leaders seem not to care about worldwide peace…
• From the increase in the cost of energy due to higher prices in oil and gas, and as result the increase in the cost of electric power, due to R-U war, of unknown total cost so far for humanity.
• From the “revenge” of the people, whose countries are in civil war, or in extreme poverty, or under dictatorships, “having to” export millions of migrants to the peaceful countries of the EU-28, and particularly to Germany, Italy and France, with thousands of women and children as well men to be destined to die in the Med. and the Aegean Seas!
The recent summit in GranadaOct.2023 for migration, led nowhere, and this inertia of Europe-28 is going to punish it. In my mind this apathy of EU-28, and the different opinions of Poland and Hungary over accepting migrants, are difficult to be understood. The dangers of migration are common for the entire EU-28.
EU-28 had to face the migration problem centrally, we believe, by establishing a “migration central office” in Brussels, and receiving applications from migrants, but accepting certain of them only in accordance with the specific needs of the EU-28 economies. These needs will have to be filled-in in advance. No other migrant will be allowed, by having the UN forces in the migration countries, as this is a kind of a super-war, to prevent departures.
Thus, migration has to stop at the countries of departure, not at EU-28 seas and borders, we believe! The above task, at the departure spots, however, is not to be undertaken by the migration countries, and no money to be given to them or to nongovernmental organizations, and also no police “Frontex” will be needed in the borders. EU-28, then, to charter airplanes for every migrant missing a work permit, and arriving in EU-28 illegally, to be returned back to his/her country of origin.
The wise modern economies—no doubt—have to care to “provide” the means to every mature citizen: a proper paid job, a low-priced house and an electric car, and a green city as much as possible to start with! Economists must seek for the welfare of their citizens and not for the welfare of their numbers!
If the above is accomplished by any China or any India, then the international roads, whether silky or golden or bronze to be only then attempted afterwards…! The task is for the welfare, education, health and safety to country’s own citizens by priority than to the international ones!
If Russia did not attack2022 Ukraine, the efforts of the World, and of the EU-28, to stop the above mentioned climatic revenge, would have applied faster, even with the supply of the gas—supplied by Russia, we believe.
Great economies like Germany—and not only, but even the small ones, like Greece—“stayed or returned” to the use of Coal/Lignite/Nuclear power11, and other fossil fuels, till the disengagement achieved from the Russian gas… A course that requires a generation, we believe!
Important are the emerging new material matters like lithium, to manufacture mega-batteries, also the semi-conductors, and the solar panels. A part of the near future lies in producing and storing energy, the cheapest possible way, as the energy needs—economists failed to introduce energy, as the 4th coefficient of production in the production function(!)—will go-up on rising much faster than the growth rate of the world economy!
Important is the following part, which follows, where economies must study it carefully because it will change their entire infrastructure the way we know it!
Produce energy the way Sun does?
Myopic humans looked at the universe—with the latest telescopes—but they did not see the “way Sun produces energy”—till recently (Scan 5)! Instead of NASA looking for life in space—which we believe does not exist—it is better to copy Sun in producing non radioactive energy using lithium!
The Americans succeeded—for the 2nd time, in less than a yearDec.2022-30-07-23, in producing 1.65 times12 more energy than spent, leading eventually to abundant green energy, in a nuclear fusion experiment, using deuterium and tritium. This endeavor focuses on producing energy by a controlled thermonuclear fusion reaction, where 2 nuclei are combined to form a new one, within a plasma, which is made from enough hot gases so to free electrons from their atomic nuclei!
A powerful laser producing machine—as that shown in Scan 5—can focus 192 laser-bundles on to a small capsule, containing the above mentioned hydrogen isotopes. The idea is to achieve extreme temperatures and very high pressures on them, so that to produce helium and to release energy in vast quantities, following Einstein’s formula: E = mc2.
![]()
Scan 5. Production of energy in the National Laboratory “Lawrence Livermore—LLNL” California/20/08/2023. Source: modified from that in a Greek Sunday Magazine.
Can China or India do the above and be able to export it? This is the 1m dollars question! The future King13 in all economies will be that company—given that companies do the research at the moment—selling a system at reasonable price, and maintenance, of producing energy at home/factory level… the way Sun does it for centuries!
The photovoltaic systems will be on great demand in the meantime, together with all known and… unknown fuels… the presence of which is expected/ wished to be falling—if fossil. The “Gifts of Nature” had to be distributed, however—at their cost of extraction etc. plus a rational profit to those in need.
5. Conclusion
Most, if not all, prospective shipbuilding countries—including India, Japan and S Korea—committed the mistake to build cheaper, (with national aid, subsidies, etc.), ships exclusively for their… non-competitive ship-owners! This has to change, we believe!
As far as China’s Silk Road and the Economic Corridor of India are concerned, we believe, that this is a fight between another Goliath (China) and a modern David (India), where this time Goliath is going to win… unless it will withdraw from the fight—given that certain nations cannot repay their $ loans to him (China)!
India—in order to play a greater economic role, as it wishes—has to export more than it imports. If a country has a lower labor cost and lower export CIF prices than its competitors, this only is going to work positively so that export-led growth policies to be further pursued. The devaluation of the national currency may help… in such situations, if allowed by IMF. Economic focus must be also on building the required infrastructure for transport, such as roads and railways (one is planned by India in W Asia).
There is the question for further research however: “Do economists suggest to all countries to create a positive trade balance?” Nowadays, countries like China, Australia, Germany, and Ireland, by having positive trade balances, seem to be economically stronger, but indirectly they depend on those demanding their products…
As a result, countries with strong $ imports like USA and EU-28, may design their future international cooperation in a way to import products from the nearest countries, at the best quality and at lower CIF prices! These countries only are worthing the aid from the stronger. The idea to help 154 countries in the world perhaps is not only economic.
India is going to continue to look forward to its relations with France in matters of defense and also in nuclear energy. France looks also after 1 m people–economically/military—living in the “Reunion” and “Mayotte” islands. Also, close relationship exists between India and Germany in trade, science and technology. UK also has maintained a “special relationship” with India since centuries ago. Ireland is also added together with Greece for its port of Salonika.
But Europe-28 looks after a “Gujarat—like” policy so that foreign business, trade and investment to be facilitated following the FTA (BTIA) or “EU-India Free Trade agreement”. India requires 4 targets to achieve ( Sen, 2006 ; for those who want to understand the mentality of India’s people)!
There is also the Indian Ocean and the freedom of navigation given the issues there of maritime security and piracy, which interests UK and France as well as EU-28. India established the “new development bank” (in BRICS); it is a member of the “Shanghai Co-op Organization”, and a founder of the “Asian Infrastructure Investment Bank” plus China, and EU-14. Are, however, the above adequate so that India to excel with its IEC?
NOTES
1 Stopford (2009: p. 384) added the speed, size and type of vessels.
2This is a policy of no intervention of governments in the trade between countries. But, trade has to follow the comparative advantage and the division of labor. This is believed to achieve the most efficient allocation of resources. Reasons, like those of national defense, social, economic (the infant industry argument), optimum tariffs and pauper labor, often prevented “free trade”!
3Fertile land—ready or made—using the digital agriculture etc., oil, coal, gas, lng/lpg, ammonia, hydrogen, etc., new material matters, forests, rivers, lakes, winds, rainfall, oceans, sunlight etc.
4This strategy has to be organized in a better way than hitherto by instituting e.g., rewards to persons contributing—in their work—in reducing the cost of production…
5Including: “W & E Europe”, “Russia & the rest of Europe”: 21% - 26%, “America” 19% - 20%, “W & N Africa”: 4% - 6%.
6Figures are taken from Stopford (2009: p. 349) , where the exports from the Atlantic area were 3389 million tons and the imports were 3787 (7176). From the Pacific & Indian Oceans exports were 3720 and 3335 were the imports (7055). Maritime Asia exported 1641 million tons (23%) and imported 2963 (41%).
7Taking into account Venezuela, Brazil & Argentina, having more than 300 m people, 558 mt exports2005 and 153 mt imports. Brazil is well known for its iron-ore!
8Taking into account Japan, the remaining Asian countries and those of the S.E. Asia.
9This is a case where an organization—here we extended it to countries—brings first to market an innovative product or brings a new innovative process (Robbins & Coulter, 2018: p. 331) .
10However, if India used fusion to produce energy, it would need only 72 pickup trucks per year (!), as mentioned in the concluding remarks.
11Europe is witnessed to reduce dependence on nuclear energy by 2023.
12The target is for 10 or even 100 times (https://lasers.llnl.gov/science/energy-for-the-future).
13A pickup truck filled with fusion fuel will provide energy of 2 m metric tons of coal or 10 m barrels of oil https://www.energy.gov/science/doc-explainsfusion-energy-science.