Assessing Forest Cover Distribution, Species Diversity, and Richness of the Buffer Zone for Strategic Forest Management Planning for Nimule National Park, South Sudan ()
1. Introduction
Forest ecosystems are habitats for many plants and animals due to the fact that they provide suitable environments for them. Studies show that, worldwide, biodiversity is substantially higher inside than outside well-managed terrestrial reserves [1] because protected areas reduce the loss and degradation of natural habitats [2] and slow the rate of extinction of threatened species that occur therein [3] [4] . Worldwide, forests cover nearly one-third of the land area and they contain over 80% of terrestrial biodiversity [5] . Forest habitat continues to decrease in cover and quality and the associated loss of biodiversity tends to jeopardize the ability of the forest ecosystem to function and the continuous provision of ecosystem services [2] [6] .
The income of more than 1.6 billion people depends on forests and sustainable management of forests can contribute to sustainable development, poverty eradication, and the achievement of internationally agreed development goals [5] . Notwithstanding increasing efforts for sustainable forest management and forest conservation [6] , the extent of forest habitat degradation and destruction, especially in the tropics, continues to increase, primarily through forest conversion to agriculture, livestock grazing, and other land uses related to urban population growth [7] [8] .
Wildlife is threatened by many factors, of which habitat conversion to other uses (such as agriculture and urban development) and human (over) exploitation are best known and most notorious. According to the World Conservation Monitoring Center [9] [10] , of 486 documented extinctions since 1600, 80 have resulted from hunting, and 98 have resulted from habitat destruction. Over-exploitation, usually combined with habitat destruction, is believed to threaten about one-third of the world’s endangered mammals and birds [11] . The significance of the relationship between human beings and forest reserves has been increasing as a result of the conflict of the tremendous increase in population growth and crucial pressure on natural resources. Over the years, the forest has been a continuous source of fuelwood, charcoal, wild fruits collection, and land for agricultural purposes that have led to present depletion [12] [13] .
Deforestation and forest fragmentation are however among the main components of global change [14] and both contribute to the rapid loss of tropical forest areas with important implications for ecosystem functioning and biodiversity conservation [15] . Deforestation not only reduces forest area but also brings about changes in the forest structure hence, habitat quality. It also has thus direct linkage to loss of ecosystem services [16] and to species extinctions, besides enhanced emission of CO2 and other greenhouse gases [17] .
Deforestation reduces forest area and increases fragmentation which in turn increases habitat isolation and edge effects [18] , as a result, it limits the available resources needed to maintain local populations, presenting barriers that some species are unable to cross, and influencing species interactions. Habitat loss and fragmentation, therefore intensify the effects of genetic drift and endogamy, reducing genetic variability of populations with serious consequences for wildlife conservation. Several policy frameworks emphasize that habitat conservation and restoration should contribute simultaneously to biodiversity conservation and climate change mitigation [19] . These frameworks include the UN Sustainable Development Goals (SDGs), decisions under the United Nations Framework Convention on Climate Change (UNFCCC), and the Convention on Biological Diversity (CBD). As such, forest conservation is a crucial mechanism for forest management toward curbing biodiversity loss and climate change mitigation [17] .
Knowledge of the floristic composition, structure, and conservation status of tropical forests is essential for sustainable management and conservation, although this remains poorly documented in some tropical countries [20] .
Tropical rainforests enjoy a unique reputation for their contributions to biodiversity conservation, climate stability, and human wellbeing, globally [21] . Understanding the floristic composition and structure of tropical rainforest ecosystems, including their diversity patterns and conservation status, is thus important for evaluating their sustainability [22] [23] . and resilience. Such studies can also provide useful information on forest stability, growth patterns, and regeneration processes required for conservation planning, monitoring, and management [24] [25] [26] .
Tropical forests are the habitat of numerous species of living things that constitute biodiversity through webs of life [27] . The natural forest cover of Sudan in which South Sudan is part of, is generally poor, sparse, and scanty vegetation due to its location in such an arid environment outside the riverine zones, except along the Nile banks and watercourses where ephemeral herbs and grasses occur after the short rainy seasons [13] [28] .
Nimule National Park (NNP) is a government and community park in South Sudan managed by the Wildlife Authority to conserve biodiversity and the environment. It is one of the oldest protected areas in the country established in 1935, first as a game reserve to protect the white rhino (Ceratotherium simium), and later in 1954, it was upgraded to a National Park with the key objective to protect other wild animals. The most important animals in the park include black rhinos, elephants (Loxondonta africana), hippopotamus (Hippopotamus amphibious), and Uganda kob (Kobus kob), among others [29] . The park is a suitable habitat for a range of vegetation types and games and is home to a number of breeding and migratory birds. it is surrounded by a sea of agricultural, human settlements and naturally rugged hills with water courses interspersed within the landscape. The White Nile forms the eastern border of the park, which is characterized by steep banks with many rapids and falls of which the Fulla Falls is the largest. On the Eastern side, beyond the Nile, the park is bordered by the buffer zone.
The Buffer Zone is an important area purposely set apart to conserve biodiversity and to act as a buffer between wild animals and agricultural areas and as a safeguard against game proximity to human settlements, hence it reduces human-wildlife conflicts and poaching in the area. The zone is thus part of the National Park and covers an area of 144 kilometers squared and it falls between the River Nile and Juba-Nimule road, which starts from Onyama Bridge and ends at Aswa Bridge and the Aswa-Nile confluence [30] . Arbitrary accessibility is not allowed within the buffer zone except for a few privileges given to the local people, such as the collection of water and dry firewood, which is usually done under a guarded escort.
The zone has a diversity of vegetation types mainly influenced by climate, the nature of the parental rock, relief, and drainage, but generally, the vegetation within the park falls within the woodland savanna category [31] . The quantification of tree species diversity is an essential aspect as it provides resources for many species [32] .
The vegetation of the buffer zone is essential for the sustainable existence of many wild animals in the park; however, its existence is threatened by a number of harmful factors, and as a consequence, it is undergoing serious degradation. The long civil unrest in the country is portrayed as the main destructive component, which has come with it a host of problems such as increased immigration of humans and their animals into the area consequently leading to settlement, hence bush burning and illicit cutting of trees and grass for building, firewood, and drying of fish as well as human-wildlife conflicts, the magnitude of which is reported to be with elephants [30] [33] . There has also been a breakdown of rules and regulations governing the park augmenting grazing of domesticated animals like cattle, goats, and sheep in the buffer zone area.
The upshots of these actions coupled with limited information classifying and mapping vegetation as well as describing habitat type, which is very important in providing technical skills for managing wildlife resources and understanding the natural and man-made environments through quantifying vegetation cover from local scales at a given time point or over a continuous period [34] . In this regard, an inventory was carried out to assess the forest resources of the buffer zone as they are influenced by the various parental rock (soils) elevations, Soil conditions here are highly variable, depending on subzone elevations, bedrock, and climate [35] , and drainage systems to set a base to develop a management plan for sustained conservation of the forest resource base in order to avoid endangering and extinction of the local wildlife species in the Park [34] .
1.1. Objectives
The main objective of this study is to conduct an inventory for easy development of a management plan for the Buffer Zone Forest Reserve for sustained conservation of the flora and fauna of Nimule National Park.
1.2. Specific Objectives
1) To identify the main tree and shrub species that inhabited the Buffer Zone Forest Reserve.
2) To assess the composition, distribution, and abundance of the various tree/shrub species in the subzones.
3) To determine the species diversity, species richness, and their parametric performance in terms of basal areas and volumes per plot and hectare in the various subzones.
2. Materials and Methods
2.1. The Study Area
Nimule National Park is found in Nimule, Eastern Equatoria State at the Uganda-South Sudan border, it falls within latitude 31˚48'E-32˚2'E and Longitude 3˚19'N-3˚35'N (Figure 1). The park has an elevation ranging from 500 - 800 meters above sea level, which is influenced by its natural boundaries of rugged hills and water courses that are interspaced within the landscape. The White Nile forms the boundary between the park and the buffer zone while other drainage features include River Anyama in the south, River Kayo in the north, and River Aswa in the northeast. The western part of the park is bordered by the Illungu hills which run along the South Sudan-Uganda border (Figure 1). Nimule generally sits on an Achaean basement complex whose formation dates back to the pre-Cambrian era which has resulted in a lateritic soil in the area that is an extension of the ironstone plateau [31] .
Nimule Buffer Zone experiences a tropical continental climate regime which is typical for much of South Sudan. Rainfall in the region is localized and highly variable with an annual range of 800 - 1000 mm, where much of it falls during the wet season from April - November. The landscape is generally hot with an average daily temperature of 27˚C and a maximum of 29˚C in March which is the hottest month [13] [36] .
On the whole, the zone has three broad vegetation types which include savannah wooded grassland, the riverine woodland vegetation, and some Borassus aethiopium, and Acacia seyal that occur along the permanent rivers and streams [30] [33] . The area is interspaced by pockets of wetland dominated by grasses, sedges, and reeds, which form an important dry season habitat and food for the extant megaherbivores and a number of wildlife species, and their reduction, in the zone may have a serious impact on the diversity and distribution of some wildlife species.
![]()
Figure 1. Map of Nimule National Park showing the study location: (Source: [30] ).
2.2. Field Research Design
The study examined the forest resources in five subzones, which were selected based on parental rock (soil), elevation contours, water drainage system, and human disturbances in the buffer zone namely, the lower area on the eastern deposition side of the Nile; lower area on the western erosion side of the Nile; the flat plain area around the Administration offices of Nimule National Park; the slopes of Gordon hill and the top of Gordon hill. The study follows a systematic sampling approach used to collect vegetation data from the study site by layout of transect lines. Circular sample plots were established along these transect lines based on the total survey area in question. The distance between plots is 100 m whereas the distance between one transect and another is approximately 50 m. At least two transects and 20 sample plots were laid in each subzone. These subzones are speculated to influence the drainage system, which in turn has an influence on the soil characteristics of the area. These features are also hypothesized to have a great influence on species types (richness), distribution, and abundance, which can also have an influence on the kinds of animals inhabiting them.
The study thus involves carrying out a thorough inventory of vegetation cover parameters in the buffer zone forest to identify the diversity of tree/shrub species, their distribution, richness, and assemblage (abundance) in the various elevations/subzones as follows:
1) Subzone A: Deposition side of the River Nile;
2) Subzone B: Lowland western bank/Erosion side of the River Nile;
3) Subzone C: Administration Offices;
4) Subzone D: Slopes of Gordon hills and;
5) Subzone E: Top of Gordon hills.
2.3. Data Collection and Methods of Analysis
The inventory involved collecting qualitative and quantitative data of just one hectare of forest resources in each of the five elevations using a cluster sampling method allocated randomly to determine the performance of the forest stands as well as to help in drawing up the management plan for the whole buffer zone reserve forest. According to preliminary surveillance carried out within the buffer zone, there was heterogeneity observed among tree and shrub species of the forest resources in the area, which could be attributed to bushfires, pests and diseases, and human and animal destruction, especially by elephants.
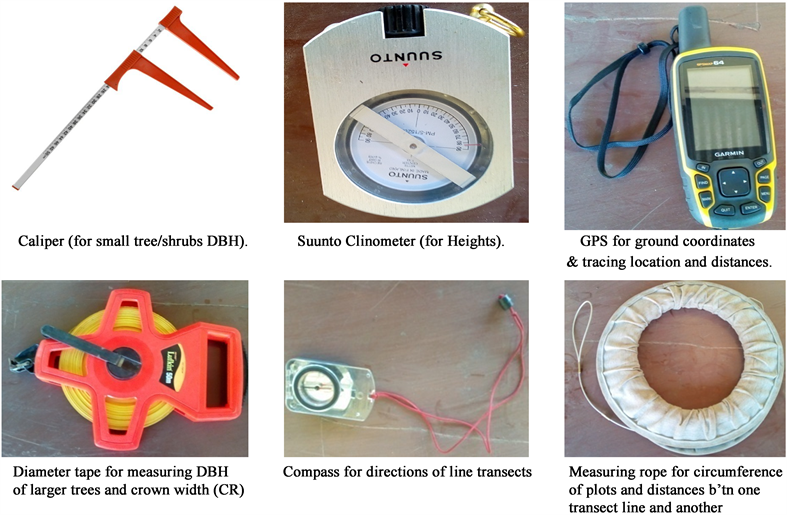
In the inventory work, edge defects were avoided by selecting the first sample plot in the center of the lower area of the subzone on the eastern deposition side of the River Nile. The center of the plot was located and on which a peg was placed. GPS readings of the location, as well as the elevation point above sea level, were taken and recorded. A measuring tape was then used to measure a radius of 17.85 m, suitable for natural forest stands, which was run all around the perimeter of the plot to form a circular sample plot in order to determine sample trees that fall within the plot. The trees/shrubs situated within the plot were marked with some spray paint to await measurement. The heights (H) of each marked tree were then measured, which was carried out, first, by using a measuring tape a distance of 20 m from the tree base in any direction taken where the growing tip of the tree could be seen; then using a Sunnto clinometer, the height readings of the tree was taken and recorded. The diameters of the marked trees were then taken at breast height (DBH); this was done using either a vernier caliper (for small trees/shrubs) or a diameter tape (for larger trees/shrubs) depending on the size of the diameter. If the diameter of the tree/shrub is above 5 cm and does not exceed the calibrated caliper readings, a caliper can be used, but if the diameter of the tree is more than the caliper reading calibrated, a diameter tape is used to measure the tree diameter which is then recorded [37] . In this inventory, only a tree/shrub measuring DBH and height of at least 5 cm or greater (≥5 cm) and 3 m or above ((≥3 m) respectively is subjected to measurement. A tree/shrub whose DBH is found within the sample plot and whose crown trunk falls outside the plot is not subjected to measurement, and vice versa. As such, in the circular sample plots, a sampling intensity of 10% was used. Therefore, the radius was calculated from the 10 percent hectare, giving a radius of 17.85 m as indicated in the formula below.
10% Hectare = 0.1 × 100,000 m2 = 10,000 m2
10% of 10,000 m2 = 1000 m2
The data analysis involves manipulation of the plant species variables and parameters in Excel spreadsheet and/or SPSS software using many formulae. Variables and parameters studied in this investigation included tree heights (m), diameters at breast height dbh (cm), basal areas (m2), and volume (m3) while the parameters examined included average Diameter at Breast Height DBH, mean height, Basal area per hectare (m2/ha), Volume per hectare (m3/ha) and Density per hectare. This procedure for obtaining subsequent variables above was repeated for all the samples selected randomly in each of the identified clusters in the buffer zone. The following major formulae specified in the equations were then used for calculating the various parameters in the various subzones of the buffer zone forest reserve:
i) Basal area/tree (BA) =
(1)
ii) Basal area/plot =
. (2)
iii) Average basal area/Plot =
. Where N is the number of plots in the block (3)
iv) Average Height per plot (H') =
. Where N is the number of trees in a sample plot. (4)
v) Average Basal area/hectare =
. Where plot Area (A) = pr2 (5)
vi) Volume/tree =
. Where F.F is form factor of natural forest which is between (1.3 - 1.6), i.e.
(6)
vii) Volume/Plot =
. Where n is the number of trees in the block. (7)
viii) Average No. of trees/whole block =
. Where N is the number of sample plots. (8)
ix) Average no. of trees/ha =
(9)
x) Density =
(10)
xi) Standard Deviation (SD) =
. Where N is no. of Plots/block. (11)
xii) Standard Error (Se) =
. Where n is the number of sample plots/block. (12)
xiiii) Coefficient of Variation (C.V.) % =
. Where, X is the mean of the volume. (13)
To evaluate the stand composition, species richness and abundance were used. The tree species richness was computed through frequency counts or tallying for all existing species, and species abundance was determined by a simple count of frequencies of individuals of all the different species, whereas species diversity was calculated using the Shannon-Weiner diversity index, Simpson dominance index, and relative abundance or density (%) using the following formulae [37] [38] :
(14)
(15)
where,
S = number of species.
N = Total number of individuals.
n = individuals of one particular species.
Pi = the proportion of n divided by N (n/N).
∑ = summation of
H' = Diversity index =
Hmax = (LnS).
Evenness or Abundance (E) = H/Hmax. (16)
Species richness or variety index (d) was determined by the formula adopted from [39] as follows:
Species richness (d) =
(17)
Relative Density (%): The percentage of each species of tree/shrub was computed as follows:
(18)
where, n = individuals of one particular species, N = Total number of individuals.
3. Results and Discussion
3.1. The Floristic Growth and Productivity Performance Variables and Parameters in the Five Assessed Subzones
The study involved 834 trees/shrubs encountered within 100 circular sampled plots along transects established in the buffer zone represented by five subzones/elevations namely, A to E. Results of the computed variables and parameters of the inventory conducted on the number of trees/shrubs evaluated in the various elevations indicate that the highest number of trees/shrubs were obtained in elevation B followed by D, E, and C while the least number of trees were found in elevation A (Table 1). This shows that although the deposition side “A” of the River Nile has fertile soils which might have resulted from silt deposition and humus accumulation, trees that grow in this area are fewer but bigger in sizes with heavy crowns which might not have allowed the growth of other trees/shrubs species in their understory other than shade tolerant grasses, which were not evaluated in this study. The results are supported by the mean diameters at breast height and tree heights as well as basal area per block, which are higher in elevation A compared to the other elevations. Although elevation D has many trees compared to C and E, it shows the least basal area per block which indicates that most of the trees/shrubs found at this level were smaller sizes, which is supported by the mean diameter at breast height as well as tree heights. The overall mean densities of the trees/shrubs among the various elevations is 0.83 indicating that elevation A has the lower density (0.06) while elevations B, D, and E have higher densities of (0.22), (0.2), and (0.2) tons/ha respectively (Table 2), with the highest and almost similar densities which might be attributed to favorable conditions for the growth of diverse trees/shrubs species [20] .
Mean Basal area per hectare shows significant variance in almost all parameters, with elevation A showing the highest value followed by E, B, and C while elevation D had the least basal area per hectare compared to the other elevations,
![]()
Table 1. Summary statistics of outcome variables and parameters obtained in the five surveyed subzones
![]()
Table 2. Descriptive statistics showing growth and productivity performance of species in the five evaluated subzones (A, B, C, D, and E) of Nimule Buffer Zone Forest Reserve.
which indicates that this area is mostly inhabited and dominated by a diversity of smaller trees/shrubs hence, smaller diameters and heights, which corresponds with the higher coefficient of variation (CV), 539.7% (Table 2) and results also given in Figure 5 that has more than 14 diverse tree/shrub species show similarity. These results are reflected in the mean basal area per block, which indicates the variance of tree/shrub species as influenced by elevation and water drainage systems. The results depicted similar analyses of the study done by [40] as it falls within a specified range of 46.9 - 1460.8 (BA/plot) for Nimule Buffer zone. It is therefore noted that differences in the basal area (BA/ha) and volume per hectare (Vol/ha) among the subzones/elevations may be attributed to disparity in species composition, degree of natural and human disturbances, age of trees, and succession strategies of the stands [41] [42] . The pattern of species distribution of inventoried trees through dissimilar DBH classes also shows how well the growing forest is utilizing functional and structural resources [43] .
The standard deviation (SD) of the mean basal area per hectare for the five elevations indicates that there was considerably little deviation of basal area per hectare in elevation A compared to the other elevations, which could be attributed to similarity in site conditions, quantities of the diverse tree/shrub species as well as their diameters at breast heights and tree heights (Table 1). This is supported by results of the overall buffer zone, whereby the diverse tree/shrub species have more or less the same quantities with the exception of Acacia sieberiana which is mostly common and strives well in the deposition site and western bank of the Nile river. Results on volume show that elevation A has the highest mean volume per hectare followed by elevation E, while D, C, and B have more or less the same mean volume per hectare (Table 2). The results also indicated that the forest was characterized by an overall relatively low mean canopy and height (6.61 m) but with a large number of small-mean diameter trees (13.83 cm) as compared and supported by the findings of [44] .
Results on the volume of tree/shrub species considered as the average number of trees per sampled plot and per hectare respectively show that elevations B, D, and E, have the highest mean volume per plots sampled and per hectare with (21.80, 218.14), (20.20, 202.13), and (19.60, 196.13) respectively (Table 1). Subzones A and C have significantly lower average volumes (Number of trees) per plot and hectare as indicated by (5.90, 62.04) and (15.60, 156.10) respectively (Table 1). The lower volumes obtained could be due to anthropogenic activities, competition among the various species for nutrients under different climatic conditions, and environmental ability to adapt. Again, it could be due to small size trees that contributed to a decline in their parameters of DBH and H leading to low attainment of tree/shrub mean basal areas and thus lower volumes in some subzones. However, our study findings are in conjunction with other studies in arguing that the competitive ability of the species in question is expected to vary under different environmental and climatic conditions whose interspecific relationships among the identified species of trees/shrubs may vary differently in different other areas [45] [46] .
3.2. The Overall Trees/Shrub Species Composition, Abundance, and Distribution at Nimule Buffer Zone
Overall, the five surveyed sites were representative of about 18 families of tree/shrub species which are mostly dominated by the Fabaceae family (6 species). This was followed by Combretaceae (4 species), Rhamnaceae (3 species), and species from unknown families (3 species). There were also other families represented by at least 1 or 2 species such as Anacardiaceae, Bignoniaceae, Arecaceae, Moraceae, Malvaceae, and so on (Figure 8). The study also encountered 18 species categorically belonging to tree families, 6 belonging to shrub families, only 1 species of herb was identified, and 3 species are either considered tree or shrub species (Table 3). The results on the abundance and distribution of trees in the buffer zone indicate that the area is generally inhabited by more than 30 various trees/shrub species. However, in the computed tree/shrub frequencies and relative density, the most numerous species/families that dominated the inventoried sites were Combretum spp/Combretaceae (225, 27%); Cedrella spp./Meliaceae (132, 25%); Grewia mollis/Malvaceae (89, 12%), and Acacia Sieberiana/Fabaceae (79, 9.11%), which are followed by Zizphyus abysinica/Rhamnaceae (51, 6.12%), and Acacia seyal/Fabaceae (50, 6.0%) respectively (Figure 2).
The results further depicted that at least combretum spp and acacia spp were found across all the five subzones inventoried. There are also other varieties of species that are of smaller amounts which are distributed randomly in different formations or niches within the zone (Figure 2). The presence of such former variety of trees and shrub species indicates that the zone is rich in forest resources and hence inhabits a wealth of biodiversity which is favorable for national park recreational activities. The latter variety of species is considered to possess interrupted regeneration regimes underrepresented in some size classes, especially the middle-size classes, which is usually associated with illegal logging or selective exploitation for fuelwood, charcoal, poles and timber, and wild fruits [40] . It might however be detrimental in that, many products can be obtained from the area for use by local people, as a consequence, if not properly monitored, it might call for illegal felling and hunting, which might in turn encourage bush burning [47] . This is also in conformity with the study of [48] who established that tree/shrub species populaces are commonly impacted by the persistence and intensity of human activities influenced by their needs/use in India.
3.3. The Site-Specific Description of Species Composition, Abundance, and Distribution across the Five Subzones (A, B, C, D, and E) of Nimule Buffer Zone
Figure 3 shows the abundance and distribution of trees/shrub species evaluated
![]()
Figure 2. The overall composition, abundance, and distribution of trees/shrub species at Nimule Buffer Zone.
![]()
Figure 3. Tree/shrub species at the deposition site of the River Nile (Subzone A).
at the deposition side of the River Nile. Results indicate that the area is occupied by more than 12 species, which is highly dominated by about 45% Acacia sieberiana [49] followed by Tarmarindus indica (13.6%), which is less than a third (1/3) that of A. sieberiana with varieties of tree/shrubs species such Sclerocarya birrea (6.8%) and others that are found in smaller quantities of less than a fifth of that of A. sieberiana. This could be attributed to competition, especially for sunlight between the A. sieberiana and the few shade-tolerant species. The dense and overgrown canopy of the A. sieberiana could have covered and shaded other vegetation in the area, resulting in the death of non-shade tolerant species and stunted growth of the other existing understory tree/shrub species. It is therefore precise to conclude that most of the existing trees/shrubs growing in the area, other than the A. sieberiana are those that are only shade-tolerant species [50] .
Findings on trees/shrub species evaluated at the western side of the River Nile indicate that the site is inhabited by various types and quantities of trees/shrubs, but the area is mostly abundant of species of the Combretaceae family that formed about 35% [51] , which is followed by Ziziphus abysinica (22.5%), Acacia Sieberiana (13.3%), Acacia Senegal (9.2%) and Cedrela species (9.2%) in that order [52] . There are also other species of tree/shrub species found in the area but in smaller percentages (Figure 4). The site is where most of the erosion is taking place, as such analysis of vegetation indicates marked differences in vegetation cover and types as well as quantities compared to the deposition side. This
![]()
Figure 4. Tree/shrub species at the highland side of the western bank of the River Nile (Subzone B).
could be ascribed to the fact that the western side of the Nile has a unique soil structure and periodically attempts to retain its original soil although it is prone to erosion, as the vegetation growing in this area express more similar characteristics, unlike those on the deposition side of the Nile, on which much of the soil has been altered due to so much deposition of debris for so long time.
Results on the distribution and abundance of tree/shrub species in the Administration area show fewer varieties of tree/shrub species than in the other areas evaluated although the area is by far highly dominated by Cedrela spp. that represented more than 64% of vegetation cover [52] . This is followed by Combretum spp. with just about 22% cover, while there are also other varieties of tree/shrub species that are just in minor quantities such as acacia sieberiana (8%) while the rest form values that are negligible (Figure 5). This area is located near the settlement area and it is where the Wildlife Administration Office is built, so, it might have been plagued with recurrent human activities, such as felling, burning, fuelwood collection, and probably cultivation which might have altered the soil structure, hence the changes in vegetation types leaving less preferred species to regenerate/succession. This finding indicates that human activities have a profound impact on the vegetation cover of the area [24] [53] , which has resulted in Cedrella spp. being the most dominant species remaining [54] [55] .
On the lowland of Mt. Gordon (along Nimule-Juba road), the results on the abundance and distribution show that the area is highly populated by a variety of tree/shrub species but it is mostly dominated by Combretum spp [51] , occupying about 30% of vegetation cover, followed by others such as Cedrella spp., Grewia mollis, and Acacia polycantha [52] with about 17%, 14% and 13.8% cover respectively (Figure 6). The subzone is situated on the lower and steep side of
![]()
Figure 5. Tree/shrub species near the Wildlife Administration Office of Nimule National Park (Subzone C).
![]()
Figure 6. Tree/shrub species found at the Lowland/slope side of mountain Gordon (Subzone D).
the mountain/hill; as a result, the topography is fissured with irregular deep waterways running from the top of the mountain to the bottom, some of which are collection points for debris and water which allow the growth of a variety of large and small tree/shrub species.
Findings on tree/shrub species evaluated on top of Mt. Gordon are presented in Figure 7. Results show that the area is comprised of a diversity of tree/shrub species but the two most common and abundantly distributed with more than 70% vegetation cover were Grewia mollis and Combretum spp with about 40% and 33% respectively [52] . These results are also similar to those found by [51] and the report of [49] . However, Acacia seyal and Cedrella ssp. followed by about 10% and 8% cover respectively, while other tree/shrub species are available in smaller quantities of less than 5% (Figure 7).
3.4. Species Diversity Indices, Species Richness, and Their Floristic Description of the Buffer Zone
The inventory conducted measurement of tree girth (DBH), Heights as well as species identification/enumeration. The study encountered a total of 834 trees/shrubs measured within the 100 randomly sampled circular plots. The results on the species richness showed more than 31 different species of tree/shrubs (Table 3 & Table 4) from 18 different families, are distributed within the Buffer zone forest reserve with a species (variety) index of 1.073. The most diverse species were Combretum spp, Cedrella spp, Grawiya mollis, Acacia Sieberiana, Ziziphus abysinica, and Acacia seyal indicated by their higher relative densities and were dominantly inventoried separately reported by about 27%,
![]()
Figure 7. Tree/shrub species on the highland range of mountain Gordon site (Subzone E).
![]()
Figure 8. Representation of important families of tree/shrub species identified in all the five subzones/sites.
![]()
Table 3. List showing species richness of trees, shrubs, and herbs identified in the surveyed Nimule buffer zone
![]()
Table 4. The overall species diversity and their floristic family description at Nimule Buffer zone.
D = Simpson’s Dominance Index, H' = Shannon-Weiner index, and E = Species evenness or abundance. n = number or frequency of individual trees/shrubs measured, RD = relative density (%), N = total number of trees (sampled trees).
16%, 10%, 9%, 6.1%, and 6% respectively (Table 4).
Based on individual sites, the analyses show that subzones D and A had higher values of Shannon-Weiner (2.352 & 2.288) and Simpson’s dominance (0.878 & 0.870) indices respectively (Figure 9), similarly their species evenness. This is followed by moderate indices in subzones B and E, whereas subzone C has the lowest values of Shannon-Weiner, Simpson’s dominance indices, and species evenness of 1.464, 0.717, and 0.704 respectively (Figure 9). Subzone C also indicates the lowest species richness (only 7 species identified). However, the overall average Shannon-Weiner (H') diversity and Simpson’s dominance (D) indices of the five subzones (whole buffer zone) computed were 2.507 and 0.871 respectively (Table 4). This diversity and dominance indices varied with ecological location depending on the species' site adaptability [13] . However, in the inventoried data, the results indicated that the computed indices lie between the general limit of 1.5 - 3.5 which is moderate meaning the overall species/shrubs found within the Buffer zone are moderately diverse [37] . Also, a study by [56] reiterates that when Shannon-Weiner indices are calculated and the values fall between 1.5 and 3.5, the species/shrubs are said to be moderately diverse within that community. Therefore, our study having obtained similar findings is in conformity with those previous studies.
The findings on the evenness, E (abundance) further show the average of 0.840 which lies between 0 and 1 reflecting relative evenness in tree/shrub species distribution and thus, more or less comparable among the surveyed subzones (Table 4). Furthermore, the evenness (0.840) is comparable with those
![]()
Figure 9. Tree/shrubs species diversity index values of Shannon-Weiner (H'), Simpson’s dominance (D), and species evenness (E) for the five inventoried sites (subzones) of Nimule Buffer zone.
recorded in Uluguru forests [57] , tropical evergreen forests [58] , and wet evergreen forests [59] . The findings of our study are also in consensus with those of [37] and [60] who argue that when species evenness value is varied between 0 - 1, it is therefore worth mentioning its abundance among the ecological zones inventoried as the higher evenness indicates more consistency in species distribution [43] .
4. Conclusion
The study evaluated the performance of tree/shrub species in the five subzones of Nimule Buffer zone by employing a non-destructive forestry inventory approach. Out of 18 families of tree/shrub species, three (3) were dominant at the sites including the Fabaceae, Combretaceae, and Rhamnaceae families respectively. The buffer zone plant diversity, richness, and abundance were generally found to be moderate with over 31 species richness, and 834 trees/shrubs were encountered. The average diversity indices H', D, and abundance (E) were 2.507, 0.871, and 0.840 respectively, where H' lies between 1.5 and 3.5, while D and E values both lie between 0 and 1 show that trees/shrubs species inventoried were moderately diverse and abundant. This apparently indicated that most vegetation were young and maturing, or persistently being subjected to anthropogenic disturbance through deforestation and degradation by both human and grazing animals (wild and domestic) that had fetched changes in their ecological adaptability, influencing their species distribution. The study witnessed non-existence of large trees/shrubs undergoing a natural regeneration process in the zones. The relative densities indicated the sites/zones were mostly dominated by Combretum spp, Cedrella spp, Grewia mollis, and Acacia spp. In general, highland zones are categorically suitable for the growth of Combretum spp, Cedrella spp, and Grewia mollis, while lowland zones are majorly occupied by Acacia spp and other minor species. The mean tree/shrub DBH, height, and density of 13.83 cm, 6.61 m, and 0.83 tons/ha respectively, were found to show low values among the subzones. On the other hand, although mean Basal area and Volume per hectare show significantly higher values of 3252.74 m2/ha and 46,540.82 m3/ha respectively, most trees/shrubs found at this level were superficially smaller sizes, as supported by the low diameters at breast height as well as their heights. Our study thus concluded that although the buffer zone forest reserve is relatively rich in species, they are exposed to unfavorable growth conditions for diverse trees/shrub species. This might have been caused by overexploitation, effects of climate change, edaphic factors, extensive wildlife browsing, and other anthropogenic activities such as illicit logging, unprotected bushing burning, overgrazing, and encroachments causing some species to be at risk of extinction. Therefore, to improve the quality of vegetation cover of the buffer zone, this study recommends for effective delivery of extension services, training of relevant stakeholders and engagement, strict follow of forestry and wildlife regulatory frameworks as well as emphasis on joint participation and conservation efforts of the community, government, and other stakeholders.
5. Policy Implications/Recommendations and Areas for Future Research
Increased human and animal populations, land degradation, human encroachment (settlement), livestock grazing, illicit felling, uncontrolled burning, lack of knowledge of species distribution, inventory, and lack of management plan are some attributes of loss of vegetation cover in Nimule Buffer zone. Loss of riverine vegetation below the Fulla Falls could lead to the local extinction of important trees/shrubs and even wild animal species. In the surveyed landscape (zones), wildlife damage was key that appeared to be widespread in most sampled plots involving many species but the magnitude of damage caused by elephants was reportedly greater.
According to the data log of incidents in affected villages, elephants’ damage incidents were found to be occasional and temporal in nature but larger in scale. The observed negative and hostile attitude of communities towards forest conservation and management could be a sign of frustration due to the effects of continuous human-wildlife conflict, the ineffectiveness of traditional methods used to control elephant damage, and perceived government ownership of wildlife and forest sectors. As long as elephants and local communities still depend on the extraction of forest products and vegetation cover in the buffer zone, the human-wildlife conflict will persist with massive destruction to land cover including loss of lives and properties, and destruction of farm crops due to encroachment and wildlife migration. This could lead to land degradation and climate change in the long run.
Although current conservation strategies focus on reducing illegal felling and encroachment, improving habitat quality, and mitigating human-wildlife conflict, developing effective land conservation strategies and forest management plans for the species in many range locations is difficult because there is no site-specific information on the species’ ecology and lack of joint community participation in conservation.
Therefore, because of this background, our study has drawn the following recommendations for various wildlife, forest, and protected area stakeholders: 1) There is a need for proper land use planning through schemes such as the transboundary management approach advanced by the Wildlife Conservation Society and forest management planning in the landscape should be promoted to enable the persistence of the species and conservation in Nimule National Park. 2) The generated value indices of Shannon-Weiner and Simpson’s dominance revealed the most important tree/shrub species in the subzones which are categorically distinguished from those that need to be ecologically prioritized for conservation to avoid extinction. 3) Moreso, the need for inevitable policy frameworks for legal provisions for forest and wildlife resource assessments, and species identification that are viable options for monitoring tree/shrub species performance, and promotion of recreational activities. 4) Nonetheless, there is a need for continuous inventory works and the relay of forest information systems through research, provision of extension services, and development of networking among forest initiatives and organizations. 5) Additionally, the need to protect the forest from illegal felling, bush burning, and encroachment through regularly patrolling the forest to avoid unnecessary exploitation and extraction of the forest resources that could lead to vegetation cover loss and land degradation. 6) Moreover, local governments should shape up a policy regarding land use plans in order to effectively allocate their valued resources and activities towards the protection of the buffer zone plant diversity. 7) Lastly, the study therefore emphasizes the need for adaptation and implementation of efficient management practices and conservational efforts to restore the already depleting buffer zone forest resources in Nimule National Park.
Data Availability
The data for this study can be found from the corresponding author and its availability to any interested consumer/person shall only be upon his/her direct request.
Acknowledgments
The finance solicited for the success of this study is two-fold, from individual contributions (authors) and yearly subscriptions of the University of Juba research funds to conduct final students' field trips. The authors would like to appreciate the efforts of the fourth and fifth-year students of the Department of Forestry Science, for their tireless participation and contributions during the survey and data collection phase. They also extend gratitude to Nimule Wildlife Administration/Authority for guidance and protection within the National Park during the survey. Nevertheless, the information from the local communities about their coexistence with wildlife within the buffer zone is also acknowledged. Lastly, the authors are indebted to the University of Juba, particularly the Department of Forestry, for granting this research opportunity and facilitation. Thank you all.
Appendices: Data Collection Tools and Team
1) Data collection tools
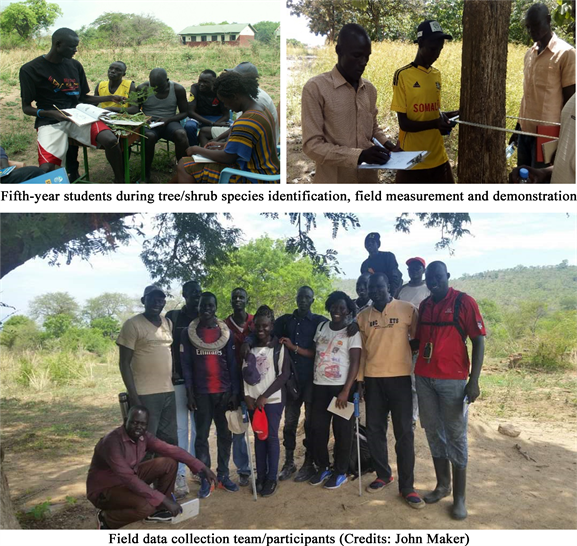
2) Field Data Collection Team