Could China’s Proactive Carbon Reduction Actions Bring New Investment Opportunities to the Stock Markets? ()
1. Introduction
While countries around the world are concerned about climate change and propose corresponding carbon emission reduction measures in response to the Paris Climate Agreement, an increasing number of investors are realizing that risks and opportunities from its systematic shifts have become apparent. China, as the world’s largest carbon emitter and second-largest economy, has actively participated in global climate cooperation and submitted its national voluntary emission reduction targets to the Secretariat of the United Nations Framework Convention on Climate Change. Consequently, tremendous investment opportunities may arise as China’s economic development mode gradually transforms into a low-carbon economic development model. Particularly, since General Secretary Xi announced at the 75th UN General Assembly on September 22, 2020, that “China will increase its Nationally Determined Contribution, adopt more powerful policies and measures, strive to peak carbon dioxide emissions before 2030, and aim for carbon neutrality before 2060,” the attention of many international investors has turned to China, which has seen significant achievements in the new energy sector in recent years, particularly in wind and solar energy. Institutional investors such as BlackRock, Aberdeen Standard, and Baillie Gifford have already invested in China’s new energy-related industries1.
Following the proposal of the Dual Carbon Targets (DCT) by the Chinese leader, all sectors of the government actively responded to the call by launching a series of relevant policies and measures aimed at promoting energy conservation and emission reduction by high-carbon emissions enterprises across the country. Appendix A lists several policy measures and events in response to the DCT, which demonstrates the Chinese government’s efforts to promote a transition to a low-carbon development model. As financial practitioners, we have reasons to believe that initiatives to mitigate carbon emissions in the context of China’s Dual Carbon Target will bring new investment opportunities for investors. On the one hand, green and low-carbon firms will receive more policy support at the national and local levels, and their eco-friendly products will be favored by consumers, particularly those enterprises with technologies that reduce greenhouse gases. On the other hand, the DCT’s introduction has significantly accelerated China’s economy’s shift towards a low-carbon model. Many carbon-intensive firms are now exposed to more stringent policy supervision risks (Carbone et al., 2021) . Additionally, with changing investor preferences (Giglio et al., 2021) , numerous assets may face the risk of becoming stranded after revaluation (Campiglio et al., 2023) . Under these circumstances, many investors urgently need to redirect their assets into low-carbon sectors to avoid or hedge against climate risks. In this context, new investment opportunities may arise in green and low-carbon assets. So, this paper aims to explore how China’s stock markets respond to climate risks and examine if the DCT’s introduction could bring new investment prospects for investors.
Our empirical findings reveal that the introduction of the DCT and the subsequent series of carbon mitigation actions have not significantly changed the risk-return profile of high-carbon assets. This indicates that investors who hold carbon-intensive equity assets face the risk of potential asset stranding but are not adequately compensated for the risk in China’s stock markets. Simultaneously, we examine low-carbon assets and discover statistically significant abnormal returns and an increase in their risks compared to the Pre-DCT period. This finding indicates the possibility of a “green premium” existing in China’s equity markets. Finally, to further investigate how investors could manage climate transition risks, we utilize the effective portfolio technique. Our findings indicate that amid the Chinese government’s proactive efforts to mitigate carbon emissions, an efficient portfolio will increase allocation towards low-carbon assets to achieve higher portfolio returns. This finding implies that portfolio decarbonization can contribute to investors in response to climate transition risks.
This paper contributes to the existing literature in two aspects. Firstly, this paper supplements previous empirical research on financial markets’ responses to the low-carbon transition, as well as the empirical evidence of green premiums in China’s equity market. Our findings can help investors in assessing portfolio decarbonization risks in China’s stock markets, and provide valuable insights for individual investors, fund managers, and institutional investors to comprehend the current changes in the risk-return profiles of high-carbon and low-carbon assets.
Secondly, we study the impact of proactive carbon emission reduction policies implemented by the Chinese government on the risk-return profile of high- and low-carbon assets. Our findings provide empirical evidence for policymakers to evaluate the impact of past carbon mitigation actions in the financial market and contribute to the follow-up of policies by policymakers to support a sustained and steady transition toward a low-carbon economy. Finally, our findings imply that China’s economy is presently in the process of transitioning to a low-carbon economy, necessitating policymakers to strengthen supervision of low-carbon related sectors to prevent the emergence and bursting of a “green bubble” during this process.
The remaining content in this paper is structured as follows: Section 2 presents a review of the related literature, while Section 3 details the methodology. Section 4 outlines the data and preliminary analysis, followed by Section 5 which presents the empirical results. Finally, Section 6 concludes and provides a brief discussion of the results.
2. Related Literature
The literature that closely relates to our research can be divided into three aspects. The first aspect is about the responses of financial markets to the low-carbon transition, i.e., the ongoing debate around the carbon premium and the green premium. The second is the application of portfolio analysis methods in the process of discovering and evaluating these premiums. The last is a brief overview of the event study methodology.
Firstly, the question of how financial markets react to the low-carbon transition is currently a topic of debate among scholars, with two prevailing views: the carbon premium and the green premium. According to Bolton and Kacperczyk (2020) , investing in carbon-intensive assets can achieve higher returns. This view is referred to as the “carbon risk premium” or “carbon premium” (Daumas, 2021) , which suggests that the current financial markets have effectively priced carbon emission risks. However, Görgen et al. (2020) argue that investing in low-carbon assets can yield higher returns instead. This view can be referred to as the “green premium” (Daumas, 2021) or “low-carbon premium” (Bernardini et al., 2021; Duan et al., 2020) and implies that current financial markets are inefficient and mispriced when it comes to assets related to climate risks (Daumas, 2021) .
The “Carbon premium” view holds that investors are at least partly factoring in the risks associated with compensating for fossil exposure by demanding higher premiums when purchasing assets (Daumas, 2021) . Many scholars have offered explanations for the existence of carbon premia on companies with high carbon emissions, including the risk of asset write-downs (Bernardini et al., 2021) , the threat of technology substitution from clean energy enterprises (Bolton & Kacperczyk, 2020) , and the risk of cash flow constraints (Zhang & Gregory-Allen, 2018) . Empirical evidence supporting the carbon premium argument shows that firms with greater total carbon emissions tend to yield higher returns, as found by (Bolton & Kacperczyk, 2020, 2021) .
However, the “Green premium” view argues that, on average, low-carbon assets generate superior investment returns compared to high-carbon assets (Ravina & Hentati Kaffel, 2019) . Thus, investors may earn higher returns by holding more low-carbon assets. Existing empirical testing of the green premium view can be classified in two ways. The first way involves examining market inefficiencies: low-carbon portfolios evaluated with classical asset pricing models outperform the market portfolio and exhibit saliently positive intercept terms (“alphas”), as shown by studies from Cheema-Fox et al. (2019) , Lautsi (2019) , and Daumas (2021) . The second way involves adding factors related to carbon emissions based on mimicking portfolio analysis methods, which eliminates the significance level of the aforementioned “alpha” term and thus verifies the existence of the green premium. In previous literature, scholars have confirmed the existence of the green premium by constructing carbon-emission-related factors, such as the efficient-minus-inefficient factor (In et al., 2017) , the brown minus green factor (Görgen et al., 2020) , and the low-carbon portfolio minus high-carbon portfolio factor (Bernardini et al., 2021) .
Secondly, in the process of discovering and evaluating the carbon premium and green premium, scholars have used various portfolio analysis methods. They constructed different investment portfolios to compare the average investment returns of high-carbon and low-carbon assets. Appendix B summarizes several previous main findings on the carbon premium and green premium in the climate finance field that employ various portfolio analysis methods.
Thirdly, scholars always use the event study approach to analyze the effects of green and low-carbon announcements, policies, and major events on the stock markets (Pham et al., 2019; Ramiah et al., 2016; Ramiah et al., 2013) . It is worth noting that the event study method we refer to is that employs dummy variables in regression models, which is based on the Chow test (Chow, 1960) . Monasterolo and de Angelis (2020) improve this approach and examined the stock market’s response to carbon emission risks from the investor’s perspective, and find that investors increasingly view low-carbon assets as attractive investments.
To the best of our knowledge, previous literature has not studied the impact of DCT on the pricing of financial assets and how investors respond to climate transition risks in the context of the DCT. In this paper, we contribute to filling this knowledge gap by studying with the perspective of the event study, i.e. adding a dummy variable to the robust financial asset pricing models to measure the impact of DCT on asset pricing. Moreover, with the efficient portfolio analysis approach, this paper explored how investors make scientific investment decisions in order to manage the climate transition risks against the backdrop of the DCT.
3. Methodology
3.1. Asset Pricing Analyses: Exploring Whether the Introduction of the Dual Carbon Targets Has Changed the Risk-Return Profile of Assets
We first use the following extended market model to explore the impact of the DCT and subsequent proactive carbon reduction actions on the risk-return profile of assets:
(1)
where
is the portfolios i excess return at period t;
is the market excess return in period t;
is an i.i.d. error term with
.
is the dummy variable, which assigns the value of 1 after the announcement of the DCT, otherwise is 0.
Next, to further verify the variations of risk-return profiles of different indices after the DCT was proposed, we apply the Fama-French five-factor model (Fama & French, 2015) .
(2)
where
and
represent the excess returns of portfolio i and the market, respectively, in period t.
is the dummy variable. In addition, SMB is the size factor, HML is the value factor, RMW is the profitability factor, and CMA is the investment factor, more detailed information about those factors can refer to Fama and French’s papers (Fama & French, 1993, 2015) .
Our research methodology is based on the Chow test, which allows us to evaluate the presence of a structural break within a given sample time period (Chow, 1960) . In this paper, we focus on the regression coefficients and significance levels of
and its interaction term. The intercept dummy variable (
) represents the mean change in the abnormal return of portfolio i after the DCT was introduced, and the slope dummy variable (
) denotes the overall alteration in the systematic risk of portfolio i after the DCT was proposed.
Finally, we acknowledge the well-known statistical limitations of the CAPM framework (Sharpe, 1964) and the regression models employed in our study. These limitations stem from assumptions such as the absence of autocorrelation, independence between the market index regressor and the stochastic component, and the hypothesis of homoskedasticity (Monasterolo & de Angelis, 2020) . To address these concerns, we introduce Heteroskedasticity and Autocorrelation Consistent (HAC) standard errors to interpret possible autocorrelation and heteroskedasticity (Andrews, 1991; Zeileis, 2004, 2006) .
3.2. Portfolio Analysis: How Should an Effective Investment Portfolio Adjust Its Asset Allocation in the Context of the Dual Carbon Targets?
We first construct efficient portfolios and compare the alteration in the movement of the portfolio’s efficient frontier before and after the DCT period. Next, we apply the global minimum variance (GMV) portfolio strategy to gain how could an efficient portfolio re-adjust its asset allocation in the context of the DCT, by comparing the changes in the weights of high- and low-carbon assets in the GMV portfolio before and after the proposal of the DCT. More formally, we define the weights in the GMV portfolio as a vector
such that
, (3)
Restricted by the following conditions
, (4)
where w is an n-dimensional vector of portfolio weights, Σ denotes the covariance matrix of the returns on the n indices in the GMV portfolio. In addition, the constraint of Equation (4) excludes the possibility for investors to hold short positions in the GMV portfolio.
The reason why we employ the global minimum variance portfolio strategy is that it can circumvent the extreme sensitivity of the portfolio weights in traditional Markowitz optimization to the estimation error of the expected return (Best & Grauer, 1991; Bodnar & Schmid, 2008; Chopra & Ziemba, 2013; Markowitz, 1952) . Wied et al. (2013) proposed a solution utilizing the GMV portfolio at the leftmost point of the mean-variance efficient frontier, which has the unique attribute of not requiring any expected return input. Bodnar and Okhrin (2013) conducted a study on whether investors could utilize the GMV portfolio and found that investing in the GMV portfolio is statistically feasible for investors with a wide range of risk aversion coefficients.
In terms of carbon emissions, we believe that there is a strong correlation between high-carbon (low-carbon) assets and similar high-carbon (low-carbon) assets. Moreover, to circumvent the impact of erroneously estimated expected returns on traditional Markowitz optimization, we argue that opting for the GMV portfolio analytical technique is a more suitable approach for our study than choosing the optimal portfolio.
4. Data and Preliminary Analysis
4.1. Data
Since there is currently no standardized classification system for “high-carbon” and “low-carbon” sectors in China, and detailed carbon emission data for listed companies is still unavailable, we employ Monasterolo and de Angelis’ (2020) approach to proxy high-carbon and low-carbon emissions intensity asset classes using index assets and distinguish them according to keywords. For the selection of the high- and low-carbon indices, we select them by the keywords inputted in Wind and the CHINA SECURITIES INDEX website2.
Regarding the high-carbon indices, we select the industry index according to the keywords, like “coal”, “oil & gas”, “energy”, and “steel”, and select the representative industry index within high carbon emissions in combination with the White paper on China’s Policies and Actions on Climate Change3. As to the low-carbon indices, there are few eligible indices when we apply keywords such as “low carbon”, “new energy”, and “ESG & environmental” to select the industry index. Thus, we use these keywords to select theme indices related to low-carbon to proxy low-carbon assets. We selected five representative high- and low-carbon indices, respectively. Appendix C lists the index we choose and its representative industry or theme.
We access daily frequency data of these indices and the risk-free return data from the RESSET database, covering the period from January 1, 2016 to October 29, 20214. Furthermore, we collect the data of Fama-French’s five factors from the CSMAR database.
4.2. Preliminary Analysis
Figure 1 shows the Pearson correlation plots of high- and low-carbon indices before and after the introduction of DCT. We discover that the correlation between high-carbon indices and low-carbon indices has decreased since the DCT was proposed.
Table 1 shows the results of statistical analysis for low carbon and high carbon indices. As to high-carbon indices, there is no obvious impact on their mean return since the DCT was introduced, but the standard deviation of almost all indices has changed significantly since the DCT was introduced. Regarding low-carbon indices, we note that after the DCT was proposed, three low-carbon indices show prominent differences in the mean at least at the 10% significance level. Moreover, these indices also show that the Post-DCT period standard deviation is significantly different compared to the Pre-DCT period standard deviation.
5. Results
5.1. The Impacts of Carbon Reduction Actions on High-Carbon Assets
Table 2 reports the changes in the risk-return profile of five selected representative high-carbon indices. The left panel A reports the results of the extended
![]()
Table 1. Preliminary analysis considering the different categories of indices.
Notes: The sample data covers the period from January 1, 2016 to October 29, 2021. Where the DCT denotes the Dual Carbon Targets that were announced on September 22, 2020. “Mean” and “Std dev” denote the daily mean return, the standard deviation for the index in the period before the DCT was proposed, and after it. The asterisk in the mean column denotes the significance level of the two-sample t-test for the sample means before and after the DCT was proposed. The asterisk in the “Std dev” column indicates the significance level of the test of Levene’s Test for the variance on the sample variances before and after the DCT was proposed. Respectively, “***” denotes significance at 1% level; “**” denotes significance at 5% level; “*” denotes significance at 10% level.
![]()
Table 2. Changes in risk-return profiles of high-carbon assets.
Notes: The left panel A shows the regression results using the extended market model. The right panel B shows the regression results using the Fama-French five-factor model. In addition, HAC robust standard errors in parenthesis. “***” denotes significance at 1% level; “**” denotes significance at 5% level; “*” denotes significance at 10% level.
![]() (a)
(a)![]() (b)
(b)
Figure 1. Pearson correlation coefficients plots. (a) Pre-DCT; (b) Post-DCT.
market model, and the right panel B shows the results of the Fama-French five-factor model. For brevity, we only report a few key coefficients.
As to high-carbon indices, we find that the estimated results of
and
in Table 2 are not significant for any index, at least at the 5% significance level. This means that the introduction of the DCT and its related policy measures do not substantially alter the risk-return profile of the high-carbon assets in Chinese stock markets. Regarding the reasons why the risk-return profile of high-carbon assets does not experience significant changes, we propose three possible explanations.
Firstly, power companies and energy companies are often in high-carbon emission industries, and their demand price elasticity is weak. Therefore, these companies can offset the adverse effects of related policies by raising prices to pass on the additional costs of the policies to consumers (Ramiah et al., 2013) . Secondly, considering the actual situation in China, where many large-scale electric utilities and energy companies are state-owned (Zhang & Gregory-Allen, 2018) , we speculate a more possible reason is that the Chinese government has provided subsidies or credit support to high-carbon emission enterprises as part of their active efforts to promote energy conservation and carbon emissions reduction. Thus, the adverse effects of carbon reduction policies on these enterprises could be offset. Finally, according to Giglio et al. (2021) and Semieniuk et al. (2021) reviews, we believe that the risk-return profile of the high-carbon assets didn’t change, which may be due to current investors’ insufficient understanding and response to carbon risks (Duan et al., 2020) .
5.2. The Impacts of Carbon Reduction Actions on Low-Carbon Assets
Table 3 reports the changes in the risk-return profile of five selected representative low-carbon indices. Panels A and B report the results of the extended market model and the Fama-French five-factor model respectively.
Regarding the return profile changes shown in Table 3, we discover three indices (CSI China Mainland Low Carbon Economy Index, CSI New Energy Index, and CSI Environmental Protection Industry Index) in both Panel A and Panel B that show positive and significant
estimates at the 5% significance level. Furthermore, it is noteworthy that the
estimators for these indices were insignificant. This indicates that before the introduction of the DCT, none of these indices had any noticeable abnormal returns. The introduction of the DCT, along with relevant policies and measures subsequent, has resulted in low-carbon indices showing stable and positive abnormal returns. We define the positive abnormal returns on low-carbon assets as low-carbon abnormal returns (LCARs).
We argue that the LCARs shown in low-carbon assets can be attributed to the DCT and the series of related policies that followed its introduction. First, as the government’s policies have tilted towards the low-carbon field, the resistance in
![]()
Table 3. Changes in risk-return profiles of low-carbon assets.
Notes: The left panel A shows the regression results using the extended market model. The right panel B shows the regression results using the Fama-French five-factor model. In addition, the value in parenthesis is HAC robust standard errors. “***” denotes significance at 1% level; “**” denotes significance at 5% level; “*” denotes significance at 10% level.
the business process of enterprises was reduced, and the non-operating costs of the low-carbon enterprise are lowered. Second, these enterprises with low-carbon properties can obtain more subsidies related to green and low-carbon development from the government or credit support from banks to a certain extent. (E.g., in Appendix A, the People’s Bank of China proposed to tilt more financial resources toward green and low-carbon sectors on March 21, 2021). Third, against the backdrop of the government’s proactive carbon reduction, consumers will increase demand for green and low-carbon products, which could promote the development of low-carbon companies. Finally, investors become optimistic about the prospects of green, low-carbon, and new energy-related companies, and the increasing investment demand drives asset prices to rise.
With regard to the risk profile changes for low-carbon indices, we note that, overall, the
estimators for low-carbon indices are positive and significant. This suggests that the investment risks in low-carbon assets have increased since the introduction of the DCT. As for its causes, we propose two possible explanations. First, the bankruptcy rate of green low-carbon companies is high, and the development of the low-carbon sector has largely been driven by the support of central or local government policies in the past. However, uncertainty remains in the stock market regarding whether government policies will continue to favor low-carbon industries in the future. Second, there may be a risk of the asset bubble in green and low-carbon assets. Semieniuk et al. (2021) indicate in their review that according to Schumpeter’s theory, the structural change risks of the financial sectors mainly originate from sunrise industries, i.e., the emerging low-carbon sectors. As the Chinese economy transitions towards low-carbon, the green low-carbon industries will evolve into emerging sunrise industries, thereby posing a risk of a “green bubble”.
5.3. GMV Portfolio Analysis: Shall We Implement the Decarbonization Portfolio Strategy?
5.3.1. The Evolution of the Efficient Frontier
Figure 2 shows the efficient frontier of our efficient portfolio constructed using the indices we selected. We divide the efficient frontier into a Pre-DCT efficient frontier and a Post-DCT efficient frontier according to the introduction of the DCT. By comparison, we can infer the efficient frontier in the Post-DCT period has an upward movement relative to that in the Pre-DCT period.
![]() (a)
(a)![]() (b)
(b)
Figure 2. A comparison is made between the efficient frontier before and after the DCT was introduced. The efficient frontier of the efficient portfolios, consisting of the same indices, moved after the introduction of the DCT, which resulted from the re-optimization of Markowitz’s portfolio. (a) Pre-DCT; (b) Post-DCT.
Firstly, starting from the GMV portfolio point at the beginning of the efficient frontier, we can observe that the overall return of the efficient frontier, which consists of the same indices, is higher in the Post-DCT period than in the Pre-DCT period. Secondly, we can compare the portfolio returns on portfolio variance between 1.10 and 1.30 in the period before and after the DCT was proposed. We can find that in the Pre-DCT period, the maximum return for efficient portfolios is not exceed 0.04. However, in the Post-DCT period, the minimum return for efficient portfolios has surpassed 0.05. This indicates that after the DCT was proposed, the risk-return profile of certain assets changed, as we assessed in the asset pricing analyses above. Therefore, efficient investment portfolios need to readjust the asset weights in portfolios in order to still gain the highest return in the same risk status5.
5.3.2. The Evolution of Asset Weights in the Global Minimum Variance Portfolio
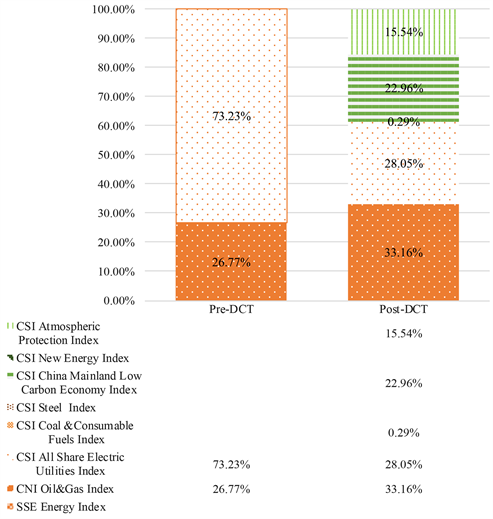
Figure 3 shows the proportion of different indices in the GMV investment portfolio for the sample period before and after the DCT was proposed. We note that the weights of low-carbon assets increase remarkably in the Post-DCT period. Overall, the percentage of low-carbon assets surge from zero to 63.96% of
![]()
Figure 3. Changes in indices weights in the GMV portfolio before and after the DCT was introduced. Assets in the high-carbon class are represented by brown dots while assets in the low-carbon class are represented by green lines.
the total assets in the Post-DCT period. This indicates that if investors aim to implement an efficient investment portfolio strategy to earn higher investment returns in the context of the DCT, they should consider increasing the weight of low-carbon assets in their investment portfolio.
To sum up, we argue that investors can apply a decarbonization portfolio strategy to earn higher investment returns by reallocating their portfolios and assigning greater weight to the low-carbon assets, against the backdrop of the Chinese government’s proactive actions to reduce carbon emissions.
To solve the potential concern that the weight changes of low-carbon assets may be determined by the CNI ESG 300 index, we remove this index and re-constructed the portfolio with the remaining indices. Then, we re-examine the weight changes of high-carbon and low-carbon assets before and after the introduction of the DCT. This finding was reported in Appendix D and we argue our conclusion still holds.
5.4. Robustness Checks
In this section, we provided supplementary analyses aimed at verifying the robustness of our findings over the sample period. These included efforts to account for the impact of the pandemic and firm-level portfolio analysis.
5.4.1. Containing the Influence of the COVID-19 Pandemic
As our sample period cover the period of the COVID-19 pandemic, the reliability of our findings may be impacted. We attempt to take the pandemic into the Fama-French five-factor model to control the pandemic to solve this concern. We use the daily new confirmed cases in China as a proxy of the pandemic, and get this data from the R package of nCov20196 (Wu et al., 2021) . After we apply the log first-order difference on pandemic data for stationary, the starting date of the pandemic data was January 23, 2020. We take that date as the occurrence point of the pandemic, and the missing data of the pandemic before that day were filled with zeros, indicating that the pandemic had not yet occurred. More specifically, we apply Equation (5) to regress and report the results in Table 4.
(5)
In Table 4, we observe that the regression results for the dummy variables do not substantially differ from the results shown in Table 2 and Table 3. This implies that our previous findings are robust and not affected by the pandemic.
5.4.2. Firm-Level Portfolio Analysis
We select high-carbon (brown) stocks and low-carbon (green) stocks according to the keywords we used to select indices and combine the company’s main business. We exclude the service sectors such as finance, tourism, and retail to select a total of 28 representative stocks covering power, fossil energy, new energy,
![]()
Table 4. Changes in risk-return profiles of high- and low-carbon assets after controlling the pandemic.
Notes: “HC” means high-carbon asset classes and “LC” means low-carbon asset classes. HAC robust standard errors in parenthesis. Respectively, “***” denotes significance at 1% level; “**” denotes significance at 5% level; “*” denotes significance at 10% level.
and pollution abatement sectors, including 14 high-carbon and 14 low-carbon stocks. The details of those companies are in Appendix E. Next, we access daily return data from the CSMAR database for each stock from January 2016 to April 2022 and remove all missing values. To mitigate the potential impact of the correlation in carbon emissions among these assets on portfolio optimization and align with the preceding analysis and align with the preceding analysis, we continue to utilize the GMV portfolio analysis technique. Figure 4 presents the weights of individual stocks in the GMV portfolio before and after the DCT was proposed.
As shown in Figure 4, the weight of all low-carbon (green) stocks in the overall portfolio increased from 49% before the DCT period to 68% after the proposal of DCT. This indicates that the adjustment strategy of the GMV portfolio, which represents efficient portfolios, increases the proportion of low-carbon assets in the entire portfolio after the DCT was introduced. Thus, according to the results of the firm-level portfolio analysis, an efficient portfolio should increase the allocation of low-carbon assets to cope with climate transition risks in the context of the DCT. This implies that our previous conclusion still holds.
![]() (a)
(a)![]() (b)
(b)
Figure 4. This figure displays changes in the weight of individual stocks within the GMV portfolio, with green or near-green hues indicating low-carbon stocks and brown or near-brown hues indicating high-carbon stocks. (a) Pre-DCT; (b) Post-DCT.
6. Conclusion
The response of financial markets to the low-carbon transition varies across countries depending on unique characteristics, sensitivity, and historical period, which is an open and interesting question for current and future research. This study examines how China’s equity investors can adjust their portfolios to manage climate transition risks against the backdrop of China’s proactive carbon mitigation efforts. To precisely define China’s proactive carbon reduction efforts, we use the Dual Carbon Targets proposal as a symbolic starting point. Based on robust asset pricing models, we introduce the dummy variable to evaluate the influence of the Dual Carbon Targets and subsequent relevant policies on the risk-return profiles of high-carbon and low-carbon assets. Finally, we utilize the global minimum variance portfolio technique to compare the weight changes of high-carbon and low-carbon assets before and after the introduction of the Dual Carbon Targets, to ascertain an effective portfolio strategy for coping with climate transition risks.
This paper draws two main conclusions. Firstly, the risk-return profile of high-carbon assets has not shown significant changes in light of China’s proactive measures to reduce carbon emissions. This implies that investors holding carbon-intensive assets under the current Chinese government’s carbon mitigation efforts may be exposed to potential stranded risk (Daumas, 2021) in the future, without being compensated for this risk through the so-called “carbon premium”, at least for the time being. Secondly, in the context of China’s proactive efforts to reduce carbon emissions, low-carbon assets show positive abnormal returns while their risks simultaneously increase. This indicates that the green premium or low-carbon premium exists in the Chinese equity market, thus investors who hold more low-carbon assets are more likely to achieve higher investment returns.
Our findings indicate the existence of a green premium in China’s stock market, which suggests that climate change risks are currently a concern for numerous investors. This discovery aligns with prior studies, such as Ardia et al. (2022) , Faccini et al. (2021) , and Pástor et al. (2021a) they show that with climate-related policies releasing and climate concerns increasing, green or low-carbon assets can provide higher investment returns for it can hedge climate risks and meet investors’ tastes. Although we believe that gradually shifting assets to low-carbon sectors is a new investment opportunity to achieve higher revenue until the equilibrium (Pástor et al., 2021b) is reached, we also acknowledge our concern about the possibility of bubbles forming in certain green assets due to the rising risks.
Our study still has several remaining limitations, one of which is that the current approach of using keywords is only applied for assets in industries with very high or very low carbon emissions or intensive sectors, but may not be suitable for assets in the medium zone of carbon emissions regarding climate risk pricing. Furthermore, achieving the Dual Carbon Targets will require decades of effort. The response of China’s stock markets to climate risks may evolve in stages as the economy gradually transitions towards a low-carbon economy. This paper just represents an early attempt to explore the response of China’s stock markets to climate risks against the backdrop of the Dual Carbon Targets. In order to understand how China’s stock markets respond to climate risks and determine effective measures for investors to manage climate risks at various stages of the low-carbon transition, much more research needs to be conducted in the future.
Funding
This research was supported by the 2022 Major Research Fund Project of Guizhou University of Finance and Economics under Grant No. 2022KYZDA02.
Appendix
Appendix A
Series of policy measures or events in response to the “Dual Carbon Targets”.
Note: These relevant policies and measures are derived from [http://www.greenfinance.org.cn/more.php?cid=21] [https://www.mee.gov.cn/zcwj/gwywj/] [http://www.tiki-toki.com/timeline/entry/1054822/-/].
Appendix B
Asset pricing applications of portfolio analysis methods in climate finance.
Notes: High-carbon (low-carbon) means high (low) CO2 total emissions levels or emission intensity. When we refer to the portfolio analysis method, we mean the method of comparing the performance of various portfolios.
Appendix C
The specific industry or theme can be represented by the index we choose.
Appendix D
The weights of high-carbon indices assets and low-carbon indices assets in the GMV portfolio after we removed the ESG 300 index. Assets in the high-carbon class are represented by brown dots while assets in the low-carbon class are represented by green lines.
Appendix E
Catalogs and categories of stocks.
NOTES
1https://www.cs.com.cn/xwzx/hg/202103/t20210303_6143146.html.
2See https://www.csindex.com.cn/#/indices/family/list.
3See https://www.mee.gov.cn/zcwj/gwywj/202110/t20211027_958030.shtml.
4Data from RESSET (https://www.resset.com/) database.
5We realize that each policy after the DCT proposal may have a different impact on the risk-return profile of different assets in the portfolio, which in turn will cause the portfolio to adjust dynamically accordingly. However, our target is to identify the overall adjustment trend of the efficient portfolio in the context of a series of policy measures implemented during the sample period following the DCT proposal. Therefore, we assume that there is only one efficient portfolio adjustment during the post-DCT sample period to ascertain the long-term adjustment trend of the efficient portfolios.
6See https://github.com/YuLab-SMU/nCov2019/.