Development of a Test Rig for Axial Strains Measurement in Automobile Wheel ()
1. Introduction
A test rig is a piece of machinery that is primarily used to test and assess the capability and performance of components for industrial use. The term test rig is sometimes also referred to as test bay, test bench, pressure test facility and testing station but they all refer to equipment that carry out component testing [1] . A test rig can be customized to tackle a multitude of difficult measurement tasks necessary to fulfill your specific requirements and needs from hydraulic to aerospace and are capable of testing an unlimited number of parameters in a wide variety of testing methods. It should also be user-friendly, with a simple user interface and an ergonomic design. Advantages on the use of test rig are quality assurance, saves time and cost [1] [2] .
A test bench or testing workbench is an environment used to verify the correctness or soundness of a design or model. In the context of software or firmware or hardware engineering, a test bench is an environment in which the product under development is tested with the aid of software and hardware tools [3] [4] .
In automobile wheel application, a test rig is used to simulate conditions of the wheel in service. There are basically four types of wheel test, viz: static radial test; dynamic impact test.; dynamic radial fatigue test and dynamic cornering fatigue test.
The static radial and axial test is used to investigate the influence of varying radial loads due to vehicle weight, passengers’ weight and local bending moment induced on the rim due to rim offset, and axial load due to tyre inflation pressure on the displacement, stress, and strain distributions of the wheel with contact patch angle wish vary from 30, 40, and 90 degrees, experimentally or by the use of Finite Element (FE) analysis [5] [6] . The dynamic impact test is used to evaluate the impact performance. It is considered to be the case where the wheel collides with the curb of the road or a large obstacle. The test is designed to evaluate the frontal impact resistance of wheel and tyre assemblies used in all cars and multi–purpose vehicles [7] [8] . Dynamic radial fatigue test simulates condition of the wheel tyre assembly on a smooth road [9] [10] . The cornering fatigue test is one of the traditional durability tests for prototype verification. It simulates the dynamic loading of the wheel during cornering on the road [11] .
The aim of this work is to develop a test rig for the for the determination of principal strains in an automobile wheel, in this case an automobile aluminium alloy wheel statically loaded.
2. Methodology
2.1. Design Analysis
The test rig (Figure 1) is made of mild steel parts. The design of the various parts was accomplished using appropriate relations, imposed radial load (W) and, the geometric and physical properties of the material used.
![]()
Figure 1. (a) Isometric view of test rig. (b) Exploded view of test rig.
2.1.1. Diameter of Horizontal Beam Support
Diameter of shaft is given as [12] ,
(1)
2.1.2. Deflection of Horizontal Beam Support
The maximum deflection of the horizontal support beam is [12] [13] ,
(2)
2.1.3. Vertical Column Support
The column is fixed at both ends going by its end conditions. For a fixed—fixed column, the equation for the Euler’s critical load (
) is [13] [14] ,
(3)
2.1.4. Flanged Rod
The connection between the flange and the hub of the wheel is assumed to be in pure shear, which is all five bolts carry equally the vertical shearing force. Knowing that the rod will carry half of the imposed radial, the diameter of each bolt obtained thus [14] :
(4)
Stress in the flanged rod is,
(5)
the equation for deflection of the rod (cantilever) is [15] ,
(6)
2.1.5. Principal Strains
The relationship between principal strain and axial strain is [16] :
(7)
2.2. Specification
The selected aluminium alloy wheel is (6JX14H2; ET 42) and Tyre (175 × 65 R 14). Using appropriate values in Equations (1)-(6) and, values from [17] and [18] , gives the following parameters:
Radial Load (W, F) 4750 N
Inflation Pressure (P) 300 kN/m2
Yield Stress of Wheel (Yw) 222.5 MPa
Young’s Modulus of Wheel (Ew) 22.29 GPa
Yield Strain of Wheel (Yw) 1 × 10⁻² mm/mm
Length of Horizontal Beam Beam Support (Lhbs) 0.6 m
Young’s Modulus (E) of Horizontal Beam & Vertical Column Support 207 × 109 N/m2
Diameter of Horizontal Beam Support (dhbs) 0.038 m
Length of Vertical Column Support (Lvcs) 0.45 m
Critical Load of Vertical Column Support (Pcr) 1400 MN
Yield Stress (Ss) of Horizontal Beam & Vertical Column Support 248 × 106 N/m2
Yield Stress (Yb) of Bolt 248 × 106 N/m2
Flanged Bolt M12 × 1.5 mm
Stress in Flanged Rod (σfr) 112 kPa
Diameter of Flanged Rod (dfr) 0.038 m
Max. Deflection of Horizontal Beam Support (δhbs) 2.92 × 10⁻⁵ mm
Max. Deflection of Flanged Rod (δfr) 3.8 × 10⁻⁵ mm
Max. Allowable Deflection of Horizontal Beam Support & Flanged Rod 0.02
2.3. Construction and Testing
The parts were measured and cut to required size based on the design, Figure 1. The base structure was formed by welding together the length and width of the base frame. The base plate was then welded to the base structure symmetric about its length. Four holes of 12.5 mm diameter were then drilled, each along the width of the base structure to accommodate the M12 × 1.5 mm bolts and nuts. The metal strips with drilled holes as shown were then welded to one end each of the vertical guide rails. The vertical guide rails with attached metal strips were mounted on each width of the base frame structure, with the drilled holes aligned and fastened to it with the aid of the bolts M12 × 1.5 mm bolts and nuts. The horizontal support beam is a rod of 630 mm long and 38 mm in diameter. It was placed in the upper bushings attached to the vertical support column. The flanged rods have five holes each drilled in the flanges to match the wheel’s bolt holes. The flanges were attached to the wheel—tyre assembly (wheel’s hub) with M12 × 1.5 mm bolts and nuts, while the other ends of the flanged rods were slipped into the lower bushings of the vertical column support. The vertical column supports could slide rightwards or leftwards on both the horizontal beam support and are held in position by screws via threaded holes in the bushings. The wheel and tyre, flanged rod, vertical support column and horizontal support beam as an assembly was then slipped into the vertical guide rails, with the tyre resting on the base plate.
2.4. Testing
In carrying out the experiment, the items used were: Tyre (175 × 65 R 14); Aluminum alloy Wheel (6JX14H2; ET 42), for a passenger car; Test rig; Strain rosette; Strain measuring device.
The tyre was mounted on the rim of the wheel. The locations on which the strain rosettes were to be mounted—inboard, well and outboard—were prepared and cleaned.
The steps taken before loading the tyre—wheel assembly were as follows: First the tyre was mounted on the rim of the wheel. Strain rosette were then attached at intervals of 30 degrees on the wheel’s inboard bead seat, the well and outboard beat seat, starting from 0 degree at point of contact at the wheel with the ground. Lead wires were then attached to each of the terminals and strain rosette, with the other end attached to the strain recorder. The flanged rods were then attached to the wheel’s hub and, with the vertical column support slipped onto the rod ends of each flanged rod. The horizontal beam support was then slipped into the bushings of the vertical guide column. The whole assembly was slipped into the vertical guide rails, base plate and base structure assembly. With this in place, the entire assembly was mounted on the hydraulic press and loaded as prescribed, Figure 2.
![]()
Figure 2. Orthographic view of test ring in hydraulic press.
The radial load value employed was 4750 N, while the inflation pressure employed was 0.3 MPa. These values used, depended on the maximum load and maximum inflation pressure of the tyre as given by the manufacture. The axial strain induced due to each loading combination was read off the strain recorder. Each recorder has three channels each. Only three sets of strain rosette could be recorded at any one time. The rosettes were numbered from R1 to R18 (R1 is for Rosette no. 1, while R2 is for Rosette no. 2 in that order to R18), with each rosette having three gages each, tagged as G1, G2 and G2 respectively. The gage numbering was counterclockwise, Plate 1 and Plate 2. The axial strains were
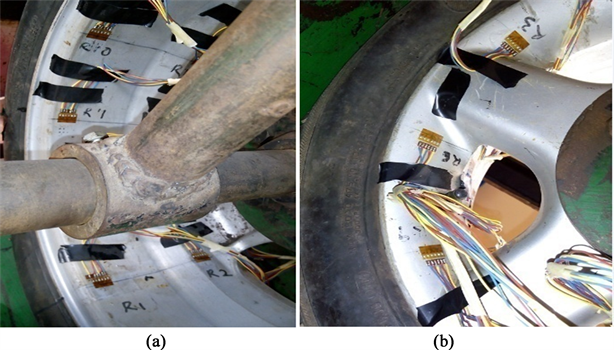
Plate 1. (a) Wheel-tyre assembly in the test rig showing attached strain rosette at the outside surface of the rim: Inboard view; (b) Outboard view.
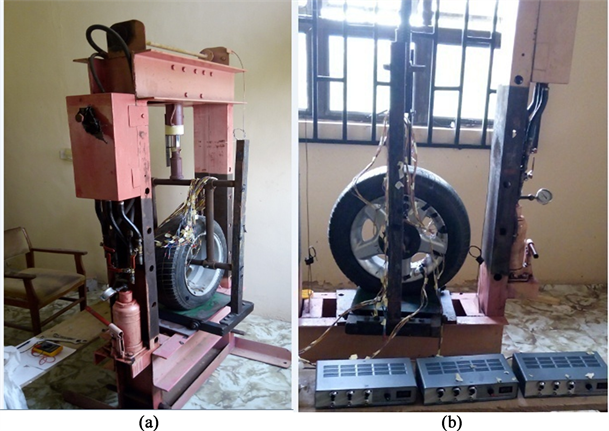
Plate 2. (a) Wheel-tyre assembly in the test rig in hydraulic press with lead wires; (b) Wheel-tyre assembly in the test rig showing the instrument (strain measuring device) connection to the lead wires of the strain rosette.
then converted to principal strains using Equation (7). The locations of the rim that were considered for this work are the inboard bead seat, well and the outboard bead seat. The (EXP) principal strain values were compared with that obtained by FEA at contact angles of FEA 30.25 deg, FEA 40 deg and FEA 90 deg, using Creo-Element/Pro 5.0 [17] [18] . The contact angle of 30.25 degree wsa obtained experimentally, while the 40 and 90 degrees contact angles were from literature [6] .
3. Results and Discussion
Table 1 shows EXP axial strain values from test rig at 4750 N Radial Load and 0.3 MPa Inflation pressure, while Tables 2-4 show the FEA data, respectively for the inboard bead seat, well and outboard bead seat used, for comparison with
![]()
Table 1. Experimental (EXP) axial strain values from test rig at 4750 N radial load and 0.3 MPa inflation pressure.
![]()
Table 2. Inboard EXP and FEA values of maximum principal strain. Source: [17] [18] .
![]()
Table 3. Well EXP and FEA values of maximum principal strain. Source: [17] [18] .
![]()
Table 4. Outboard EXP and FEA values of maximum principal strain. Source: [17] [18] .
EXP values. Table 5 displays mean EXP and FEA values of maximum Principal Strains.
Figures 3-5 shows the plots of maximum principal strain values at different locations of the wheel’s rim.
Figure 3 illustrates the relationship, at inboard bead seat, between the EXP and FE on the induced maximum principal strain at 4750 N radial load and 0.3
![]()
Table 5. Mean EXP and FEA values of maximum principal strain. Source: [17] [18] .
![]()
Figure 3. Maximum principal strain results at the inboard bead seat: EXP vs FEA at 4750 N Radial Load and 0.3 MPa Inflation Pressure.
MPa inflation pressure. All plots exhibited negative slopes between 0 degree and 40 degrees locations. Within this range, FEA30.25 deg and FEA40 deg exhibited a sharp decrease in principal strain values, while that of EXP and FEA90 deg experienced gradual reduction. Clustered and intersecting locations of the plots indicates the wheel’s spike or arm, whose locations are at about 40 degree and about 110 degree. At these locations there was a strong correlation between the principal strain values. The highest maximum principal strain values were about 1.85 × 10⁻⁴ mm/mm, 1.38 × 10⁻⁴ mm/mm, 4.51 × 10⁻⁴ mm/mm and 5.69 × 10⁻⁴ mm/mm, respectively for EXP, FEA90 deg, FEA40 deg and FEA30.25 deg. All strain values were less than the yield strain value of about 1.00 × 10⁻² mm/mm in simple tension test. The mean maximum principal strain values were, 1.44 × 10⁻⁴ mm/mm, 1.00 × 10⁻⁴ mm/mm, 1.81 × 10⁻⁴ mm/mm and 2.11 × 10⁻⁴ mm/mm, respectively for EXP, FEA 90 deg, FEA 40 deg and FEA 30.25 deg.
Considering Figure 4, the maximum principal strain values at the well were about 1.11 × 10⁻⁴ mm/mm, 4.30 × 10⁻⁴ mm/mm, 5.07 × 10⁻⁴ mm/mm and 5.66 × 10⁻⁴ mm/mm, respectively, for EXP, FEA90 deg, FEA40 deg and FEA30.25 deg. All the curves exhibited downward slopes from 0 to 30 degrees locations. The values at ground contact represent the maximum principal strain values for the FEA curves, while that of EXP curve occurs at about 90 degrees location, with a value of about 2.11 mm/mm. All FEA values were higher than EXP values in all angular locations. However, the shape of the curves assumed the same characteristics. The mean maximum principal strain values were, 1.00 × 10⁻⁴ mm/mm, 3.73 × 10⁻⁴ mm/mm, 3.68 × 10⁻⁴ mm/mm and 3.78 × 10⁻⁴ mm/mm, respectively for EXP, FEA 90 deg, FEA 40 deg and FEA 30.25 deg. Again, strain values were less than the yield strain value of about 1.00 × 10⁻² mm/mm.
Figure 5 represents plots at the outboard bead seat. At ground contact angle, EXP maximum principal strain value was about 2.22 × 10⁻⁴ mm/mm, while the FE values were about, 0.30 × 10⁻⁴ mm/mm, 0.43 × 10⁻⁴ mm/mm and 0.49 × 10⁻⁴ mm/mm, respectively for FEA90 deg; FEA40 deg and FEA30.25 deg. Their respective largest maximum principal stress values were 2.46 × 10⁻⁴ mm/mm, 0.54 × 10⁻⁴ mm/mm, 0.99 × 10⁻⁴ mm/mm and 1.56 × 10⁻⁴ mm/mm for EXP, FEA90 deg, FEA40 deg and FEA30.25 deg. The greatest value for EXP curve was at ground contact, 120 degrees location for FEA40 deg, while that for the FEA90 deg and FEA30.25 deg were each at angular location of 150 degrees. The EXP
![]()
Figure 4. Maximum principal strain results at the well: EXP vs FEA at 4750 N radial load and 0.3 MPa inflation pressure.
![]()
Figure 5. Maximum principal strain results at outboard bead seat: EXP vs FEA at 4750 N radial load and 0.3 MPa inflation pressure.
maximum principal strain coincides with the FE values at different locations on the wheel’s rim. The slope of the EXP curve was negative between 0 degree and 30 degrees locations, while the FE curves assume negative slope within this range. The mean maximum principal strain values were, 0.99 × 10⁻⁴ mm/mm, 0.51 × 10⁻⁴ mm/mm, 0.66 × 10⁻⁴ mm/mm and 0.84 × 10⁻⁴ mm/mm, respectively for EXP, FEA 90 deg, FEA 40 deg and FEA 30.25 deg. The strain values were less than the yield strain value of about 1.00 × 10⁻² mm/mm.
4. Conclusion
The development of a test rig for strain measurement of wheel has been presented and tested. Results show that at the wheel’s point of contact with the ground, maximum principal strain values were highest at the inboard bead seat with a value of about 5.69 × 10⁻⁴ mm/mm, followed by the values at the well of about 5.66 × 10⁻⁴ mm/mm. The maximum principal strain values were least at the outboard bead seat due to the presence of spikes at this location which tends to resist imposed radial loads. The value at the outboard was about 2.22 × 10⁻⁴ mm/mm. However, the highest mean maximum principal strain values at the locations of inboard, well and outboard, were about 2.11 × 10⁻⁴ mm/mm, 3.78 × 10⁻⁴ mm/mm and 0.99 × 10⁻⁴ mm/mm, respectively. With the highest single value of about 5.69 × 10⁻⁴ mm/mm, the inboard bead seat was the most strained location of the wheel. Overall results showed that all values of maximum principal strains were below the threshold value of about 1 × 10⁻² mm/mm. With this in mind and, with the EXP values obtained from the test rig viz-a-viz the FEA values, the rig is recommended for use in related experimental procedures.
Notation
W Radial Load
P Inflation Pressure
dhbs Diameter of Horizontal Beam Support
δhbs Max. Deflection of Horizontal Beam Support
Lhbs Length of Horizontal Beam Beam Support
Lvcs Length of Vertical Column Support
σfr Stress in Flanged Rod
δfr Max. Deflection of Flanged Rod
M Bending Moment
I Moment of Inertia
Ss Yield Stress
π Pie
E Young’s Modulus of Horizontal Beam & Vertical Column Support
Lfr Length of Flanged Rod
εP,Q Principal Strain
ε1, ε2, ε3 Axial Strains
Pcr Critical Load of Vertical Column Support
db Diameter of Bolt
dfr Diameter of Flanged Rod