Research on Extraction Method of Surface Information Based on Multi-Feature Combination Such as Fractal Texture ()
1. Introduction
Land use/land cover is a long-lasting and popular topic in the field of remote sensing. With the introduction of various new technologies and methods, the level of intelligence and automation and the accuracy of information extraction have also been greatly improved. Remote sensing technology relies on the characteristics of ground objects to obtain the attributes of surface objects. There are many characteristics of ground objects, such as: color, texture, etc.
Because color features are easy to identify and easy to extract, color features are the most widely used features in image classification ( Zhou et al., 2007 ). We use the K-means algorithm to calculate the Euclidean distance to classify remote sensing images based on the color features of color hue H, saturation S, and lightness V in this paper among which the HSV color model (hue, saturation, lightness) ( Smith, 2002 ) is more accurate than the remote sensing image classification based on the RGB color model ( Sural et al., 2002 ). The color model is more suitable for human vision, and the HSV color model can be mutually converted into RGB color model in values ( Chen et al., 2007 ). This paper introduces a color feature-based extraction method based on the HSV color model combined with the K-Means clustering algorithm ( Palmason et al., 2005 ).
The supervised machine learning method such as support vector machine (SVM) classifier is used for classification widely. The SVM method exhibits a high classification accuracy in many applications such as image classification, speech recognition, object detection, and medical diagnosis ( Mahendra & Mallikarjunaswamy, 2022 ). The SVM method also has the capability to train and test the feature vectors and works efficiently with unstructured or semi structured data ( Razaque et al., 2021 ). As a result, SVM works well with low-dimensional features and linearly separable vectors.
With the continuous development of remote sensing satellites, the spatial resolution is getting higher and higher. At present, the spatial resolution of the high-resolution data has reached below the meter level. However, the complex land surface in the south has fragmented patches, and it is often difficult to distinguish between barren land and cultivated land. Therefore, the feature extraction technology in terms of texture features needs to be further strengthened. Texture information is the representation of the distribution of gray pixels in geographical space, and is an important feature in remote sensing information extraction. Due to that the texture feature considers the spatial relationship between adjacent pixels of the grayscale image, the feature information of different scales can be obtained from the macro and micro dimensions in different spatial dimensions of the texture information ( Fan et al., 2013 ; Coburn & Roberts, 2004 ), which can make up for the problem of only relying on spectral features to identify places. Texture information has been widely used in mineral and lithological identification ( Dong & Leblon, 2004 ; Li et al., 2001 ; Jakob et al., 2015 ; Mather, 1988 ; Sabins, 1999 ; Huang et al., 2003 ; Ma et al., 2008 ), vegetation type identification ( Franklin et al., 2001 ; Wood et al., 2012 ), marine oil spill monitoring and other related fields.
At present, there are generally three methods for extracting texture features in remote sensing information extraction: 1) Gray level co-occurrence matrix method based on statistical principles, 2) Texture feature extraction method based on fractal at different scales, 3) Texture feature extraction based on wavelet transform Law. The gray-level co-occurrence matrix is a statistical method that is widely used, because the method extracts the relationship between adjacent pixels. This relationship between adjacent pixels takes into account the relationship between different directions and distances, and can respond in more detail. Texture features of ground objects. Wavelet transform acts as a mathematical magnifying glass, which can analyze multi-scale texture features and is more suitable for multi-resolution image texture information extraction. In most cases, it is only sensitive to objects with regular outlines ( Wood et al., 2012 ; Liang et al., 2009 ), the fractal theory is applied to the extraction of complex surface remote sensing texture information in the paper. It can extract texture information of different scales because fractal geometry has self-similarity, which can improve the information extraction accuracy of processing remote sensing images of complex surface areas, and is useful for identifying complex objects in nature. Ground features have good information extraction ability ( Liang et al., 2009 ). The problem of “same object with different spectrum” or “foreign object with same spectrum” makes it difficult to obtain the ideal classification accuracy only based on the spectral information of hyperspectral image. Texture features are important structural information of spatial distribution of ground objects, which can effectively make up for the deficiency of spectral features in hyperspectral remote sensing image classification. Based on previous research results, most scholars believe that the analysis of texture features can better suppress the phenomenon of “same object with different spectrum, different object with same spectrum”, thereby improving information extraction accuracy of remote sensing images.
In the field of image processing and analysis, fractal technology is widely used in image compression, image texture analysis, image classification, image segmentation and so on. Fractal technique is a mathematical tool that can be used to describe self-similar graphics. Its basic idea is to divide the image into several sub-images, and the self-similarity between each sub-image and the original image is expressed by morphological similarity.
Fractal image texture analysis is a texture analysis method based on fractal dimension, which can reveal the scale invariance of image texture. By calculating fractal dimension or other characteristic parameters related to fractal dimension, image texture can be classified and recognized. Fractal texture analysis technology has played an important role in the field of texture image classification and texture recognition.
The texture features of the complex surface in southern China present the characteristics of fragmentation, discontinuity, and sporadic distribution in this paper. The method of combining fractal texture, color, and vegetation index features is selected to improve the classification accuracy of remote sensing images.
2. Overview of the Study Area and Data Preprocessing
2.1. Overview of the Study Area
The coordinates of Dongguan and Shenzhen in Guangdong are 22˚39'-23˚09' north latitude and 113˚31'-114˚15' east longitude. They are located in the southern coastal area of China. The area is a typical area of tropical monsoon climate, with sufficient sunlight, warm climate, Sufficient rainfall is suitable for the growth of tropical crops, and it is located on the east side of the Pearl River Estuary, close to Shenzhen and Hong Kong, with superior transportation and geographical location, and belongs to the economically developed area in the south.
The geographical location of the study area (Shenzhen Guangming North Land Development and Consolidation Supplementary Farmland Project) is shown in Figure 1.
![]()
Figure 1. Geographical location of the study area.
2.2. Data Acquisition and Preprocessing
The paper selected the Gaofen-2 satellite image of the study area, the time phase was February 15, 2017, and the cloud cover was less than 10%.
The GF-2 image had undergone preprocessing such as atmospheric correction, orthorectification, geometric correction, fusion. The flaash atmospheric correction method was used for atmospheric correction. The remote sensing map adopted Gauss Kruger projection with 3-degree banding. The ellipsoid selected the “IUG1975” ellipsoid. The plane Cartesian coordinate system used the Xi’an 80 coordinate system. The elevation system adopted the 1985 national elevation datum.
3. Method
In recent years, the field of remote sensing applications has focused on developing powerful feature representation methods in different domains ( Chen & Tian, 2015 ; Raja et al., 2013 ). Most methods are developed directly based on raw color or texture features, such as color histograms and histogram moments ( van et al., 2010 ; Jiang et al., 2008 ). The complex surface in the paper was classified via the method which was based on texture, color, vegetation index and SVM (support vector machine).
3.1. Texture Feature Extraction
Many objects on Earth, including natural objects such as forests and plants often have complex structures that are difficult to model correctly by simple ideal forms such as spheres, cylinders and cubes. However, these objects were found to often exhibit self-similarity and self-affinity in their structures ( Mandelbrot, 1982 ), which led to the development of a new field of scientific research called fractal analysis ( Barnsley , 1988
This paper used the method of fractal Brownian motion based on surface area to extract texture features. The method of fractal Brownian motion is a mathematical model based on the principle of self-similarity proposed by “Mandelbrot et al”. It has a similar distribution feature in the dimension, and people hope to use the feature to build a model to extract some microscopic features of ground objects. The method of fractal Brownian motion is a method for calculating the fractal dimension of ground objects based on the model of fractal Brownian motion.The values of each pixel on a grayscale image of a band are expressed as (x, y, z) in grayscale image processing, where x and y represent the row and column numbers of the pixel points, z represents its gray value, If the coordinates are placed in a three-dimensional rectangular coordinate system, and z is regarded as a function of x and y, that is, (x, y, z(x, y)), then z can be fitted into a surface by the least square method, The surface area of the surface is different in different spatial dimensions, and the number of dimensions represents the texture feature of the image, thus introducing a method to calculate the fractal dimension (fractal texture feature) using the surface area of the remote sensing gray image, The algorithm ( Tang, 2023 ) are as follows.
(1)
According to the principle of linear regression and the above formula.
(2)
In the above formula, r represents different spatial scales, A(r) is the area of the surface calculated in the scaled space, K is a constant, and D is the number of fractal dimensions. The above formula shows that after calculating the surface areas of different scales, the number of fractal dimensions can be calculated.
Each pixel in the remote sensing grayscale image can be regarded as a cubic column in the surface, and the surface area of the surface is the top surface and two sides of each cube (all pixels are adjacent, in order not to repeat the calculation, so only Calculate the sum of the areas of two sides), the specific algorithm ( Tang, 2023 ) is as follows.
(3)
In the formula, r is the scale, A(r) is the surface area at the r scale, and f(i,j) is the gray value of the pixel at the r scale. The convolution center point is assigned a dimension value, and a matrix of fractal dimensions is constructed, which becomes an important feature of the input support vector machine model for classification. The main body of the specific algorithm is as follows.
1) Get the image size.
2) Normalize the pixel value.
3) Obtain the increments of the bottom (forward direction) and the right through a double loop, calculate the gray surface area, and then calculate the logarithm of the gray surface area and scale to prepare for the calculation of the fractal dimension. The above algorithms are realized by matlab2016a software programming.
3.2. Color Feature Extraction
Color feature is one of the basic features of images. Color feature is the most widely used in image retrieval because of its easy extraction ( Zhou et al., 2007 ). HSV (hue, saturation, brightness value) ( Smith et al., 2002 ), showing better image classification effect than RGB color space ( Sural et al., 2002
The hypothetical data set (
),
is a feature vector of a D-dimensional image in the K-Means clustering algorithm, and
is also an element in an algorithm. The K-Means clustering algorithm is to take the data set (
) into M categories. The specific algorithm steps are as follows:
1) Randomly select K elements (eigenvectors).
2) Calculate the square of the distance from the element to the K elements by combining all the elements in the set with the K elements.
3) Classify the corresponding elements into K categories according to the minimum value of the square of the distance. The formula is as follows.
(4)
4) After updating the central element points of the K category, it will be the average point of all the elements inside each category in the K category. A new K-category central point group is formed after each category recalculates the central point.
5) Apply the loop statement in steps 2 and 3, and execute it continuously until the center point no longer moves, so as to obtain the final K-type center point group. The surroundings of the K-type center point are the elements of each category, and the classification is over.
3.3. Extraction of Vegetation Index
Predecessors have established more than 40 vegetation indices with different uses, which have been widely used in agricultural yield estimation, forestry vegetation coverage, environment, land coverage, and farmland utilization monitoring.
The normalized difference vegetation index (NDVI) is a vegetation index that is widely used at present. Its calculation formula is:
, where NIR represents the spectral reflectance in the near-infrared band, and R Indicates the red band. The NDVI has actual values between −1 and +1 by definition, where increasing positive values indicate increased green vegetation and negative values indicate non-vegetated surface features. The NDVI is suitable for early and mid-term remote sensing monitoring of crops, and it is also effective in distinguishing crops from backgrounds. It is more suitable as a feature index for remote sensing information extraction of cultivated land.
Enhanced Vegetation Index (EVI) ( Wang et al., 2011 ) is also a widely used vegetation index, the calculation formula is,
(5)
The EVI vegetation index is sensitive to the soil background. When the vegetation coverage is incomplete, the contrast between the soil background and the vegetation is obvious, and it is very sensitive to the patchy soil patches. The EVI also has a certain ability to monitor the growth of vegetation. The NDVI and EVI can generally be used in combination to achieve simultaneous sensitivity to vegetation coverage and soil background, and are especially suitable as feature information in the extraction of complex surface remote sensing information.
3.4. Support Vector Machine Model
Machine learning techniques focus on automatic interpretation and feature classification. According to the hierarchical structure of the model, machine learning techniques are divided into surface learning and deep learning. In terms of surface learning, the support vector machine (SVM) algorithm proposed by Vapnik (1995) . The SVM is a machine learning algorithm based on statistical learning theory. The SVM has been used in the field of pattern recognition, such as handwriting recognition, text classification and medical image analysis, remote sensing image classification and other fields. Zhu & Blumberg (2002) classified ASTER data by SVM in 2002. Keuchel et al. (2003) synthesized maximum likelihood and SVM in 2003 and applied the hybrid algorithm to Landsat 5 Thematic Mapper(TM) images. Nemmour & Chibani (2006) used SVM for change detection of urban land cover. Melgani & Bruzzone (2004) applied SVM to hyperspectral data processing in 2004. Inglada (2007) used SVM to automatically extract man-made objects from high spatial resolution images in 2007.
The SVM has been successfully applied in many fields and is a small-sample machine learning algorithm based on structural risk minimization. Assuming a binary classification problem with k samples, it can be described as,
(6)
The SVM searches for the optimal hyperplane to classify binary problems according to the maximum distance between two classes and according to the distance between two classes. The hyperplane can be formalized as follows.
(7)
Among them, w represents the weight vector of the classification hyperplane, b and R represent the deviation, and represent the mapping from the feature space to the high-dimensional Hilbert space (H), in which the optimal hyperplane is built-in.
(8)
The process of finding the optimal hyperplane can be transformed into an optimization problem, which is called object function and constraint.
(9)
(10)
where C represents the penalty parameter, and ξi represents the slack variable ABLES. Importing these variables helps solve linearly indivisible problems. In order to solve the above optimization problem, SVM uses Lagrange function to transform the original optimization problem into a dual optimization problem, where the object function and constraints can be formalized as follows.
(11)
K(xixj) represents the kernel function. The nel function used in ker-SVM must satisfy the positive semi-definite matrix. Common kernels used in SVM include polynomial kernels and primary functions as follows.
(12)
We can use some algorithms, the discriminant function for classification is,
(13)
4. Results and Analysis
The paper uses matlab2016a and ENVI5.3 software to realize the extraction of farmland fractal texture features in the complex surface area of southern China. The specific results are shown in Figure 2 and Figure 3.
A combination feature was formed on the basis of obtaining the texture feature information and combined with feature information such as color and vegetation index, and the support vector machine model was used to classify these combination features to complete the extraction of complex surface information. From the above figures, it can be seen that the extraction effect is good.
We would use two feature combinations to compare the effect of classification by ENVI software. The first was the feature combination of spectral information, color feature information, and vegetation index information (no texture information). The second was a combination of spectral information, color feature information, vegetation index information plus Brownian motion-based fractal texture features (with texture information).
The ENVI software was employed and 8 types of training samples and test samples were selected from the images, including grassland, ponds, greenhouses, cultivated land, roads, residential areas, bare land, and crops according to the previous visual interpretation results. The principle of sample selection was to select pixels as pure as possible and to select as many samples as possible, and to include as many different manifestations of the type of ground object as possible in samples of the same type of ground object, because satellite images was taken on February 15, 2017, some arable land was still in a barren state, and the difference in water content in the arable land leads to complex situations such as different shades of color.
The first method: spectral features, color features, vegetation index feature
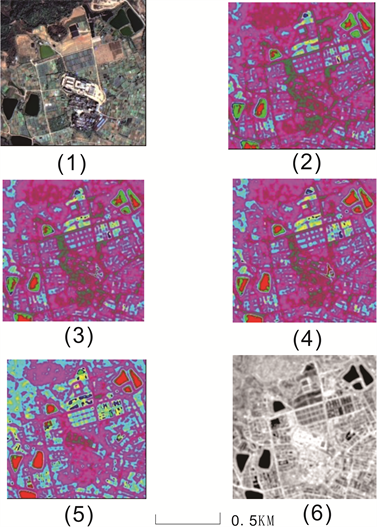
(1) True color synthesis; (2) Fractal texture density segmentation of band 1; (3) Fractal texture density segmentation of band 2; (4) fractal texture density segmentation of Band 3; (5) Fractal texture density segmentation of band 4; (6) fractal texture grayscale of Band 4.
Figure 2. Extraction renderings of fractal texture feature of Brownian motion.
![]() (1) HSV; (2) Classification of HSV; (3) NDVI; (4) EVI Index.
(1) HSV; (2) Classification of HSV; (3) NDVI; (4) EVI Index.
Figure 3. Intermediate results.
classification and accuracy evaluation (no texture feature). The effect figures are shown in Figure 4.
The second method: spectral features, color features, vegetation index, texture feature classification and accuracy evaluation (with texture features). The effect figures are shown in Figure 5.
After using the above two feature combinations to classify the research area, in the case that the training sample is consistent with the test sample, the first method involved spectral features, color features, vegetation index features (no texture features) classification method, and the total accuracy was 90.6460% (Table 1), the second method involved spectral feature, color feature, vegetation index, texture feature (with texture feature) classification method, and the total accuracy was 94.0892% (Table 2), which proved that the overall accuracy increased by 3.4432%, and the Kappa index increased by 0.0477 by the second feature combination method, after adding texture features. The time efficiencies of the above two feature combination methods were both high. Therefore, it can be proved that, the classification accuracy is improved in the feature combination method after adding the fractal texture feature based on Brownian motion. It can be seen that the extraction method of fractal texture feature of Brownian motion proposed in the paper can improve the classification accuracy of complex surface farmland in southern China.
5. Conclusion
The paper used Gaofen-2 as the data source, and took Dongguan and Shenzhen, Guangdong as the research area, to carry out research on the application of complex surface information extraction technology. The paper studied the method based on texture, color, vegetation index combined with support vector machine classification.
In this paper, fractal texture features, color features, vegetation features and spectral features of remote sensing images are combined to form a combination feature vector, which improves the dimension of the feature. This high-dimensional feature vector is more suitable for the support vector machine model, in which the high-dimensional feature vector can get a better hyperplane in the high-dimensional space, thus improving the classification accuracy.
The decision-making information content of combined features have been improved by the texture feature extraction based on the surface area fractal Brownian motion method, the k-means and HSV color feature extraction, and the vegetation feature extraction based on vegetation index and enhanced vegetation index, and the classification accuracy has reached 94.0892%, which is 3.4432% higher than the accuracy of 90.6460% without texture features. Compared with the traditional visual remote sensing interpretation method, the method improves the automation level and accuracy of remote sensing interpretation. It has been verified that the method is a reasonable choice when the research area is large and the time and budget are limited. It can improve the automation level
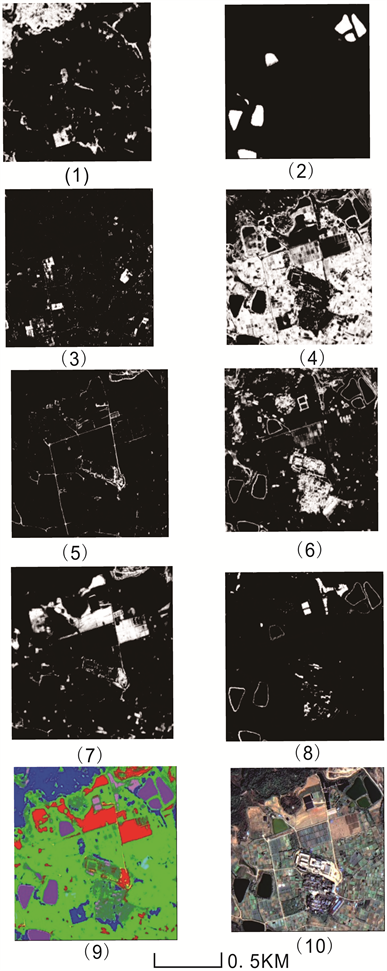
(1) The grass land; (2) pond; (3) greenhouses; (4) arable land; (5) highway; (6) Residential area; (7) Bare land; (8) crops; (9) Spectral feature, color feature, vegetation index feature classification effect map; (10) True color original image.
Figure 4. Classification effect diagram of the first feature combination method (no texture feature).
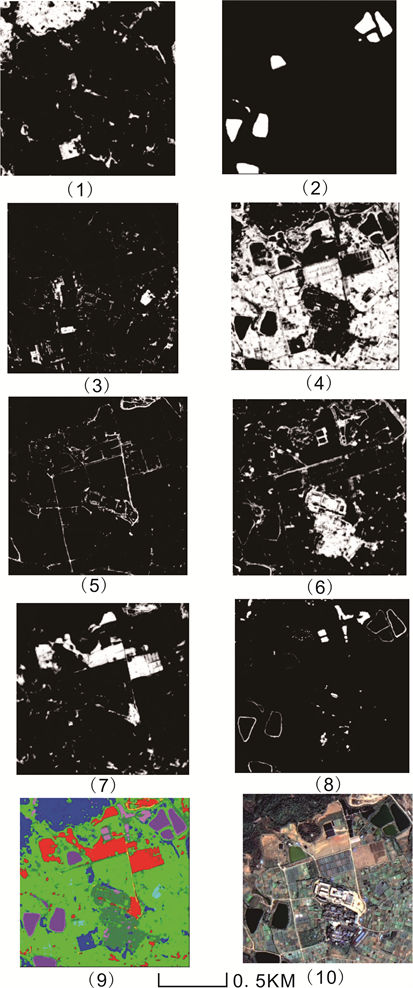
(1) The grass land; (2) pond; (3) greenhouses; (4) arable land; (5) highway; (6) Residential area; (7) Bare land; (8) crops; (9) Spectral feature, color feature, vegetation index feature classification effect map; (10) True color original image.
Figure 5. Classification of the second feature combination method (with texture feature).
![]()
Table 1. Confusion matrix accuracy evaluation of the first feature combination method (no texture feature).
![]()
Table 2. Confusion Matrix Accuracy Evaluation of the Second Feature Combination Method (with Texture Feature).
and extraction accuracy of information extraction of farmland remote sensing in complex surface areas. In the next step, the dimension of feature vectors can be further increased to improve the accuracy of classification. This method is suitable for generalization in complex surface areas.