Enhancement of East African Monsoon Long Rainfall (March to May) Variability from Weekly to Annual Scale by Climatic Extremes ()
1. Introduction
The Central East African Monsoon “EAM” plays a critical role in shaping the rainfall patterns of the region, particularly during the Long Rain (LR) season from March to May [1] . The variability of rainfall during this period is essential for agricultural productivity, water resource management, and overall socio-economic development. However, recent studies have indicated that the variability of EAMLR rainfall from weekly to annul is being amplified by climatic extremes posing significant challenges for the region’s vulnerable communities [1] [2] [3] [4] [5] . East Africa is not exempt from these changes, experiencing an increasing frequency and intensity of extreme climatic phenomena. The fluctuation of amplification from weekly to annual rainfall during East African LR can be related to climatic extremes such as heavy rainfall bouts and protracted dry spells [6] [7] [8] [9] .
The Central Eastern Africa region (−15˚S - 5˚N, 26˚E - 45˚E) has witnessed significant seasonal rainfall changes over the years [10] . Climate change is currently viewed as a component of global warming impact on Earth’s weather patterns and intensification of extreme events worldwide. Although there has always been climate change, the current changes are more rapid and not due to natural causes [11] . The observed increase in greenhouse gas (GHG) concentrations in the atmosphere has altered climatic feedback mechanisms posing a substantial threat to both human and ecological life [12] . While the globe warms by 1.2 degrees Celsius (34.16 degrees Fahrenheit), many of these effects are already apparent. There will be further effects and potential tipping points, such the melting of the Greenland ice sheet [12] . This has resulted in a new norm of unprecedented occurrence of extreme weather events such as droughts, floods, and heat waves [13] The scale of the impacts of extreme events varies, with drought dominating various economic sectors [14] [15] .
The impact of these extremes on the region’s rainfall variability is of great concern. Intense rainfall events lead to increased risks of flooding, soil erosion, and damage to infrastructure and livelihoods [16] [17] . Conversely, prolonged dry spells can result in water scarcity, reduced agricultural productivity, and increased vulnerability to drought-related disasters [6] . The amplified variability of LR rainfall poses challenges for water resource management, agriculture, and adaptation strategies that have traditionally relied on predictable rainfall patterns [18] [19] [20] . The knowledge of the underlying mechanisms driving the amplification of rainfall variability is crucial for effective adaptation and resilience-building efforts in East Africa [21] . Moisture transport mechanisms, temperature gradients, and patterns of atmospheric circulation that have changed,
play significant roles in modulating the occurrence of climatic extremes and subsequent fluctuations in rainfall [22] [23] [24] . These factors are influenced by global warming and its associated impacts on the regional climate system. Addressing the challenges posed by the amplified variability of LR rainfall requires robust adaptation strategies [19] . These strategies should encompass improved early warning systems, enhanced water storage and irrigation infrastructure, promotion of climate-smart agricultural practices, and sustainable land management approaches. Furthermore, regional cooperation and international support are vital for successful implementation of adaptation measures, knowledge sharing, and capacity building to enhance the resilience of East African communities to the impacts of amplified rainfall variability. In this context, this study aims to investigate the amplification of the weekly to annual variation of LREAM rainfall by climatic extremes. By examining the complex relationship between rainfall variability and extreme events, we seek to contribute to a deeper understanding of the challenges posed by changing climate conditions in the region. Ultimately, this research aims to inform evidence-based adaptation strategies and policies to ensure the sustainable development and resilience of East African communities in the face of amplified rainfall variability. The remainder of the paper is organized as follows: Section 2 expands on the data and methods utilized; Section 3 offers the results of the analysis; Section 4 presents a discussion of the results and conclusion.
2. Materials and Approaches
2.1. Observation and Model Data
FGOALS-f3-L, ACCESS-CM2, EC-ERTH3, and MPI-ESM1-2-HR, are the four modal data used in our findings, all of which are from Couple model Intercomparison Project Phase 6 (CMIP6) for both SSP2_4.5 and SSP5_8.5 scenarios that attained all of the daily rainfall in SSP2_4.5 and SSP5_8.5 experiments. Both scenarios are for 40 years from 2021 to 2060. This study also compared both scenarios experiment by calculating the multi-model ensemble mean (MMEM). Due to their exceptionally good performance, this model has been employed in earlier investigations [9] . And all variables from CMIP6 model outputs are analyzed with the original horizontal grid resolution of 2.0˚ × 2.0˚ and bilinearly interpolated over central east Africa domain as defined in Figure 1. The data are available at on: https://cds.climate.copernicus.eu/cdsapp#!/dataset/projections-cmip6?tab=form. For observational datasets, we use daily rainfall data from the Climate Prediction center (CPC) with horizontal resolve of 0.5˚ × 0.5˚ [25] . The daily rainfall data for Chirps version two reanalysis dataset with a 0.25˚ × 0.25˚ horizontal resolution satellite imagery and insitu station data [10] [21] . The dataset can be found on: https://cds.climate.copernicus.eu/cdsapp#!/dataset/insitu-gridded-observations-global-andregional?tab=form.
![]()
Figure 1. The simulated average and heavy rainfall and the mean rainfall, RX5day, and CDD, and R95pTOT is given for ((a), (d), (g), (j)) Chirps, ((b), (e), (h), (k)) CPC, and ((c), (f), (i), (l)) the MMEM of CMIP6 and SSPs. Grid locations with value added via dynamic downscaling are referred to as stippling in EnsMean.
2.2. Methods (Approaches)
Daily rainfall data from two regional climate models (SSPs) simulations were evaluated in the CMIP6 project for both scenarios in our study. The CMIP6 models are; FGOALS-f3-L, ACCESS-CM2, EC-ERTH3, MPI-ESM1-2-HR, HadGEM3-GC31-LL, and GFDL-ESM4; which have previously been employed in research due to their exceptional performance [26] [27] . The historical climate for 1991-2020 (HIST) and future climate for 2021-2060 were examined using the SSP4.5 (SSPS4.5) and SSP8.5 (SSPS8.5) emission scenarios, respectively. Due to a lack of rain-gauge data over East Africa, we compared the model outputs to two observation satellite data sets also has been used [9] . The CHIRPS-v2 reanalysis rainfall dataset at a horizontal resolution of 0.25˚ × 0.25˚ satellite imaging and Insitu station data, and the Climate Prediction Centre (CPC) has a horizontal resolution of 0.5˚ × 0.5˚ [21] [28] The Chirps and CPC statistics have been used widely and are regarded as a viable choice for testing climate model [29] [30] [31] .
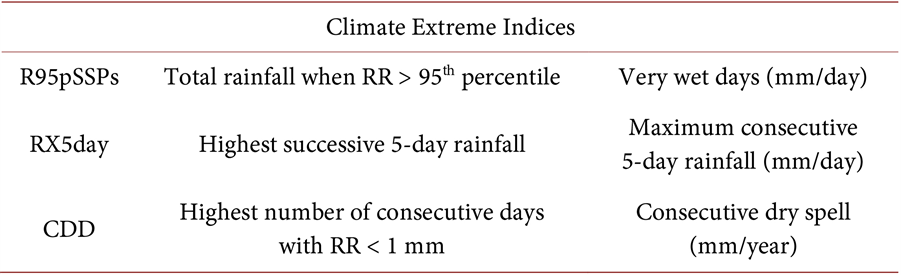
Table 1 summarizes the extreme rainfall indexes studied. All indices are recorded as daily rainfall data and are used by specialists and researches on climate variation detection and are widely used on detection, attribution, and forecasting of changes in climatic extremes. Those extremes are very wet days at R95pSSPs total, maximum consecutive 5 days rainfall (RX5days) and CDD-consecutive dry days. The mean rainfall for 1991-2020 and extreme rain catalogs for same period are evaluated using a shared period crosswise observations and simulations. And these extreme indices are calculated using the following equations.
2.2.1. R95p: Annual Total PSSPS When RR > 95th Percentile and R95p TOT: Contribution to the Rainfall from Very Wet Days
Let “RRwj” be the amount of rainfall that falls each day on a rainy day “W”, RR is greater or equal to 1 mm (≥1.0 mm) in period “j” and let “RRwn95” be the 95th percentile of rainfall that falls each day on wet days between 1991 and 2020. If “W” is the number of days during the time that were rainy [32] as shown in followings equation below.
(1)
(2)
Table 1. List and names of drought climate extreme indices.
 2.2.2. Consecutive Dry Spell (CDD)
Where CDD: highest length of dry spell average highest number of successive days with “RR” < 1 mm. Let “RRjk” be the daily rainfall amount on day “j” in period “k”. Tally the largest number of successive days where “RRjk” < 1 mm.
2.2.3. Maximum Consecutive 5-Day
Maximum successive 5-day rainfall (RX5day): Let “RRkj” be the rainfall quantity for the 5-day break finish “k”, period “j”. Then maximum 5-day values for period “j” are RX5dayj = max (RRkj). The ability of SSPs to improve in the current period was measured using the added cost approach developed by [33] , as shown in Equation (3):
(3)
Were the indices produced from observations (CPC), large-scale forcing (GCM), and SSPs, respectively, XGCM, XOBS, and XSSPs. In this view, the added worth, which is measured at individual network point, is positive when the SSPs models squared error is less than that of the equivalent global climate model; i.e., when the SSPs models improve the findings of the GCMs. Normalization is within −1 ≤ AV ≤ 1 [9] . We utilize the standard deviation (STD) rainfall, which is an animated statistic that can be used to define dispersion or variability, as mentioned in quantify rainfall variability [34] . The area-weighted averages for the East African domain were calculated after the climatic annual run for each model network was removed by deducting the 30-year daily rainfall average for each step. The drinkable daily anomaly rain for the LR monsoon season (March-May, MAM) was retrieved. The tuning between the past and projected rainfall (SSps4.5 and SSPs8.5) anomalies, as well as the STD of the drinkable daily mean for MAM rainfall anomalies, were measured for all used models and timeframe. We employ the rainfall for Coefficient of variation precipitation (CVP) provided in Eqn.4 below as an additional way to quantify the erraticism of rainfall.
(4)
where “SDP” is the rainfall standard deviation and “RFT” is the mean rainfall. When “RFT” approaches zero, “CVP” may become a problem [35] . Variation in the standard deviation of rainfall (SDP), in contrasted, may be argued to be an expected result of variation in the mean [36] . Using Equation (4) connection
(5)
The change Standard Deviation rainfall (SDP) is written as follow:
(6)
where RFTHIST and CVPHIST represent HIST, CVP, and ΔCVP and ΔRFT represent CVP and rainfall changes, respectively. ΔSDP1 denotes the portion of the SDP alteration and entirely explained by vicissitudes in rainfall average, whereas ΔSDP2 denotes the portion associated with changes in coefficient of variation. Equation (6) is particularly valuable since it quantifies the independent donations of variations in rainfall average and vicissitudes in CVP to variations in rainfall erraticism. We employed a perfect improvement owing the Clausius-Clapeyron “CC” connection to measure the effect of thermodynamic rises in atmospheric moisture content [37] . Lastly, the MMEMs of both scenarios—referred to as “EnsMean”—are used to remove inherent and systematic variability prejudices in the model affiliates.
3. Results
Prior to evaluating the CMIP6’s capacity models for both SSPs to recreation the historical Central East Africa March to May (MAM) rainfall variability and investigating the possible effects of climate change by the weekly to annual variability of EAM LR rainfall, we first evaluated the performance of three extreme climate models in simulating the mean total rainfall climatology, as presented in Table 1. We examined the daily mean rainfall of the LR season, very wet days at R95pSSPs total, RX5days, and CDD, as exposed in Figure 1 for CPC, Chirps observations values and for EnsMean values, as depicted in Figures 1(a)-(c), respectively. The regions with the highest rainfall levels within the Central East Africa region were found to be western Kenya, around Lake Victoria basin, LVB, southeast and coast of Tanzania, according to the CPC and Chirps observation data (Figure 1(a) and Figure 1(b)). While, Figure 1(c) demonstrates that EnsMean indicates the less rainfall values over the study region, these implies that we have reduction of the rainfall in our area.
We calculated the ability of EnsMean to realistically represent the spatial distribution of LR in Central East Africa and obtained results for climate extreme indices on daily total rainfall CCD, Rx5, and, R95pToT as illustrated in Figure 1(d) and Figure 1(g) and Figure 1(j), respectively. Specifically, Rx5, which represents the total rainfall when RR very wet rainfall greater than 1 mm, was discovered to be largely captured by Chirps and CPC observation data sets, with Ens Mean performing comparably within the range of 50% - 70% and 70% - 90%, respectively. To recognize dry days from rainy days, we examined highest possible number of waterless days around over the Rwanda, Burundi, western Kenya Eastern Tanzania and Uganda, as presented in Figure 1(d), Figure 1(e) and Figure 1(f).
In this research, we evaluate past and projected changes in the CMIP6 models’ daily rainfall variability for the LR season (March to May). Daily rainfall values were obtained from a 30-year climatology as explained in Figure 2. To analyze the daily variability for the MAM season, we used observations (Obs) and EnsMean from historical simulations spanning from 1991 to 2020, and the outcomes are displayed. in Figure 2(a) and Figure 2(b). Maximum rainfall centers are found around the coasts of Tanzania and Kenya, as well as the LVB, as illustrated in Figure 2(a). The Central East African region has significant daily
![]()
Figure 2. Rainfall variability over time, spatial pattern of Observation [Mean of CPC and CHIRPS Data] and MMEM standard deviation (SD) of daily MAM rainfall (mm/day) anomalies in historical simulations ((a), (b)), and change in SDP of MAM rainfall anomalies (%) from historical (1991-2020) to future (2021-2060) for ((c), (e), (f)) SSp4.5 and ((d), (f), (h)) SSp8.5.
rainfall variability. These regions are also having significant intense and high daily rainfall by its variability test. EnsMean, as exposed in Figure 2(b), reproduces observed rainfall variability accurately, albeit with a larger magnitude than Obs, particularly in coastal regions and the highlands area. The future (2021-2060) changes in daily variations in rainfall under both scenarios SSP-4.5 and SSP-8.5 are exhibited in Figure 2(c) and Figure 2(d). Owing to global warming, EnsMean predicts a 5% - 30% exceed the variability of daily rainfall across central East Africa. The SSP-8.5 scenario shows a greater magnitude and spatial scope of the consequences than SSP-4.5, even though the signal of the variation is almost similar in both scenarios. Ensemble members show significant inter-model agreement regarding the expected changes in EnsMean, with at least 80% of the models agreeing on the signal of the variation in most grid sites over East Africa, confirming the anticipated projected changes.
Also, we have analyzed the daily change of coefficient variability of rainfall (CVP) over central East Africa, from the historical timescale for the SSP-4.5 and SSP-8.5 as future scenarios (2021-2060), using Equation (4). Our results indicate that EnsMean predicts a 10% - 30% rise in daily CVP across much of central East Africa, with the greatest values appearing when rainfall (RFT) closes to zero in the Central East Africa area. We have observed that the projected changes have the same sign for both SSP-4.5 and SSP-8.5, but the extent of the variation is best in SSP-4.5. Our analysis of Figure 2(c) & d using Equation (4) has led to the breakdown of upcoming variations in Figures 2(e)-(f). We have found that the projected exceed in rain erraticism due to the mean rainfall variation (SDP1, Figure 2(e) and Figure 2(f)) is mainly concentrated in the coast region of Kenya and Tanzania, some areas of the LVB, and highland regions. The greatness and spatial rating of the changes are greater in SSP-8.5, but the signal of future changes is similar in both SSPs. We have also observed that the future variations in rainfall change according to CVP change (SDP2, Figure 2(g) and Figure 2(h)) are larger than the previously studied rainfall variability (Figure 2(c) and Figure 2(d)). The network points over East Africa exhibit an increase in variability, characterized by an increase in CVP. The SDP2 has the almost same signal in both SSP-4.5 and SSP-8.5 scenarios, but the strength of the shift is larger in SSP-8.5. Furthermore, the ensemble members have a lot of intermodal agreement, with at least 80% of the models agreeing on the signal of the variation at most grid sites over East Africa.
We look into the impact of thermodynamic component on variations in rainfall across different regions in East Africa. Additionally, we thoroughly evaluate all of the entire model range to determine whether comparable variations in rainfall would occur over various time frames. Figure 3 displays the percentage exceed in daily rainfall changes at different intervals and East African sub regions. Our findings reveal that EnsMean projects a gradual rise in variation of daily rainfall throughout all periods and East African sub regions. Furthermore, there is a notable amount of constancy, as evidenced by substantial model consensus across all sub regions and timescales. Although weekly to monthly timescales
![]()
Figure 3. The contribution of the thermodynamic element to regional variation in rainfall. Band-pass filtered of daily rainfall variations of % standard deviation for the synoptic (weekly), Monthly, Seasonal, and Interannual timescales across Central East Africa during (2021-2060) against the historical time slice (1991-2020). EnsMean bars for SSP/RCPs4.5 and (SSP/RCPs8.5) are shown in Yellow and Red.
show the greatest rise in future variations in rainfall over sub regions, there is still a significant intermodal discrepancy, particularly at the yearly scale. As such, as mentions in previous section, we project a fictitious increase in daily monsoon rainfall. We compare the distinction between the “CC” rainfall variability changes for SSP4.5 and SSP8.5 with the variations in rainfall change, to determine difference between the two SSPs (RCP’s). For all East African sub regions and all timescales, most models, including their EnsMean, simulate lower variations in rainfall change than anticipated from the idealized physical response (Figure 3), implying that the atmospheric contribution may be the primary factor influencing projected rain erraticism in East Africa.
Except for the Rwanda sub region at the synoptic timescale (weekly) under the SSp4.5 and SSp8.5 scenarios, where correlations are significant at the 80% level. The interseason and annul timescales as mentioned in Figure 4 that the variation is not a lot of correlation with the HIST rainfall. This lack of substantial positive correlations indicates that the variability in rainfall change across models is not associated with HIST rainfall variability intermodal spread. However, at most timescales, variations in rainfall change are significantly and positively linked to variation in the mean LR rainfall for each study regions (Figure 4). This statistically significant association demonstrates that variations in mean rainfall explain a portion of the intermodal variation in rainfall spread.
The CMIP6 SSP simulations indicate a significant increase in LR rainfall variability across central East Africa, which prompts further investigation into shift of extreme rainfall indices. Figure 5 presents the regional feedback of LR mean rainfall, CDD, RX5day, and R95pTOT to global warming, comparing the future time slice (2021-2060) to the historical era (1991-2020) under the SSP4.5 and SSP8.5 scenarios. The analysis reveals a 40% increase in average rainfall around the central and northwest of Tanzania, west Kenya, Uganda, Rwanda and Burundi, along with a 70% increase in RX5day and R95pTOT in the future. The expected changes are highly robust for mean rainfall and R95pTOT, with at least 80% of SSP members agreeing on the signal of the change for most grid locations. However, there is high intermodal spread for changes in RX5day and CDD, and the amplitudes of the projected exceed or less gap are larger under SSP8.5, possibly due to stronger forcing. These changes could potentially threaten the region’s water resources, the major economic of agriculture, and social stability with hydroelectric power generation, as future increases in EAM rainfall variability are linked to longer streaks of dry days and intense rainfall.
![]()
Figure 4. The relationship between variation in mean rainfall and variation in rainfall variability. Change in mean MAM rainfall (%) vs change in MAM rainfall inconsistency (%) from HIST (1991-2020) to SSPS4.5 and SSPS8.5 (2020-2060) for the weekly, seasonal, and annual timescales. (a), (d) and (g) are weekly, (b), (e) and (h) are season and (c), (f) and (i) are annual for both SSPS4.5 (2.4) and SSPS8.5 (5.8) in the central East Africa respectively.
![]()
Figure 5. Future modifications to average and extreme change (%) Climatology rainfall (Pr), CDD, Rx5day and R95ToTof MAM during 1991-2020. Modification for SSp4.5 (a), (b), (c) and (d) and SSp8.5 and (e), (f), (g) and (h) projected changes of multi-model ((a), (e)) daily rainfall, ((b), (f)) CDD, ((c), (g)) RX5day, and ((d), (h)) R95pTOT respectively. Stippling identifies grid points in EnsMean where at least 80% of the SSPs agree on the signal of the variation.
4. Discussion and Conclusion
4.1. Discussion
To gain a comprehensive understanding of the hydrological cycle’s rejoinder to universal warming impact, it is crucial to comprehend exceed in rainfall variability. This study examined changes in LR monsoon rainfall variability in East Africa from weekly to annual timescales, under the historical and the scenarios (SSP4.5 and SSP8.5) for future climate. By applying band-pass filtering, we isolated the erraticism at individual period and determined the range of standard deviations for the past climate in 1991-2020 and future climate (2021-2060) under the SSP4.5 and SSP8.5 scenarios. Our findings suggest that future changes in the variation coefficient and partial owing to vicissitudes in the average value rainfall would lead to a rise in the daily rainfall variability in East Africa. Most of the sub regions with various timescales, there are small changes but it’s totally change from HIST. For long durations, especially annually, a slight intermodal spread is noticeable, showing the uncertainty of projections. The study also discovered that, over most of central East Africa region with various timescales, variations in rainfall change are not significantly connected with the HIST rainfall variability. Otherwise, for each region, increases in mean MAM rainfall are significantly positively linked with variations in rainfall change at weekly scale. Moreover, the projected rainfall intensity variability is associated with the exceeding of mean rainfall over LVB and the coastal region, as well as increased extreme rain over Central East Africa area. The majority of EnsMean indicates small changes in predicted variations in rainfall around the Central East Africa region than predicted by the perfect local atmospheric reaction at all timescales. This suggests that the potential impact of the atmosphere is the most important determining factor. EnsMean’s application greatly reduces the degree of doubt in our findings, and the study results are generally consistent with rainfall variability signal and associated extreme events study can be used as reliable source of scientific basis for East African regional adaptation and development strategies.
4.2. Conclusions
In conclusion, this research has provided valuable insights into the variability of rainfall in Central East Africa, emphasizing the following key points:
1) The evaluation of climate models revealed variations in their ability to capture rainfall patterns, with EnsMean generally performing well but indicating lower rainfall values compared to observation data.
2) The study projected future increases in daily rainfall variability, driven by global warming, with greater magnitude and spatial scope under SSP-8.5. This has significant implications for the region’s climate.
3) Changes in CVP indicated increased variability in rainfall, particularly in regions with minimal rainfall. These changes were consistent across both SSP scenarios.
4) The analysis suggests that atmospheric factors may be the primary drivers of projected rainfall variability in East Africa.
5) The findings have important implications for water resources, agriculture, social stability, and hydroelectric power generation in the region, as increased rainfall variability is associated with longer dry periods and intense rainfall events.
Overall, this research contributes to our understanding of climate dynamics in Central East Africa and underscores the urgency of addressing climate-related challenges in the region.
Acknowledgements
The first author is grateful to acknowledge the support from the Chinese Scholarship Council (CSC), the World Meteorological Organization (WMO), and the Rwanda Meteorology Agency for helping him in his PhD degree studies at Nanjing University of Information Science and Technology. Especially My Prof Zhu Weijun for supervising me to complete this work. The authors acknowledge the cooperation of the earlier authors referenced in the piece as well as the institutions that provided the data used in the analysis.