Regression Modelling of Electricity Distribution Statistics and Stock Exchange Market Capitalisation in a Developing Country: Evidence from Botswana (2012-2021) ()

1. Introduction
The relationship between stock market capitalisation and electricity distribution is of immense importance and interest to finance and accounting professionals when it is juxtaposed against the energy distribution into an economy that is pivoting itself towards industrialisation and aiming to reduce dependence on mining and tourism. Botswana’s dependence on mining and tourism is as well documented as it is problematic [1] [2] [3] . Total market capitalisation is an important indicator of progress towards industrialisation, if share issues, share splits, delistings from the stock exchange, mergers, and acquisitions, share ownership concentration and initial public offerings (IPOs) are not considered. The justification to remove stock market factors such as new share issues, suspensions, share splits, new listings through initial public offerings (IPO), delistings from the stock exchange, mergers and acquisitions and other factors that affect stock market capitalisation from the regression model are that, a multiple regression would have required consideration of these variables and the use of advanced means of factoring outliers such as the mean absolute deviation, trimmed means or boxplots [4] [5] .
On the other hand, electricity generation and its attendant challenges, least of which is the global trend towards renewable and sustainable energy sources [3] are assumed to be a given and a long-term aspiration for a third world country such as Botswana. These are part of the strategy support to Botswana by continental financiers such as the African Development Bank (ADB) to increase electricity generation in the country over the next 20 years with initiatives such as 1) Biogas Pilot Project; 2) Rooftop Solar Photovoltaic Program; 3) Off Grid Solar Program among others, whereby, on a least cost basis, solar photovoltaic (solar PV) was found to be on the low cost of a spectrum with light fuel oil (LFO) on the highest cost end of the spectrum [6] .
Currently, Botswana imports substantial electricity from its giant economic neighbour South Africa [7] , and the historical relationship between electricity distribution and total market capitalisation can be used to model the status quo and predict short-term patterns of market capitalisation to inform researchers and policymakers on the impact of distribution of energy into the economy. As of year-ended 2021, the Total market Capitalisation of the Botswana Stock exchange as percentage of GDP was 208.5, down from 240.3 in 2017 [8] .
1.1. Background
National electricity energy in Botswana is generated from a sole coal-fired power plant with four units with an installed capacity of 33 MW at Morupule Power Station in central Botswana [7] . Botswana’s stock market, the Botswana Stock Exchange (BSE), is split between two groupings, Domestic and Foreign, with two separate indices for each. Market capitalisation figures are produced in an annual report by the demutualised bourse for four quarters in the year covering the Domestic and Foreign sections with a total market capitalisation for each quarter. The BSE has been highlighted as one of the best-performing stock markets, averaging 24% return over a 10-year period [9] .
The overview of the electricity distribution (in megawatt hours (MWH) in Botswana from 2012 to 2021 by year and quarter together with the Botswana Stock Exchange (BSE) total market capitalisation figures (in millions of Pula) is charted as below.
The dual coordinate chart is a combination of electricity distribution (in MWH) on the right vertical (or y) axis in (Pm) and market capitalisation on the left vertical (second y) axis in millions of Pula. Dual axis charts are useful in presenting different kinds of information on the same chart. In the chart, dual lines representing electricity distribution statistics (in MWH) together with a line representing total market capitalisation are plotted together, with the periods from 2012 to 2021 on the horizontal axis, additionally represented with four quarters in each year. The four quarters in each year are, 1) Q1―January to March; 2) Q2―April to June; 3) Q3―July to August; 4) Q4―September to December.
Chart 1 shows an interesting visual relationship between total stock market capitalisation and electricity distribution, with market capitalisation dipping from the third quarter of 2017 to below P420,000m and not having recovered to its previous highest level of P422,000m in the second and third quarters of 2012. Electricity distribution on the other hand has only just recovered from quarters 2, 3 and 4 of 2014, which achieved highs of above 1 m MHW.
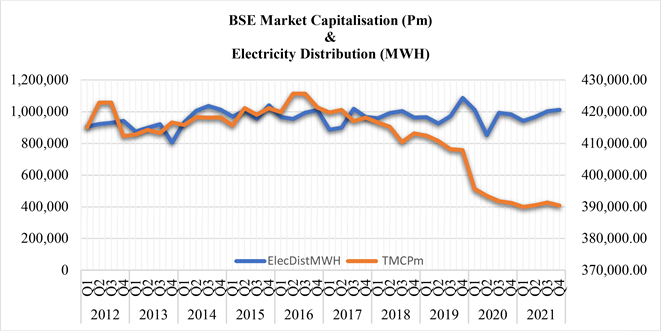
Source: Compiled from [7] and [8]
Chart 1. Overview of Botswana stock market capitalisation (Pm) and electricity distribution (MWH).
1.2. Research Aim
The research aims to explore the linkage or relationship between electricity distribution and stock market capitalization in Botswana. The justification for this is that since the stock exchange market capitalization is a measure of the total value of all listed companies on a stock exchange, it is an important indicator of a country’s economic performance and investor confidence. By analysing the relationship between electricity distribution and stock market capitalization, the research seeks to gain insights into how developments in the electricity sector can influence the overall economic growth and investment climate in Botswana.
The research objective is to use the official data from the Botswana Stock Exchange annual reports and electricity generation data from the parastatal organisation charged with the mandate to collect and disseminate all official statistics in Botswana to model a regression formula to predict the relationship of electricity generation on total stock market capitalisation.
1.3. Research Gap
While research from other parts of the world such as Brazil has applied Modern Portfolio Theory (MPT) to electricity systems [11] , a global perspective to forecast electricity generation potentials until 2050 shows that projected growth trend of various electricity generation technologies, including biomass, marine, onshore, and offshore wind, solar photovoltaic, concentrating solar power (CSP) technologies, nuclear fission, geothermal and hydropower, will result in production of sufficient energy to meet global demand, even considering fossil fuel [12] which include coal. Coal is a crucial element of Botswana’s current electricity generating means.
From this perspective, even though the generating trends globally might indicate a shift towards more renewable energy sources, the generating profile of
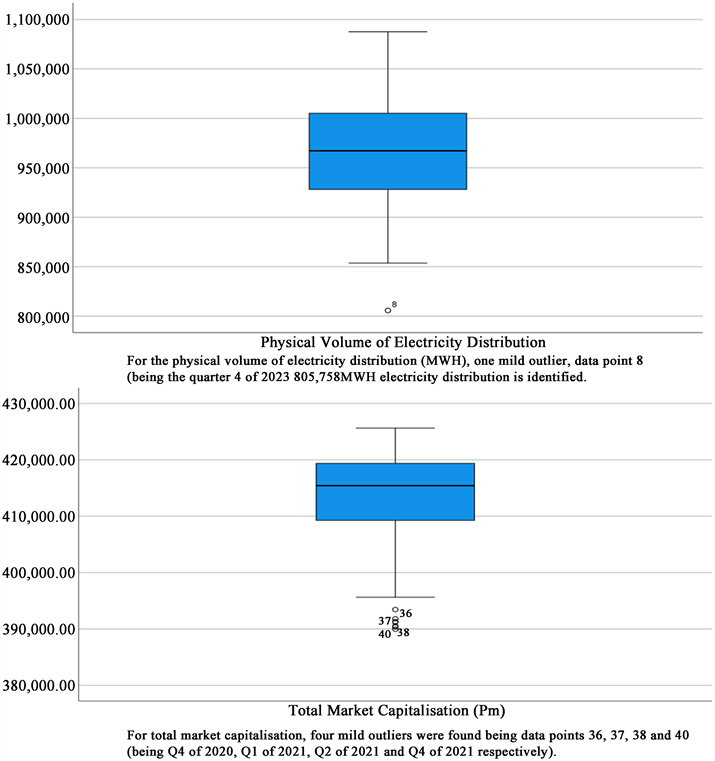
A boxplot visual illustration [10] of whether the distribution of the two datasets for electricity generation and total market capitalisation to ascertain whether either is positively or negatively skewed is shown here. The five number summary of; 1) minimum value that is not an outlier, represented by the bottom of the vertical line (whisker) that extends from the bottom of the box; 2) first quartile (Q1), the value below which 25% of the values in the data set are found; 3) median, the value that separates the higher half of the data set from the lower half; 4) third quartile (Q3), the value below which 75% of the values in the data set are found; 5) maximum value that is not an outlier, represented by the top of the vertical line (whisker) that extends from the top of the box; 6) interquartile range (IQR), the box in the boxplot, being the middle 50% of the data set (between Q1 and Q3), is used [10] . Mild outliers are values that are more than 1.5 × IQR below Q1 or above Q3 and are represented by circles. No extreme outliers, that is, values that are more than 3.0 × IQR below Q1 or above Q3 were identified in both the electricity distribution (in MHW) and the total market capitalisation figures (in Pm) (Figure 1).
Figure 1. Box plots of electricity generation and total market capitalisation.
Botswana is assumed to remain dominated by fossil (coal)-based fuel. Research linking finance, through stock market capitalisation and electricity distribution (albeit with imported electricity dominated by South Africa, which uses some nuclear fuel in generation), is an area of academic research that shows a gap that this paper attempts to address.
A potential research gap can be identified in the limited literature or empirical studies that specifically explore the relationship between electricity distribution statistics and stock exchange market capitalization in the context of a developing country like Botswana. While there may exist studies examining the relationship between electricity distribution and economic indicators or stock market performance in developed nations, there is a scarcity of research that focuses on this relationship in the specific context of a developing country such as Botswana. Botswana, as a developing country, presents a unique set of circumstances and challenges that may influence the relationship between electricity distribution and stock market capitalization and the result of similar studies from developed nations might not be a true representation of what is obtainable in Botswana. Thus, conducting a research study in this light is pertinent.
Hence, addressing this research gap could provide valuable insights into the dynamics and interplay between electricity distribution and stock market performance in a developing country context. It may also shed light on the specific factors and mechanisms that drive or hinder the relationship, offering policymakers and investors a better understanding of the implications and potential strategies to enhance both electricity distribution and stock market development in similar contexts.
1.4. Conceptual Framework
The research does not consider the technical elements of electricity generation. There is an appreciation however that electricity generation might not be able to meet electricity demand. In this instance, there could either be load-shedding to match demand with generation. Load-shedding is undesirable to consumers. Another option could be to augment generation with imports or allow some non-utility players to generate electricity and feed it into the national grid.
Botswana has substantial electricity imported from the Zambia Electricity Supply Corporation Litmited (ZESCO), Electricidade de Mozambique (EDM), Southern African Power Pool (SAPP), Nampower (Namibia) and Eskom (South Africa) [8] . The country’s efforts to generate adequate electricity to satisfy local demand has been reported as being on a downward trend when reported in a linear fashion, showing a decreased reliance on electricity imports [8] . This reported trend is not tested as only electricity distribution, mediated by imports has been included in the conceptual framework in Figure 2.
This research framework focuses on the distribution stage and attempts to directly relate this directly to stock market performance. The mediating role of electricity imports is considered as that of augmenting local generation and imported electricity is assumed to beef up local generation and augment total electricity distribution.
![]() Source: Author’s compilation (2023).
Source: Author’s compilation (2023).
Figure 2. The mediating role of electricity imports (conceptual framework).
1.4.1. Electricity Generation, Distribution and Import Challenges
While electricity access has been reported to have increased in Botswana, with generation shortfalls met by imports, security of power supply has been identified as an imperative due to the challenges faced by Botswana which include the substandard performance of the sole coal-fired generation infrastructure, an unreliable electricity import situation caused by regional shortfalls, and lack of independent power producers (IPPs) [3] . In the 2036 vision of the African Development Bank’s (ADB) and country strategy to transform Botswana into a high-income country, generation, transmission, and distribution of clean power are one the three major activities alongside others dealing with water and transport.
1.4.2. Prosumers
The technical aspects of electricity generation are beyond the scope of this research, but the assumption (see Conceptual Framework in Figure 2) is that any shortfalls in electricity generation and demand by consumers are met by electricity imports to augment the total electricity distributed in the country. There are potential “prosumers” in the network, who are both producers and consumers [13] [14] with micro-generating capabilities, or huge local prosumers that might even be able to feed into the distribution network.
2. Prior Research
Theoretically, energy price fluctuations evidence, where energy is taken in a wide sense to include oil, has been linked to aggregate economic activity so as to inform policy [15] . Some of these economic theories and models include “Classic Supply-Side Shock”, “Income Transfers and Aggregate Demand”, and the “Real Balance Effect” [15] . Income Transfer, whereby purchasing power shifts from oil importing nations to oil-exporting nations, reducing customer demand, was found to explain both situations as observed, inasmuch as monetary policy can partly balance out the effect of the reduction in aggregate demand. Botswana is an oil importing nation, in as far this is a form of energy, and additionally imports electricity energy so the theories by [15] can be assumed to hold for the country.
Market capitalization is a function of quantities of stocks or shares and prices of listed equities [16] , in 17 advanced economies studied, [16] found that long-run stock market growth as far back as the 1870 to the 1980s was driven by issuances and trends showing market capitalisation growing in line with GDP, whereas recent expansion has been attributed to rising prices, showing a structural break caused by profit, with firm profit and capital income doubling to all-time highs in 146 years. Other economic and firm level research linked to market capitalisation involved using time series forecasting for the Standard and Poor (S&P 2500) through financial turbulence with autoregressive models, moving averages and normal Dynamic Linear Model [17]
2.1. Electricity Energy and Economy Research
Some research approaches on the impact and relationship among energy price (shocks), the stock market and the macroeconomy at country and economy level in China, Mexico and Indonesia has found evidence that when crude oil prices rise, as measured both by the West Texas Intermediate (WTI) and Brent, fluctuations in the international market arise and cause energy price rises for coal and electricity and general decrease in economic growth [18] [19] [20] [21] . Using auto-regression, [18] found that a mere 1% rise in the energy price index can cause a depression in the stock market index by 0.54%. Benefits of private participation in renewable energy have been researched in Ghana [22] . While some of the approaches focused on prices, the approach in this research will go back in the value chain to actual production and employ electricity generation and distribution statistics to investigate what impact and effect these have on stock market performance.
2.2. Stock Market Research in Africa
Research on stock markets in Africa has focused on the comparative stock market response to Covid-19 in Botswana and Ghana [9] . Budget deficits as a macro indicator were used to assess the performance of stock markets in Africa over a period from January 2000 to December 2017 [23] . Using data from the World Bank Development Indicators, the Association of Security Exchanges in Africa and International Monetary Fund Statistics while holding other factors constant, increases in budget deficit were found to have had negative effect on stock market performance.
2.3. Energy (Including Electricity) Empirical Research
Data envelopment analysis using linear programming has been used to investigate the efficiency of large numbers of 41 individual electricity generating and distribution companies with respect to their technical or allocative efficiency linked to their profitability and own stock market performance [24] over a period of five years, while electricity consumption, and perhaps not necessarily distribution, was found to be strongly correlated to economic activity, albeit disturbed by natural disasters and Covid-19, with daily consumption data in Bangladeshi [25] . Electricity price changes were found to have an asymmetric relationship to the Borsa Istanbul 100 index and its sub-sector indexes using non-linear autoregressive log models over a period from June 2006 to February 2008 [14] .
On the African continent, and for Botswana in particular, energy consumption and generation trends over 13 years were used to try and forecast demand to check if the planned installed capacity increase to 1332 MW, would satisfy the country’s energy demand with 100% access [26] . As far back as 2014 the significant increase of imports and/or load shedding to meet demand was forecast.
This research intends to add to this research from a separate perspective to come up with a model to forecast stock market performance in the as yet unreported 4 quarters of 2022, as measured by market capitalisation, from power distribution trends. This “benefit of hindsight” is occasioned by the already substantial mediating effect of imported electricity (see Conceptual Framework in Figure 2). The current proportion of physical volume of imported electricity in Botswana as a percentage of physical volume of electricity distributed is 25% (1,091,768 MWH/ 4,265,164 MWH) for 2022 with Eskom (South Africa) accounting for 42% of this in the Fourth Quarter of 2022 [7] .
3. Methodology
The methodology employed for this research is simple regression modelling. A total of 40 samples of data paired by corresponding year and quarter from 2012 to 2021 was collected from independent sources [7] [8] .
3.1. Introduction and Overview of Independent Sources
The Botswana Stock Exchange (BSE) is the sole stock exchange for Botswana mandated to operate and regulate the securities market in the country. It was initially set up in 1989, transformed by legislation into a full exchange in 1994 and demutualised in December 2018 from its prior set up of ownership by stockbroker members into a for-profit public company limited by shares and registered under the Companies Act owned by the government of Botswana. The BSE is affiliated with the World Federation of Exchanges (WFE), is partnered with the United Nation’s Sustainable Stock Exchange (SSE) initiative and a recognised exchange under the United Kingdom’s His Majesty’s Revenue and Customs (UK HMRC). It operates 1) a main board; 2) venture capital market board; 3) exchange traded funds board (EFT board); 4) government and quasi-government boards board; 5) over the counter (OTC) board; 6) exchange traded fund (ETF) board with securities. The HMRC classifies the BSE as a “whole market” [8] .
Statistics Botswana is an autonomous parastatal organisation with roots in the Central Statistical Office prior to a change in law (Statistics Act of 2009). It is mandated to collect, process, analyse, publish, and disseminate official statistics on all sectors of Botswana as well and to develop and maintain a national database that can facilitate statistical analysis, among other duties, in addition to coordinating the National Statistical System (NSS) [7] . It is thus the foremost authority and source of official statistics in the country.
3.2. Modelling Procedure
The procedure outlined below was followed to come up with a regression model for predicting total stock market capitalization from available electricity distribution statistics. Table 1 shows the description and measurement of variables.
Step 1:
Regression analysis―Simple linear regression
Simple linear regression is a model with a simple explanatory variable, that is,
where:
y = response (dependent) variable
β = slope (or coefficient)
x = predictor (independent) variable
a = estimated intercept/constant term (or y-intercept)
For the purpose of this research these are respectively, y = total market capitalisation, and x = electricity distribution.
![]()
Table 1. Description and measurement of variables.
Source: Author’s compilation (2023).
Assumptions
To assist in carrying out the regression modelling, assumptions made are as follows:
1) The dependent and independent variables should be measured at the continuous level, in that they should be interval or ratio variables.
2) A linear relationship between the two variables, as measured by correlation, should not be zero.
3) Data used should show homoscedasticity, meaning that the variances in the data along the line of best fit should remain similar when moving along the line.
4) Data must have independence of observations.
5) No significant outliers should be in the data so as to protect the residual and make the prediction outcome valid and lastly.
6) The residuals (or errors) of the regression should be approximately normally distributed.
Data is tested (see datasets in Appendix 2 and Appendix 3) with a sample size of 40 pairs (n = 40) of independently observed and recorded data by the Botswana Stock Exchange and Statistics Botswana over matching quarters in the ten-year period from 2012 to 2021.
Step 2:
The tests for assumptions 1, 2 and 3 above were performed outside of the actual regression analysis procedure.
Step 3
Assumptions 4, 5 and 6 were performed simultaneously with the regression analysis.
Predictive Modelling
Predictive modelling can therefore be carried out to use available data for y and x to determine the slope and the constant term a (y intercept) to come up with a useful model to predict changes in electricity distribution and how they influence total market capitalisation.
To test assumption 4, generally, independence of observations is tenable if the Durbin-Watson test is not less than 1 or greater than 3. In most cases, the minimum standardised residuals should not be less than −3.39 and the maximum standardised residual should not be greater than +3.29.
No outliers were found, and the case-wise diagnostics table was not produced. Therefore, assumption number 5 is satisfied and tenable. Assumption number 6 was tested by using the histogram and P-P plot. The histogram and normal curve look like a bell curve as shown in Figure 3.
The histogram helps to determine if the size of the residual is constant across the entire dataset or not.
The histogram of regression standardised residuals with an embedded normal curve shown is used to determine whether the regression residual or error associated with the model is approximately normally distributed or not. This is meant to satisfy assumption number 6 above. From a visual inspection of the histogram and curve, there is an appropriate approximation of normal distribution
on the regression residual.
The P-P plot is meant to compare the distribution of data in several theoretical models [27] . Approximate fit of data to the y = x line is ideal, to show through the plot that distributions of data are symmetrical according to their kurtosis, meaning that the treatment (independent) variable distribution and the control (independent) distribution, have both been transformed to a scale that shows distribution uniformity on the unit interval [27] [28] .
Where there is visual similarity to a distribution that is uniform, there is a suggestion that data is well truncated, meaning that both small and large values have been excluded. The data points in the P-P plot in Figure 4 show very close distribution along the 45-degree curve. This was partly assured by use of natural logs (LN) to remove large and small values.
Unlike wide belief, the homoscedasticity assumption is more crucial in assessments of normality of validity of ANOVA [29] . The size of the residual does appear constant across the dataset (Figure 5).
3.3. Presentation of Findings and Interpretation
Table 2 below shows that mean of total market capitalization at LN value is 12.9278 while the mean of the electricity distributed (LN value) is 13.7760 with standard deviations of 0.02675 and 0.05861 respectively (n = 40).
There is no significant relationship between electricity distribution and market capitalisation when using correlations. (Table 3)
The r = −0.094 is showing a negative relationship between the dependent and the independent variables. While a Pearson correlation analysis can be used to understand the relationship among and between variables [30] , this is not ideal for modelling or making conclusions in this case.
Table 4 confirms that, the only predictor in the model is confirmed as
![]()
Table 4. Variables entered/removed.
aDependent Variable: TMCPmLN; bAll requested variables entered.
electricity distributed (after conversion to a natural log) and that the method applied was enter, with the dependent variable being total market capitalisation (converted to a natural log).
All requested variables requested were entered.
4. Findings and Discussion
The section below discusses the findings, starting with the model summary, then moving on to the residual statistics, analysis of variance (ANOVA), and coefficients, leading to the conclusions that are drawn from the findings.
4.1. Model Summary
Generally, independence of observations is able to be maintained if the Durbin-Watson test result is not less than 1 or greater than 3 [31] . The Durbin-Watson statistic (d = 0.119) is less than 1, which implies that the assumption that the data on total market capitalisation and electricity generation have independence of observations.
The Durbin-Watson statistic detects first order autocorrelation in a series, and it is important, in model building, to stress the assumptions employed [31] . General assumptions on the items and issues that were not considered in this research, together with specific assumptions on the model being build have been stated.
Nonetheless, because the bodies charged with collecting and reporting stock market capitalisation [7] and electricity generation statistics [8] are independent legal entities, the tenability of the assumption of independence of observation is nonetheless upheld. In addition, Statistics Botswana does not itself distribute electricity.
As shown in Table 5, the R is = .094 (as the correlation) while the adjusted R2 is −0.017 (converted to a % as −1.7%). This low adjusted R-squared might make the regression model questionable as to whether it is a good fit and representation of the variable, nonetheless, more robust methods that could factor in any effects of outliers are covered in the proposed further research section below.
The residual statistic in Table 6 shows that the minimum standardised residual is −2.166, which is not below the lower limit of −3.29. The maximum standardised residual is 1.250 which is not above the upper limit of +3.29.
4.2. Robustness Test
To ascertain whether the result of the regression analysis is reliable, a follow-up
aPredictors: (Constant), ElecDistMWHLN; bDependent Variable: TMCPmLN.
![]()
Table 6. Residual Statistics. As outlined in the assumptions above, the minimum standardised residual should not be less than −3.39 with a maximum of standardised residual not greater than +3.29.
aDependent Variable: TMCPmLN.
![]()
Table 7. ANOVA. The ANOVA table below (F = 0.340, p-value of 0.563), shows that the F statistic indicates an insignificant correlation between the dependent variable and the independent variable. (Table 7)
aDependent Variable: TMCPmLN; bPredictors: (Constant), ElecDistMWHLN.
test to check robustness of the model and analysis was conducted. ANOVA is not applied to evaluate the robustness of the model in this case since unless there is a small sample size, some suggestions are that n = 50 or less, normality can be ignored when applying ANOVA [29] .
Nonetheless, the hypotheses applicable to this regression are:
Null hypothesis―there is no linear relationship between total market capitalization and electricity distribution measures.
Alternative hypothesis―there is a linear relationship between total market capitalization and electricity distribution.
From the above, the most crucial value in the ANOVA table above is the significance value. The ranges for the p-value are (at 95% confidence level) p less than or equal to 0.05 which is adequate to reject the null hypothesis and accept the alternative hypothesis.
If the p value is greater than 0.05, the null hypothesis should be accepted and the alternative hypothesis rejected. The result of value p = .563 is greater than the p-value 0.05 so the null hypothesis should be accepted (Table 8). In other words, there is no linear relationship between total market capitalization and electricity distribution, since,
β = −0.043
a = 13.520
5. Conclusions
The model planned for predicting total market capitalisation using electricity generation statistics was
where:
y = response (dependent) variable
β = slope (or coefficient)
x = predictor (independent) variable
a = estimated intercept/ constant term (or y-intercept)
From the findings above this means, therefore, that;
aDependent Variable: TMCPmLN.
β = slope (or coefficient) is = -0.043
a = estimated intercept/ constant term (or y-intercept) is = 13.520
Such that
The prediction model above can be applied to predict total market capitalisation under the same general (research and data) and specific simple regression modelling assumptions as above in the procedure outlined.
5.1. Practical Implications
The result above can be used to predict market capitalisations for Q1 - Q4 for 2022 which were not yet published at the time of writing. Employing the inverse of the natural logarithm and using the exponential function in MS Excel (the EXP function), and applying the regression model above, the prediction for Quarters 1 of the 2022 Botswana Stock Exchange (BSE) was predicted to be Pm410,732.37 (see Appendix 1 and Appendix 2).
By substituting the formula
We find that (using the natural log of electricity distribution for Q1 of 2022, which was 1,005,505 MWH) [7] .
Also see Appendix 1 below. As this is based on a natural log (LN), reversal of the log is required. The exponential (EXP) of the natural log (LN) 12.93 is 410,732.37 being the target independent variable of total market capitalisation in (Pm) for Q1 of 2022 (P410,732.37 m). This is then compared to the actual recorded and reported market capitalisation of P 388,177.6m and repeated for the 2022 data for Quarters 2 through 4 with data now available at the time of publication.
This compares very well to the predicted value of market capitalisation from the model with a variance of only −P22,389.53m (or 5.77% rounded up to 6% for Quarter 1 of 2022 when the variance is expressed as a percentage of the actual [8] , or 5.45% as a percentage of the predicted total market capitalisation.
At the time of finalising the research, the BSE annual report for 2022 was not yet out, an update became available at the time of publishing [8] , allowing a comparison the total market capitalisation of the BSE for the four quarters in 2023 to a similar period for 2022 (see Appendix 1).
5.2. Research Contributions
In the context of a developing and emerging economy in Sub-Saharan Africa, market capitalisation and electricity distribution have not been researched and modelled with regression analysis prior. The predictive statistical analysis in this paper highlights a research theme that is relatively novel and niche. On reflection, in attempting to introspect, the author looked through their prior work experience working for an electricity generating company and their professional accountancy training, including some working knowledge of statistics, but the thought processes that must have been at play are captured eloquently by [32] . Through a comprehensive integrative review of literature, they highlight the tensions individuals experience in coming up with novel, useful and implementable ideas while bringing some uniqueness to their endeavours. The section below suggests some theoretical and research implications and suggested future research.
5.3. Theoretical/Research Implications
Some theoretical and research implications arising from this research are that a relationship between electricity distribution in an economy is a variable macro-economic indicator that can be used to model another macro-economic indicator of performance (total stock market capitalization). While the statistical model developed uses only simple regression, more robust and sophisticated analysis that holds fewer factors that influence the target variable, total market capitalisation constant, could be modelled with finer-grained independent sources of data with more data points for analysis and modelling.
5.4. Suggested Future Research
Future research could focus on a finer-grained analysis of high-energy demanding companies, perhaps in the mining, energy, manufacturing sectors and how their relative electricity demand might be indicative of a more nuanced link between electricity generation and distribution and economic activity in the extractive and manufacturing sectors as measured by their sectoral market capitalisation.
The use of Median Absolute Deviation (MAD) is suggested. MAD is a robust measure of dispersion that is less affected by outliers compared to traditional measures like standard deviation [33] . MAD is calculated as the median of the absolute deviations from the median. Outliers can be identified as data points that fall beyond a certain threshold, as a multiple of the MAD. Other methods that could be attempted are the trimmed mean with boxplots analysis. An alternative could be use of a trimmed mean which is calculated by excluding a certain percentage of extreme values from both ends of the data distribution [4] [5] . This approach reduces the influence of outliers on the mean estimate, making a more robust model. The percentage of data to be trimmed would depend on the specific characteristics of the data and the desired level of robustness. Boxplots that provide a visual representation of the data distribution, including information about the median, quartiles, and any outliers [5] have been used above. A few outliers were identified as data points that fall outside the whiskers of the boxplot, which typically extend a certain number of interquartile ranges (IQR) from the lower and upper quartiles. Boxplots help in detecting outliers and understanding the spread and symmetry of the data.
Another suggestion for future research is to include Price/Earnings (P/E (x) ratios, Dividend Yield (%), and/or Price/Book Value (x) in the model as this might be a proxy indicator of the importance of listed companies to the general economic output as perceived by the demand for their shares by the investing public. These indicators of value statistics are provided by the BSE and for the P/E ratio particularly for example, for the market, the BSE computes this by dividing market capitalisation by total earnings (profits) of listed companies [8] . Monthly contributions to the BSE market capitalisation can also be used with the electricity generating statistics to check the findings of this research using more data points.
5.5. Limitations
The paper used the overall Botswana stock market performance and did not attempt to exclude listed companies that might have a lower reliance on electricity generation and distribution. Service companies that are listed on the BSE include banks, insurance companies, supermarkets/ retailers (domestic), while the foreign counter includes financial services providers, sales, merchandising, warehousing, distribution, and debtors’ services providers. The distinction on type of company and their relative electricity demand was not attempted. The limitations above do not affect the relevance and applicability of the findings in this study as simple regression was attempted, without adding more variables as for multiple regression and also that the findings are explorative of a research area and relationship that has not, prior to this research, been attempted.
Appendix 1. Estimated Total Market Capitalisation of the BSE for Q1 of 2022
The model
is applied first to the natural logs (LN) as follows for Quarter 1 of 2022
yielding
resulting in
(natural log)
then using the Microsoft Excel exponential function = EXP (12.925697) to 6 decimal places yielding Pm410,732,37 (total predicted market capitalisation in Pula (millions). This is then repeated for the remaining 3 quarters of 2023 above showing variances between predicted and actual capitalisation lower than 6% across all the remaining quarters.
Key: ElecDistMWH―Electricity Distribution (mega-watt hour); EstimatedTMCPmLN―Estimated Total Market Capitalisation (Pm) natural log; ElecDistMWHLN―Electricity Distribution (mega-watt hour) natural log
The symbols below are as per the regression formula/findings above
β = slope (or coefficient) = −0.043
a = estimated intercept/constant term (or y-intercept) = 13.520
EXP of TMCPmLN―Exponential of Total Market Capitalisation natural log
Actual TMCPm―Actual Total Market Capitalisation (Pm)
Pm―millions of Pula (Botswana currency)
Appendix 2. Electricity Distribution Dataset
Key: LN―natural log
Appendix 3. Total Market Capitalisation Distribution Dataset
Key: LN―natural log; Pm―millions of Pula (Botswana currency). #―actual; ##―these were not available (at the time of writing) but became available at the time of publication.