Determinants of Foreign Direct Investment Flows to Africa: A Dynamic Panel Data Analysis ()
1. Introduction
One major economic challenge that has impeded the development of many developing countries is the inability, and in some cases, failure of developing countries to build up sufficient capital by way of national savings to finance value-creating investment. Consequently, many developing countries resort to international monetary institutions for loans to finance their recurrent and capital expenditures.
Whereas in the past, borrowing from international monetary institutions was seen by governments of developing countries as a means of financing, the increasing rate at which governments fail to meet their obligations to creditors and the consequent introduction of more stringent conditions by lenders puts a limit to the option of borrowing by government as a means of financing their development goals. Developing countries are now forced to reform their macroeconomic policies in order to attract more stable forms of foreign capital.
FDI represents the inflow of capital into a recipient-country from an entity outside the recipient-country for the purpose of facilitating value creation and delivery. As an alternative to government borrowing, FDI recipient-countries benefit from the improved prospects of job creation, access to foreign markets, and human capital development via the transfer of skills, knowledge and technology. Therefore, for developing countries where investment demand is higher compared to the domestic savings rate, it is possible to invest in priority sectors by means of importing capital in the form of FDI, and by doing this, promote economic growth.
Since FDI is considered an engine of growth and development, countries try to attract FDI inflows. Data from the United Nations World Investment Report (2011-2013)2 shows that many developing countries have been actively trying to attract foreign investors through various policy reforms. Despite these policy reforms, developing countries (particularly those in Africa) have continued to experience low and unstable FDI inflows.
2. Literature Review on the Determinants of Foreign Direct Investment
2.1. Theoretical Background
Several economic theories attempt to explain the factors that influence FDI in a host country and amongst such theories include; Vernon’s product life cycle theory, the internalization theories of Rugman (1981) and Dunning’s eclectic paradigm. The main theory adopted in this study is driven from Dunning’s eclectic paradigm which provides a general explanation for the determinants of FDI.
Dunning’s eclectic paradigm also known as the Ownership, Location and Internalization (“OLI”) paradigm asserts that the willingness for firms to engage in FDI at any particular point in time will be determined by the configuration of three main conditions: Ownership, Location and Internalization.
Ownership: Firms will embark on FDI if doing so provides them with ownership advantages. These ownership advantages are firm-specific and could give a firm competitive advantage over domestic and foreign competitors. They include: the access to or the control of raw materials, management skills, patents, superior technology, brand name and marketing skills and economies of scale.
Location: Firms will be willing to expand their production activities abroad if doing so will grant them access to location advantages. Location advantages could be in the form of reduced production and transportation costs, favorable tax treatments, available raw materials and cheap production inputs, lower risk as a result of macroeconomic stability, favorable political, legal and cultural environments. The location advantages of different countries play a key role in determining which country will play host to the activities of multinationals.
Internalization: This refers to the extent which firms perceive it to be in their best interest to take advantage of imperfections in external markets and by doing this, add value to the external market.
The internalization gains make it more profitable to delocalize all or a portion of the production process and take advantage of low-cost benefits across regions. External market imperfections include; state-generated imperfections such as tariffs, foreign exchange controls and subsidies.
The ownership and internalization advantages are firm-specific while the location advantages are country-specific features which the host country can influence directly. Countries that have more location advantages tend to attract more FDI.
The main feature of the eclectic theory is that all the three conditions have to be met for firms to engage in FDI and the activities of multinationals may be likened to a three-legged stool; “Each leg is supportive of the others and the stool is only functional if the three legs are evenly balanced” (Dunning, 1998: p. 45) . This means that in cases where investment abroad brings about ownership and internalization advantage without location advantages, firms will choose to maintain domestic production and export their goods abroad. In the same manner, if engaging in FDI will bring about ownership and location advantages firms will find it more profitable to produce abroad. However, if there are no internalization advantages, the firm will find it more profitable to license its ownership advantage to foreign firms.
Based on the three conditions, Dunning classifies FDI into three main types:
Market-seeking FDI: This type of FDI is also known as the Horizontal FDI and it is embarked on when the reason for expanding production activities abroad is to serve local markets through local production. The motive of the market-seeking FDI is to access host country market. Factors such as the market size and market growth of the host country play key roles.
Resource-seeking FDI: This type of FDI is undertaken in order to take advantage of differences in resource endowment. The availability of natural resources, cheap labor, creative assets and physical infrastructure promotes resource-seeking activities (Alina Kudina & Malgorzata Jakubiak, 2008) .
Efficiency-seeking FDI: This type of FDI is also known as vertical FDI and it is undertaken when the firm can benefit from delocalizing a few or all the production process across geographical locations. Vertical FDI is export-oriented and the motives behind it include; low-cost labor, different factor endowments, institutional arrangements, economic systems and policies, and market structures (Dunning, 1993: p. 59) .
It is important to note that many of the larger firms involved in FDI pursue pluralistic objectives and most times engage in FDI that combines the characteristics of each of the above forms of FDI (Dunning, 1993: p. 56) .
2.2. Empirical Evidence
Over the past two decades, the changing global, economic and political environment has brought about a renewed interest in FDI and a vast empirical literature has developed around its determinants. Several studies have employed different methodologies to analyze and explain the relationship between FDI and a variety of economic variables. However, there is limited amount of literature on FDI and its determinants in Africa. This section of the study reviews various determinants and their relations to FDI in the light of existing studies. Some of these determinants are encompassed in theories of FDI while others are suggested because they make intuitive sense.
Market Size: Most studies of the determinants of FDI flows have included the market size of the host country as a determinant of FDI. This is because larger and expanding markets can provide economies of scale and reduced transportation and product marketing costs. Artige & Nicolins (2006) conducted an econometric analysis to examine the determinants of FDI in a group of European regions and they found the market size measured by GDP per capita to be the most robust FDI determinant. Also, Peter Nunnenkamp (2002) argues that the market size as a traditional market-related FDI determinant still remains a dominant factor that influences the distribution of FDI despite the changes of globalization. Various issues of the UNCTAD report show that market size and access to natural resources have been crucial determinants of FDI in developing countries.
Natural Resource Availability: Several studies on the determinants of FDI in developing regions have included natural resource availability as an attraction for FDI flows. Asiedu (2002) , using a panel data for 22 countries in Sub-Saharan Africa (SSA) over the period 1984-2000, found that countries endowed with natural resources or have large markets attract more FDI. Also, Mohamed & Sidiropoulos (2010) , using a panel of 36 countries (12 MENA countries and other 24 developing countries), conclude that the key determinants of FDI inflows in MENA countries are the natural resources, the size of the host economy, the government size, and institutional variables.
Trade Openness: Astatike & Assefa (2006) studied the nature of FDI in Ethiopia for the time period 1974-2001 and the findings of their empirical analysis show that trade openness (which is measured as the ratio of exports plus imports to GDP), has a significant positive impact on FDI inflows. Findings by Sekkat & Veganzones-Varoudakis (2007) indicate that trade openness, sound economic and political conditions are important for South Asia, Africa, and the Middle East in attracting FDI. Onyeiwu & Shiestha (2004) analyzed the determinants of FDI in Africa using random and fixed effect model to identify the determinants of FDI flows and they found trade openness to be a significant determinant of foreign investment flows to Africa.
Macroeconomic Stability: The rate of inflation measured by the annual percentage change of consumer prices serves as an index for measuring macroeconomic stability. Obwona (2001) explains that a stable and sustainable macroeconomic environment boosts the confidence of private investors. High rate of inflation is considered an impediment to FDI because high inflation rates reflect macroeconomic instability and are due to poor implementation of monetary and fiscal policies. Schneider & Frey (1985) found that multinational firms invest less in developing economies with high inflation, and Apergis & Katrakilios (1998) found inflation uncertainty in the host country is negatively associated with FDI inflows. Calvo, Leiderman, & Reinhart (1996) analyze the inflow of capital to developing countries in the 1990s and their findings show that inflation portrays macroeconomic instability and reflects poor economic conditions in the country that discourage the flow of FDI.
Political Freedom: Several studies have shown that foreign investors prefer to invest in locations where legal and political institutions support the rule of law, protection for property rights and democratic processes. Schneider & Frey (1985) explain that democratic economies are known to attract more FDI than despotic countries. Democratic regimes are also more likely to respect the rule of law and property rights—features that are more conducive to the flow of FDI. Asidue & Lien (2011) also conclude that domestic political institutions in democracies can provide a favorable business environment for foreign investments. Aidt & Gassebner (2007) find that autocratic states trade substantially less than democracies.
Economic Growth: Several studies on the determinants of FDI have found a significant positive relationship between economic growth and FDI. Obwona (2001) found a positive relationship between economic growth and FDI. Lim (1983) shows that rapidly growing economies provide better opportunities for investors to harness and make profits relative to economies experiencing little or no growth.
Corruption: Using spatial econometric techniques, Mathur & Singh (2013) show that corruption plays a key role in investor’s investment decision. The less corrupt a country is perceived to be, the more FDI flows to country. Castro & Nunes (2013) find that countries with lower corruption levels attract more FDI flows. They conclude that controlling the level of corruption can help attract more FDI flows.
Agglomeration of Foreign Investors: Based on Quasi-experimental evidence from Romania, Hilber & Voicu (2006) conclude that agglomeration effects are vital location determinants of FDI inflows. They show that the existence of foreign firms in the host country increases foreign investment inflows to the host country. Guimaraes, Figueiredo, & Woodward (2000) analyzed the effects of four types of agglomeration economies in attracting FDI. Amongst the four types of agglomeration economies, foreign-specific agglomeration was seen to have a positive effect on FDI. Foreign investors will be attracted to areas with existing concentrations of foreign-owned firms. They show that investors that are less knowledgeable about the international business environment may emulate the decisions of existing foreign firms in the international market in attempt to reduce uncertainty.
Terrorism: Sandler (2013) studied the effects of terrorism on FDI in developing economies and concluded form his research, that terrorism hinders the flow of FDI to developing economies because foreign investors seek safer investment locations. Lee (2005) examined the effects of terrorism on FDI flows using cross-country panel estimation. The result of his study show that terrorism has a negative effect on FDI flows.
3. Research Method
This study adopts the dynamic panel data method to analyze the relationship between FDI and its potential determinants in Africa. The dynamic panel data method combines information on the variation of the individual units in this case, countries in Africa, with information taken over time. It includes the lagged value of the dependent variable as part of the independent variable. Due to the endogeneity bias of the dynamic panel data model and inconsistency of the least squares dummy variable (LSDV) estimator of the dynamic panel data model, this study uses the system General Method of Moments estimation technique proposed by Blundell & Bond (1998) to address the inconsistencies and present more efficient estimation results. The study uses a sample of developing countries in Sub-Saharan, Middle East & North Africa over the period 1998-2013.
Following the lead of Walsh & Yu (2010) and the models of earlier studies on the determinants of FDI in developing economies, the model of this study will express FDI as a function of lagged FDI, market size, natural resource availability, political freedom, corruption, economic growth, terrorism, macroeconomic stability and the degree of trade openness. The study uses secondary data derived from various issues of the World Development Indicators (WDI) published by the World Bank, Transparency International, the Freedom House and the Armed Conflict Location and Event Data (ACLED).
The dynamic panel data model is presented in the form;
(1)
(2)
The dependent variable, FDI per capita, is represented in the model by yit and xit represents the independent variables that vary across countries i and over time t. εit is the error term which serves as a measure of time invariant and country specific effects. αi is a stochastic term, it is known as the individual specific effect.
In order to ensure that the estimation results are not spurious, this study uses alternative econometric techniques on the data. The study employs the GMM estimation technique which has been adopted in past studies of FDI determinants that were stated in the literature review section of this study.
The difference GMM estimator takes the first difference of the dependent variable Δyit and uses all possible lags of the variables Δyit and
to generate orthogonality restrictions (Arellano & Bond, 1991) . The use of possible lagged values of Equation (1) as instruments eliminates the time-invariant country-specific effects and it helps ensure that all the explanatory variables are stationary.
The use of the difference-GMM estimator which eliminates the time-invariant country-specific effects results in a dynamic model of the form;
(3)
The presence of the lagged dependent variable in Equation (3) means that all the estimated coefficients represent short-run effects and the long-run effects of any variable can be derived by dividing its coefficient by one minus the coefficient of the lagged dependent variable.
Arellano & Bover (1995) pointed out that the lagged levels as used by the difference-GMM estimator are often poor instruments for first difference. Hence, in order to improve the efficiency of the difference-GMM estimator, Blundell & Bond (1998) proposed the system-GMM estimator which involves the use of lagged differenced variables as instruments to solve the problem of endogeneity resulting from the correlation of time-invariant, country-specific effects and other explanatory variables.
The estimation results of this study are presented applying the system-GMM for robustness. To test for the validity of the choice of instruments and confirm the absence of second order correlation, we implemented the Sargan test for testing over identifying restrictions and tested for autocorrelation.
The two-step GMM estimator which is considered efficient and robust for all kinds of heteroscedasticity is also used.
4. Model Specification
According to the OLI paradigm presented in section three of this study, firms will be willing to expand their production activities abroad and engage in FDI if this will bring about ownership and location advantages. The location advantages are country-specific features which the host country can influence.
Based on the OLI paradigm and the characteristics of FDI flows to African countries, this study uses two models in estimating the factors that influence the flow of FDI to African countries. In the first model, we try to estimate the effects of traditional determinants of FDI flows and in the second model we include non-traditional FDI determinants and try to see if there will be any change on their effects on FDI. The non-traditional potential FDI determinants are not easily quantified but they affect the profitability of the firm’s operations in the host country. These non-traditional determinants include the rate at which a country is perceived corrupt, the level of political freedom. Cross-country comparisons of these determinants are made on the basis of surveys of business firms or experts in related fields.
First, we present the first model and afterwards, the second model which includes other key determinants of FDI flows.
(M1)
(M2)
where;
FDIit = Foreign Direct Investment per capita in country i in year t − 1
GDPit−1 = Gross Domestic Product per capita of country i in year t − 1
OPNit−1 = Trade as a percentage of GDP in country i in year t − 1
INFit−1 = Inflation rate in country i in year t − 1
NRit−1 = Natural resource availability measured in terms of the share of fuel and minerals in export in country i in year t − 1
TERRit−1 = Terrorism based on the index for Terror Attacks in country i in year t − 1
GDPGRit−1 = Gross Domestic Product growth rate of country i in year t − 1
CORRit−1 = Corruption Perception Index of Transparency International
POLit−1 = Index for the State of political rights in country i in year t − 1
βj = Measure of the long run response of FDI to changes in the explanatory variables
υit = Error Term
Δ= First Difference
M1 = Model 1
M2 = Model 2
The index for the state of political rights was derived from the Freedom House Annual Survey, the data for Terror attacks is based on data derived from ACLED, and the index for corruption perception is derived from Transparency International. The data source for the other variables listed as the potential determinants of FDI is the WDI published by the World Bank.
5. Data Analysis and Estimation Results
5.1. Research Hypothesis
In order to evaluate the determinants of FDI flows to Africa and identify the key reasons for the low and unstable FDI flows to the region, the following research Hypothesis were proposed:
Ho1: There is no significant relationship between FDI and Lagged FDI in Africa
Ho2: There is no significant relationship between FDI and per capita GDP in Africa
Ho3: There is no significant relationship between FDI and Trade Openness in Africa
Ho4: There is no significant relationship between FDI and Inflation in Africa
Ho5: There is no significant relationship between FDI and Resource Availability in Africa
Ho6: There is no significant relationship between FDI and GDP Growth in Africa
Ho7: There is no significant relationship between FDI and Corruption in Africa
Ho8: There is no significant relationship between FDI and Political Freedom in Africa
Ho9: There is no significant relationship between FDI and Terrorism in Africa
5.2. Results
This study uses a balanced panel data of annual FDI per capita flows from 1998 to 2013 for ten African countries. The variables included as the potential determinants of FDI in Africa are Market Size measured by per capita GDP, GDP Growth, Trade Openness, and Inflation rate, Political Freedom, Availability of Natural Resources, Corruption, Terrorism and Agglomeration of foreign investors measured by past FDI inflows. The variables in the model are indexed as GDP, GDPGR, OPN, INF, POL, NR, CORR, TERR and LFDI. FDI per capita is presented as a percentage of GDP, per capita GDP is expressed in natural logarithm and Trade Openness is derived by dividing the summation of total exports and imports by the real GDP. Corruption is expressed as an index of how corrupt the public sectors of the countries in this study are seen to be and Political Freedom is measured in terms of the degree of freedom in the African countries. The index for Terrorism is based on the number of terror attacks and the total number of fatalities caused by the terror attacks in a given year. Using the weighing system of the global terrorism index, we weighed the total number of terror attacks on a scale of 1 and the total number of fatalities caused by terrorism on a scale of 3. We calculated the score for each of the sample of countries and assigned an index using a base ten logarithmic banding system between 0 and 10. Countries with an index of 10 are seen to have recorded high terror attacks and countries with an index of 0 or 1 are seen to have been least affected by terror attacks.
The study focuses on ten African countries that are considered the major recipients of FDI in Africa. The data source for the dependent and independent variables include the World Development Index published by the World Bank, Transparency International’s Corruption Perception Index, the armed conflict location & event data (ACLED) and the Freedom House Annual Survey. The choice of the independent variables was constrained by data availability.
Table 1 below presents the summary statistics of the data.
The variables under study are found to be nearly normally distributed as shown in Table 1. The standard deviation of each variable is low with the exception of the corruption index. The skewness, which is the coefficient of symmetry of each variable, is equally low and mildly skewed. The kurtosis which is the coefficient of flatness in each variable is below 3 with the exception of inflation and FDI which confirms near normality.
![]()
Table 1. Summary statistics of regression variables (1998-2013).
Source: Computed by Author.
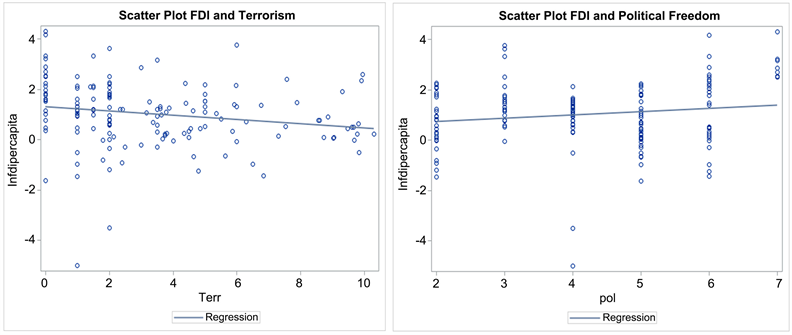
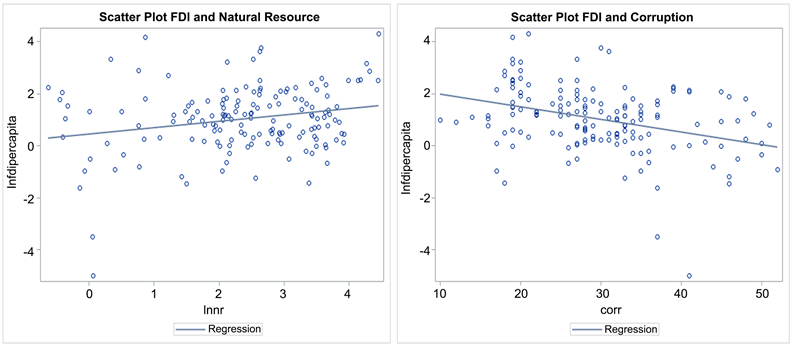
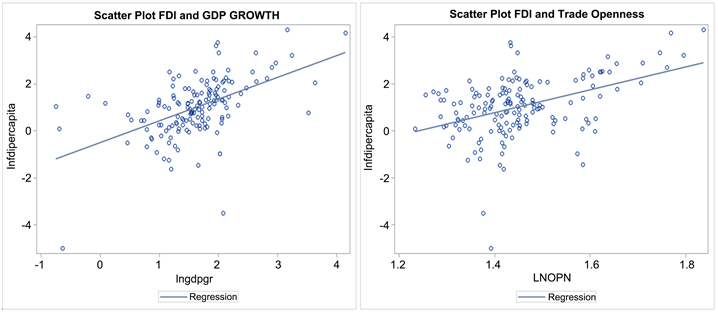
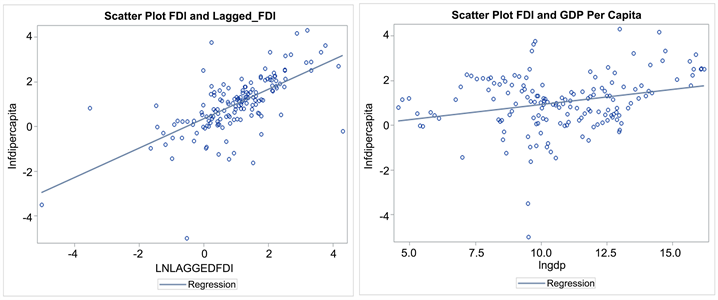
We also present scatter plots to identify any relationship between the explained and explanatory variables.
5.3. Data Plots1
5.4. Estimation
In order to verify the validity of the choice of instruments in the two models, the Sargan-Hansen Test for over identifying restrictions was conducted. The result of the Sargan-Hansen test in both models showed that the lagged values of the endogenous variables used as instruments in the models are valid. The P-values are greater than 0.01 and so, the null hypothesis that the over identifying restrictions are valid cannot be rejected.
The test for absence of second order autocorrelation of the differenced disturbances was also conducted because the consistency of the GMM estimator depends on this property. The results of the M2 test show that we cannot reject the null hypothesis of no autocorrelation at any conventional significance level. We therefore conclude that the GMM method is appropriate for our models and the data at hand.
The results of the test for over identifying restrictions and absence of second order autocorrelation are presented in Table 2 and Table 3.
Source: Computed by Author.
![]()
Table 3. Estimation result (Model 1).
Source: Computed by Author.
5.5. Estimation Results
We employed the two-step GMM method for the difference GMM regressions. This procedure is asymptotically efficient and robust to all kinds of heteroskedasticity. The estimated coefficients are presented in Table 4 and Table 5. From the result of the estimation of the two models, we find that all the variables have the expected signs and are highly significant with the exception of inflation in model 2 which has a negative effect that is not significant.
5.5.1. Estimation Results from Model 1
The results of the first model show that Lagged FDI which serves as a measure for the agglomeration of foreign investors has a significant positive effect on FDI in Africa. We see that a percentage increase the past values of FDI increases FDI flows by about 0.04 percent. The relationship is seen to be significant at the 1 percent level of significance.
The coefficient of GDP per capita is seen to be positive, indicating that there exists a positive relationship between GDP per capita and FDI per capita in Africa. In the long run, a percentage increase in GDP per capita results in an increase of 8.7% [=8.3426/(1 − 0.04180)] in FDI per capita. This was derived by dividing the coefficient of GDP in Table 3 by the difference between 1 and the coefficient of the lagged dependent variable. The relationship between per capita GDP and FDI per capita is seen to be significant at the 1 percent significance level. The T-statistics for the Null hypothesis of no relationship between per capita GDP and FDI per capita is greater than 2.58. Hence, we fail to accept the null hypothesis of the non-existence of a significant relationship between FDI per capita and per capita GDP. The results also show that Trade Openness (OPN) and Natural Resource (NR) have strong positive relationship with FDI per capita. The T-statistics for the Null hypothesis of no relationship between Net FDI
Source: Computed by Author.
Note: *** = 1% significant level; ** = 5% significant level; * = 10% significant level.
and the listed determinants is greater than 2.58 and so, we conclude that the relationship is significant at the 1 percent significance level.
A percentage increase in the level of Trade openness causes FDI as a share of GDP to increase by 0.168 percent and a percentage increase in the availability of natural resources increases FDI per capita by 0.10 percent. The coefficient of Terrorism is negative indicating that the relationship between Terrorism and Net FDI flows is negative. A percentage increase in the rate of terror attacks will reduce FDI per capita by 38%. The relationship is significant at the 1 percent significance level. This coefficient of Terrorism was derived the same way we derived that of per capita GDP above.
5.5.2. Estimation Results from Model 2
In the second model, we included the other potential determinants of FDI flows to Africa and tried to see if the results will be similar to that of the first model. We find that the coefficients of Lagged FDI, GDP, Trade Openness (OPN) and Natural Resource availability (NR) are significantly positive at the 1 percent significance level.
The coefficient of the growth rate of GDP (GDPGR) has a positive sign. This shows that there is a positive relationship between GDPGR and per capita FDI. Given the value of the T-statistics which is greater than 2.58, this relationship is seen to be significant at the 1percent significance level. An increase in GDP growth results in an increase of FDI per capita by 0.3614 percent.
Unlike the other explanatory variables, inflation is seen to have an insignificant effect on FDI per capita. Although the coefficient of inflation is negative, the value of the T-stat shows that this relationship is not significant.
Corruption is seen to have a strong negative relationship with FDI per capita. The result of our estimation shows that corruption has a negative effect on FDI per capita. A percentage increase in the rate at which the countries are perceived corrupt will result in a decline of FDI per capita by 39.6% [=−0.3100/(1 − 0.2174)]. This relationship is found to be significant at the 1percent significance level.
The coefficient of POL which serves as a proxy for Political Freedom is seen to be positive at the 1 percent significance level. An increase in the level of political freedom will cause an increase of 26.58 units [=20.8/(1 − 0.2174)] in FDI per capita.
The result of the estimation of the second model is presented in Table 5.
6. Discussion of Results
The result presented in section 6 of this study show that the market size is a highly significant determinant of FDI flows to Africa. In both models, we find that the market size has a significant positive effect on FDI flows. This result is consistent with the results of existing studies and it confirms the findings of Asiedu (2002) , Jordaan (2004) and Anyanwu (2011) . African Nations with large markets tend to attract more FDI.
The coefficient of inflation was found to be negative, but the P-value showed that inflation has no effect on Net FDI flows to Africa. We fail to reject the null Hypothesis that there is no relationship between FDI and inflation rate in Africa. This finding is similar to those of existing studies of FDI determinants in countries in Africa. Ehimare (2011) explained that inflation does not significantly affect FDI flows to Nigeria. Dinda (2008) discovered the tendency for inflation to increase FDI inflows subsequently.
A significant positive relationship between FDI and Economic growth is indeed no surprise. Several studies have identified economic growth as a key determinant of FDI inflows including Obwona (2001) and Chakrabarti (2001) . The slow and uneven FDI flows to African countries can be explained by the region’s slow growth performance. African economies are known to experience slow growth. For instance, the average rate of GDP growth for countries in sub-Saharan Africa plummeted from 3.9 percent between 1960 and 1970 to −1.1 percent between 1980 and 1984 (UN, 1994; UNCTAD, 1994) . Also, from the sample of African countries examined in this study, there is a trend of unstable GDP growth. After growing at an average rate of about 2 percent yearly and reaching a peak of 17.9 percent in 1997, the average GDP growth in the region declined precipitously in most countries by 1998. These slow and unsteady GDP growth trend explain the reason for low FDI flows to the region.
Trade openness involves implementing liberal trade policies that are attractive for foreign investment. In open economies, the risk of arbitrary expropriation of assets is low and foreign investors can repatriate their earnings with relative ease. Over the past three decades, African countries have been liberalizing their trade policies to establish a hospitable regulatory framework for FDI by relaxing rules regarding market entry and foreign ownership, improving the standards of treatment accorded to foreign firms, and improving the functioning of markets. These “core” policies to an extent have been successful in attracting FDI to Africa. However, in order to increase FDI flows to Africa, African countries have to ensure more stable trade policies. The low FDI flows to Africa is explained by the unstable trade policies in African countries.
The availability of natural resources has a positive effect of FDI inflows as shown in our estimation result. Countries with natural resources tend to attract resource-seeking FDI. This finding perhaps explains why the countries selected as samples in this study are major recipients of FDI in Africa. Our findings support empirical results and confirm research expectations.
Foreign investors prefer to expand their production activities to economies where legal and political institutions support the protection for property rights and democratic processes. From our estimation, we find that democratic political regime measured based on a scale of 1 to 7 on civil liberties and political rights, has a positive effect on FDI. Democratic political regimes are known to respect the rule of law and property-right features that are more conducive for the flow of FDI. Also, democratic countries (politically free countries) tend to set lower trade barriers and therefore engage in more open trade relations. The result of our estimation supports the findings of Schneider & Frey (1985) and Mijiyawa (2013) .
Our findings show that corruption has a significant negative effect on FDI. A transparent business environment and public sector will reduce business costs for foreign investors. Corruption makes local bureaucracy less transparent and thus discourages foreign investors. To attract FDI, host countries have to ensure transparent political institutions and public sectors. Our findings support that of Castro & Nunes (2013) , as well as Smarzynska & Wei (2000) .
Terrorism around the world hinders FDI because it leads to increased costs of business operation by means of high insurance premium costs. It also results in increased costs of security precautions and increased salaries for employees at risk will rise. A country considered as a likely location for insurgency and terrorism will attract less FDI because foreign investors seek safer investment location. Our findings confirm that Terrorism has a negative effect on FDI flows to the African region. An increase in the rate of terror attacks in Africa will result in a decline of FDI flows by approximately 36.5%. Our findings confirm those of existing studies highlighted in earlier parts of this study.
We found that agglomeration effects have significant positive significant effects on Net FDI flows to Africa. A percentage increase in the FDI flows received by African countries in the previous year result in an increase of FDI flows received in the current year by 0.2 percent. Our finding confirm the findings of Hilber & Voicu (2006) that agglomeration effects are key FDI location determinants.
7. Policy Recommendations and Conclusion
The dwindling of oil prices in the past 2 decades and its effects on countries in Africa, re-emphasize the need for these countries to have more diversified economy. Since income levels and domestic savings are low in Africa and there is a limit to international capital markets, it means that capital needed to finance value-creating investment needed to promote economic diversification has to be sourced through other means such as FDI. Given the need for FDI in Africa, this study aimed at identifying the determinants of FDI flows to Africa and the reasons for the low and unstable flows to the region.
Unlike previous studies which focus solely on the traditional determinants of FDI, this study examined the effects of institutional factors as well as macroeconomic factors on attracting FDI in Africa. The study was based on balanced panel data of per capita FDI flows for the period 1998-2013 for ten major FDI recipients in Africa. We made use of the system-GMM dynamic model to solve the problem of endogeneity and eliminate the time-invariant country-specific effects that are common in panel data models
From the research, we found the market size, the availability of natural resources, the degree of trade openness and political freedom to have significant positive effects on Net FDI flows to Africa. The rate at which countries are perceived corrupt was seen to have significant negative effect on Net FDI. The agglomeration of foreign investors measured in terms of past FDI flows was seen to have strong positive effects but these effects on Net FDI flows to Africa.
Based on our findings, we recommend policies that can be implemented by African policy makers towards attracting FDI to the region.
First, we suggest that policy makers should focus on ensuring prudent macroeconomic management. The results from the analysis conducted show that macroeconomic factors such as the rate of economic growth and the degree of trade openness are vital FDI determinants and so, achieving prudent macroeconomic management will reduce the rate of uncertainty amongst foreign investors and increase FDI flows to Africa.
Second, we emphasize the need for African countries to strengthen regional economic integration. Doing this will promote intra-regional trade, create larger markets, promote political stability, reduce the rate of corruption and increase transparency. The strengthening of regional economic integration will enable African countries to coordinate their policies, it will help reduce threats of terrorism and it will attract more investment for development.
The results of this study show that countries that are endowed with natural resources tend to attract FDI. Hence, in order to increase FDI flows and promote economic growth through increased FDI flows, resource rich countries should ensure that their natural resource revenues are effectively managed and that existing multinationals do not evade taxes or other contract agreements. There is also need for resource rich countries to ensure transparent and more beneficial contracts with potential investors. For African countries that are less endowed with natural resources, they should ensure that efforts are made towards creating a safe business environment in order to attract more FDI flows.
There is a need for efforts to be made by the government of African countries to curb terror attacks. Since FDI is an important means of financing development goals, the government of African countries should seek foreign support and make measures towards reducing the risk of terror attacks that deters FDI flows. Particularly, the strengthening of regional economic integration as earlier stated will help reduce the threat of terrorism.
Finally, corruption was seen to be a major factor that hinders FDI flows and so, it is important for the government of African countries to take measures to combat corruption and promote transparency in order to attract more FDI flows.
Limitation of Study
One of the limitations of this study is that in analyzing the effect of corruption on FDI flows, we relied on the perception-based measure of corruption. This measure is broad and does not totally capture the different forms of corruption which can exert different impacts on FDI. The use of specific indices of corruption in future research can help provide more precise conclusions about the relationship between corruption and FDI.
Another limitation of this study is that due to the unavailability of data, we were unable to highlight the effects of other key determinants in attracting FDI flows to Africa. Also, the data for some African countries was not available and so this study could not examine the effects of certain determinants on FDI flows in other countries in Africa.
NOTES
1Source: Computed by Author.
2Source: Computed by Author.