Correlation of the Number of African American Congresswomen and Their Higher Educational Attainment ()
1. Introduction
The current development situation of African American women had seen a great improvement regarding the black women’s education, as their college matriculation rates have escalated through the years. And in 2020 they represented 55% of the college-matriculated black population according to the US Census of that year.
In 2013-14, black female students obtained 70% of the master’s degrees awarded to black students. At the doctor’s degree level, black female students earned 64% of the degrees compared to 36% of the degrees awarded to black male students. Whereas, white females earned 52% of the doctor’s degrees among white students ( Musu-Gillette, 2017 ).
Despite their high SEP (socio-economic position) and well education, black women are unexpectedly vulnerable to depression as well as poor birth outcomes because they have aspirations for themselves and for their children, a matter that added to their stress. Furthermore, it was stated that “Well-educated African- American women reported having financial pressures and fewer opportunities than white women, which is suggestive of disparities in economic returns on education” ( Jackson, 2001 ).
Moreover, black women had the highest rate of unemployment among all women races in the United States of America in February 2021. They scored 8.9% of unemployed black women which was the worst unemployment rate for women in the whole country in 2021 right in the eye of a lethal pandemic that devoured the lives of millions in the United States of America ( Frye, 2021 ).
Regarding their political participation, they are more represented than ever in the current Congress 2023-2025 with 30 African American Congresswomen. In addition to that, Kamala Harris, the current vice president, is half Indian, and half black woman.
Moreover, there are the statistical charts and numerical data that come from Census Bureau of 2020, Musu-Gillette, Brey, McFarland, Hussar, Sonnenberg, and Wilkinson-Flicker (2017) . Status and Trends in the Education of Racial and Ethnic Groups 2017. National Center for Education Statistics: Washington.
Thus, the current development situation of African American women is getting better but the outcomes do not match the improvement and the exerted effort.
Discrimination has retarded the socio-economic upward mobility of African American women, as they are less educated, poorer, and represent a minority in the Congress compared to their white counterparts1. In other words, their opportunities to improve their life standard were limited, and even prohibited due to the restrictions that framed their access to education, housing, jobs, and voting. For example white women were able to practise their right to vote since 1920, but African-American women were not granted that essential right until the legislating of the Voting Rights Act in 1965 which vanquished the previous discriminatory tactics that decreed the deprivation of African American women from voting ( Terborg-Penn, 1998 ). That has delayed the black women’s political right for about half a century, which had been reflected negatively on different aspects of their life.
The African American woman has endured worse than what was put up with by her male compeer with regard to segregation. Her burden was double tripled as she faced three types of discrimination within her black community on the basis of her gender, social class, and the intensity of her colour, as lighter black ladies are more favoured among blacks (colourism). Then, she was condemned to further racism in white America which is established on the same reasons that exist in her black community except for the colourism, as in white America she was discriminated against just for being black regardless of the density of her colour.
It was mentioned that colorism, is a remnant that slavery had left on the minds of blacks and it favours the individuals who have light skin, delicate facial features as well as straight hair ( Russell, 1992 ).
Moreover, white America was not the only sexist oppressor of black women, as African American man was an additional source of sexism for African American woman, as can be shown in the following: “The oppressive experiences of black men have not deterred them from being oppressive themselves” ( Hernton, 1987 ).
Sexism has a far more destructive effect on African-American women who strive for socio-economic upward mobility than any other discriminative factor in the 21st Century. It restrains black women from achieving their dreams and fulfilling their identity as African-American women are forced in a molded female role that they have to follow ( Robinson, 2010 ).
Regarding the family role in the development of African American women, there is a “double bind” for African-American women as they are raised to be independent, get good education, and a good job in order to survive alone. But the African-American church refutes that and cultivates the notion that they should be subordinate and obey men ( Scott, 1991 ).
To some extent, subordination on the basis of gender shaped African American women, and outlined their family life.
Working was a fundamental issue for African American women. In other words, it was a survival mechanism for them. “By 1930, 12 percent of all wives were gainfully employed, with 10 percent of white and 33 percent of black women in the labor force”. African American women worked mainly as servants or in agriculture. It was also mentioned that during World War I, Southern legislators and city council members passed the mandate “work or fight” to domestic servants ( Kleinberg, 2001 ).
In addition to that, African American women were more likely inclined to work and be financially independent than white women who did not show such a tendency in the past. That can be associated with the social status of black women who have found out that it was imperative to hold a job or even more than one in order to provide for their families, as they had much more possibility to be single mothers and could not depend on anyone else’s income. A situation that was not in common with white women ( Wallace, 1980 ).
Generally, African American women have to support their family members economically and emotionally. They also have to protect African American children from race discrimination ( Jackson, 2001 ; Thomas, 2008 ).
As a consequence of the decline in black women’s incomes, the poverty rate for black children under 18 living only with their African American mothers was higher (17%) than that for white children living in single mothers’ households (11%) ( Musu-Gillette, 2017 ). Thus, new African American generations continue to inherit poverty from their mothers regardless of how well-educated they are.
Concerning the relationship between education and politics, among the hardships that black women faced during their voting ban was: the exclusive test that examined their constitutional knowledge. That test ruined their chances to have their fair share in the voting process, which was a pivotal measure in order to defend their civic rights and gain a decent amount of liberty and equality ( Prescod, 1997 ).
As a result of that test, and because of having segregated education, African American women were locked out of the voting process for decades.
Moreover, according to McCutcheon (2022) , the vast majority of the US representatives, and senators are college graduates and that tendency has been maintained during the last decade.
Hence, there is a clear relationship between education and political participation in Congress.
There is a slow advancement of the African American women’s political participation in Congress throughout more than half a century in spite of the significant increase in their higher educational achievement rates at that time.
Furthermore, their higher educational attainment rate does not match their congressional participation, given the fact that almost all of the Congress members are college graduates who hold bachelor’s degrees as well as higher ones too.
2. The African American Congresswomen
In order to understand the status of African American women in the US Congress, it was demanding to trace the history of black women there from the 41st Congress to the 118th Congress which is the current one.
Table 1 was prepared in order to observe the number of African American women in the Congress, compare the data, and draw the results that are based on the obtained information.
It zooms on the records of African American Congresswomen along 54 years of the US Congress, and sheds light on the bigotry that they suffered from regarding their congressional participation, a matter that reflects their political effect along more than half a Century.
Table 1 manifests the real political status of black women in the United States of America, as well as their impact on the decision-making process by displaying their percentage as Congress members in comparison to the rest of the members starting from the 91st Congress up to the 118th Congress. That comparison draws attention to the severe decrease of black Congresswomen in 1969. It also shows an improvement in the last decades.
Figure 1 contrasts the black women’s Congressional position in 1969-1971 with the total number of the Congress members, and that contrast highlights the fact that African American woman did not almost exist in the US Congress,
![]()
Table 1. Percentage of the African American Women in the US Congress: 91st Congress - 118th Congress.
Source: A prepared Table 1 by the author that shows the percentage of the African American women members of the US Congress Compared to the Total number of the Congress Members: 41st Congress - 118th Congress, based on information from History, Art & Archives, U.S. House of Representatives (2023) . People Search. Accessed 23 Apr. 2023. Available at: https://history.house.gov/People/Search.
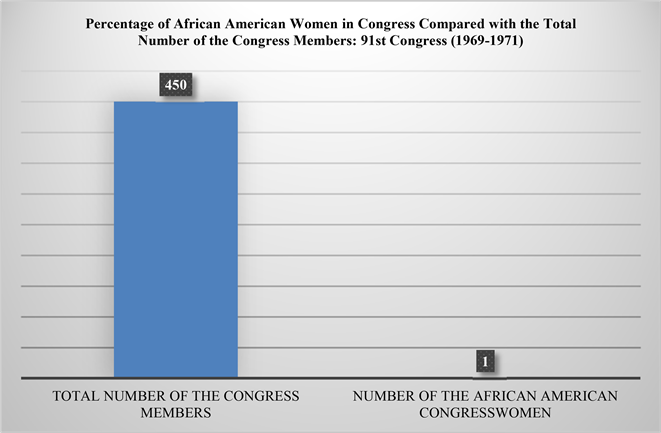
Source: A prepared statistical chart by the author that shows the percentage of the African American women in US Congress Compared with the Total numbers of the Members in 1969-1971, based on information from History, Art & Archives, U.S. House of Representatives (2023) . People Search. Accessed 13 Aug. 2022. Available at: https://history.house.gov/People/Search.
Figure 1. Percentage of African American Women in Congress Compared with the Total Number of the Congress Members: 91st Congress (1969-1971).
as can be seen in the following.
Figure 1 shows the percentage of the African American Congresswomen compared with the total number of the members in the 91st Congress in 1969 and demonstrates that black congresswomen had almost 0% weight in the American political world in 1969, as the first and only black congresswoman in that year was Shirley Chisholm.
African American women represented an unsignificant portion of the US Congress in 1969-1971, which implies the segregation of African American women from the decision-making process. A matter that threatened the interests of black women at that time.
Examining the political situation of African American women in the current Congress 2023-2025 after about more than half a Century from the mentioned data in 1969, Figure 2 reveals how the black women’s position changed in the recent years as follows.
Figure 2 shows that the current African American women’s political situation in the US Congress did not change significantly as they represent only 6.80% of the total number of the Congress members in 2023-2025. Thus, it can be safely detected that their political participation has not improved considerably after 54 years since the election of Shirly Chisholm.
Trying to find out the situation of black women in comparison with black
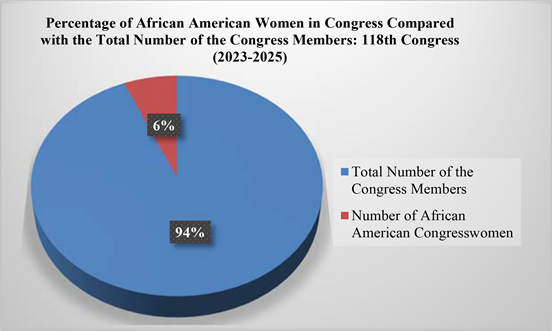
Source: A prepared statistical pie by the author that shows the percentage of the African American women in US Congress Compared with the Total numbers of the Members in 2023-2025, based on information from History, Art & Archives, U.S. House of Representatives (2023) . People Search. Accessed 23 Apr. 2023. Available at: https://history.house.gov/People/Search.
Figure 2. Percentage of African American Women in Congress Compared with the Total Number of the Congress Members: 118th Congress (2023-2025).
men in the 41st-118th US Congress, one can find discrepancy in the rate of their participation, as African American women were absent from the Congress from its beginning until 1969, as can be deduced from Figure 3.
According to Figure 3, the African American congresswomen represented only 9.09% compared with their male peers in the 91st Congress (1969-1971). Even within their own race, black women were a minority when it came to a political decision.
As for the percentage of the African American Congresswomen compared with their male counterparts in the 118th Congress (2023-2025), the chart reveals that they represent 47.61%. Almost half of the black members in the US Congress are black women. Thus, improvement of the number of black women exclusively within the blacks in the Congress cannot be denied.
Concerning the percentage of the African American woman in comparison with the total number of Congresswomen: 91st Congress-118th Congress, the difference cannot be outlooked as shown in Table 2.
Table 2 conveys the percentage of the African American Congresswomen in comparison with the total number of the Congresswomen: 91st Congress-118th Congress.
After more than 50 years since the election of Shirley Chisholm, the mere 30 African American women who serve in the 118th Congress represent 19.48% of the total number of women who serve in that Congress.
Figure 4 shows that African American women had the least representation in Congress in 1969-1971, as they had only one black Congresswoman (Shirley
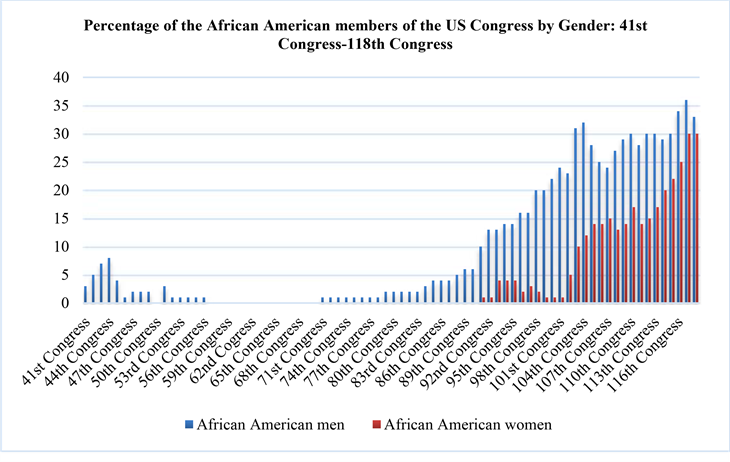
Source: A prepared chart by the author that shows the percentage of the African American members of the US, Congress by sex: 41st Congress-118th Congress based on information from History, Art & Archives, U.S. House of Representatives (2023) . People Search. Accessed 23 Apr. 2023. Available at: https://history.house.gov/People/Search.
Figure 3. Percentage of African American Members of the US Congress by Gender: 41st Congress-118th Congress.
![]()
![]()
Table 2. Percentage of the African American Woman in Comparison with the Total Number of Congresswomen: 91st Congress-118th Congress.
Source: A prepared Table 2 by the author that shows the percentage of the African American Congresswomen in Comparison to the Total number of the Congresswomen: 91st Congress - 118th Congress, based on data from History, Art & Archives, U.S. House of Representatives (2023) . People Search. Accessed 23 Apr. 2023. Available at: https://history.house.gov/People/Search.
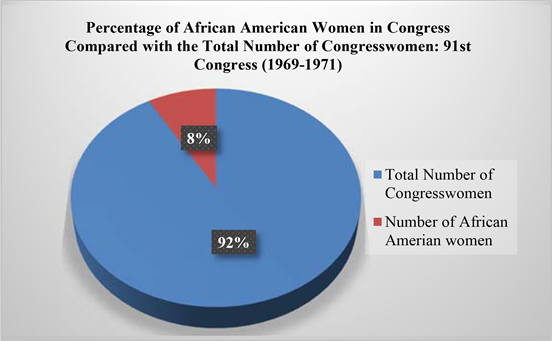
Source: A prepared statistical pie by the author that shows the percentage of the African American Congresswomen in Comparison to the Total number of the Congresswomen: 91st Congress, based on data from History, Art & Archives, U.S. House of Representatives (2023) . People Search. Accessed 13 Aug. 2022. Available at: https://history.house.gov/People/Search.
Figure 4. Percentage of African American Women in Congress Compared with the Total Number of Congresswomen: 91st Congress (1969-1971).
Chisholm) to represent them.
Figure 4 shows the percentage of African American Women in Congress compared with the total number of Congresswomen: 91st Congress (1969-1971), which reveals a drastic decrease in their number as the only black woman that was there at that time was Shirley Chisholm.
Regarding the current 118th Congress (2023-2025), the percentage of African American women in Congress compared with the total number of congresswomen is still reduced, as shown in Figure 5 .
Figure 5 shows the percentage of the African American congresswomen in comparison with the total number of congresswomen: 118th Congress (2023- 2025), and discloses the hypothesis that African American women continued the trend of being a minority.
The data indicate that the African American congresswomen are still having a weakened position in the political sphere.
3. Correlation of the Higher Educational Status of Black Women and Their Participation in the US Congress
As for the higher educational status of African American women in 1969-2020, Figure 6 reveals that along the years the African American women’s higher educational attainment rate has elevated in a positive way, as can be observed from Figure 6.
Figure 6 displays the percentage of African American women with Bachelor’s degree or higher in 1960-2020. It unearths the fact that 30.50% of black women
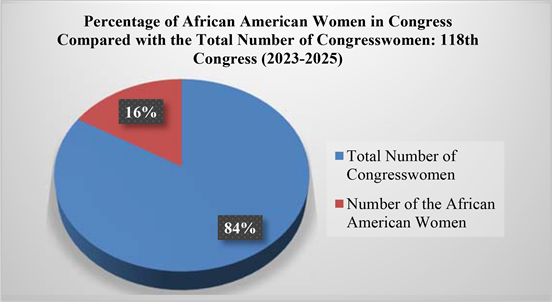
Source: A prepared statistical pie by the author that shows the percentage of the African American Congresswomen in Comparison with the Total number of the Congresswomen: 118th Congress, based on data from History, Art & Archives, U.S. House of Representatives (2023) . People Search. Accessed 23 Apr. 2023. Available at: https://history.house.gov/People/Search.
Figure 5. Percentage of African American Women in Congress Compared with the Total Number of Congresswomen: 118th Congress (2023-2025).
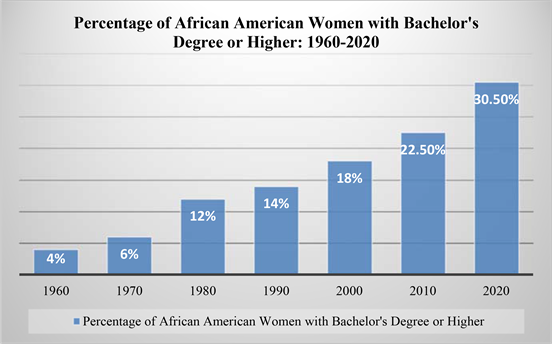
Source: A prepared chart by the author that shows the Percentage of African American Women with Bachelor’s Degree or Higher: 1960-2020 that is based on information from BROOKINGS, tabulations of American Community Survey data (2001-2015) and decennial Census data (1940-2000) using IPUMS, and Current Population Survey, Selected Years 1940 to 2020; and Censuses of Population 1940 and 1950, Table A-2 2.
Figure 6. Percentage of African American women with Bachelor’s degree or higher: 1960- 2020.
obtained a bachelor’s degree or higher in 2020 compared with their situation in 1960 as only 4% of African American women won those degrees, and in 1970, only 6% of them obtained the same degrees.
Consequently, it can be inferred that the educational level of the African American women has bettered a lot than their past levels in the 60’s and the 70’s.
Interpreting the previously introduced information in terms of congressional participation, the following data can be reached:
Figure 7 demonstrates the percentage of African American congresswomen in relation to their higher educational attainment in 1960. It consolidates the hypothesis that when the percentage of the black women’s higher educational attainment rate in 1960 was as low as 4%, their percentage of congresswomen was null as well and they scored 0%.
As for the percentage of the black congresswomen in comparison with their higher educational attainment in 1970, no big change can be radared since the 1960s, as the only black congresswoman who was there, continued to be Shirley Chisholm with no new addition, as can be detected from Figure 8.
Figure 8 conveys the percentage of African American congresswomen in relation to their higher educational attainment in 1970. It illustrates that when the percentage of the black women’s higher educational attainment rate in 1970 was
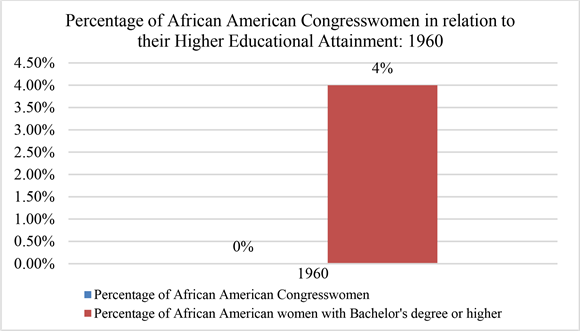
Source: A prepared chart by the author that shows Percentage of African American Congresswomen in relation to their Higher Educational Attainment: 1960, based on information from History, Art & Archives, U.S. House of Representatives (2023) . People Search. Accessed 13 Aug. 2022, information from BROOKINGS, tabulations of American Community Survey data (2001-2015) and decennial Census data (1940-2000) using IPUMS, and Current Population Survey, Selected Years 1940 to 2020; and Censuses of Population 1940 and 1950, Table A-2 . Available at: https://history.house.gov/People/Search, https://www.brookings.edu/blog/social-mobility-memos/2017/12/04/black-women-are-earning-more-college-degrees-but-that-alone-wont-close-race-gaps/, and www.census.gov/data/tables/time-series/demo/educational-attainment/cps-historical-time-series.html.
Figure 7. Percentage of African American congresswomen in relation to their higher educational attainment: 1960.
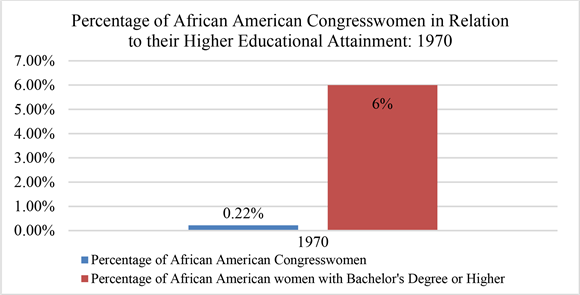
Source: A prepared chart by the author that shows the Percentage of African American Congresswomen in relation to their Higher Educational Attainment: 1970, based on information from History, Art & Archives, U.S. House of Representatives (2023) . People Search. Accessed 13 Aug. 2022, information from BROOKINGS, tabulations of American Community Survey data (2001-2015) and decennial Census data (1940-2000) using IPUMS, and Current Population Survey, Selected Years 1940 to 2020; and Censuses of Population 1940 and 1950, Table A-2 . Available at: https://history.house.gov/People/Search, https://www.brookings.edu/blog/social-mobility-memos/2017/12/04/black-women-are-earning-more-college-degrees-but-that-alone-wont-close-race-gaps/, and www.census.gov/data/tables/time-series/demo/educational-attainment/cps-historical-time-series.html.
Figure 8. Percentage of African American congresswomen in relation to their higher educational attainment: 1970.
as minimized as in 6%, their percentage of congresswomen also dropped down as they scored only 0.22%.
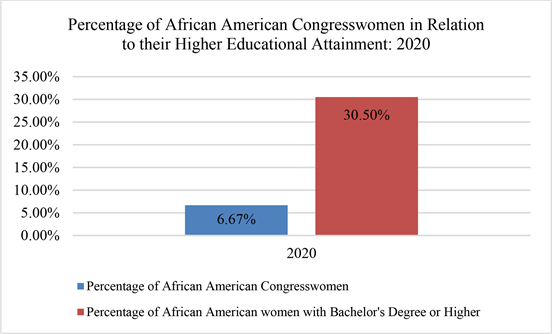
Concerning the contemporary percentage of African American women in the US Congress, in relation to their higher educational achievement, it was not compatible as expected despite the notable improvement that they have experienced.
Figure 9 reveals the percentage of African American congresswomen in relation to their higher educational attainment in 2020. It prevails that when the percentage of the black women’s higher educational attainment in 2020 rose to 30.50%, their percentage of the congressional participation has also elevated but not at the same pace as they scored only 6.67%.
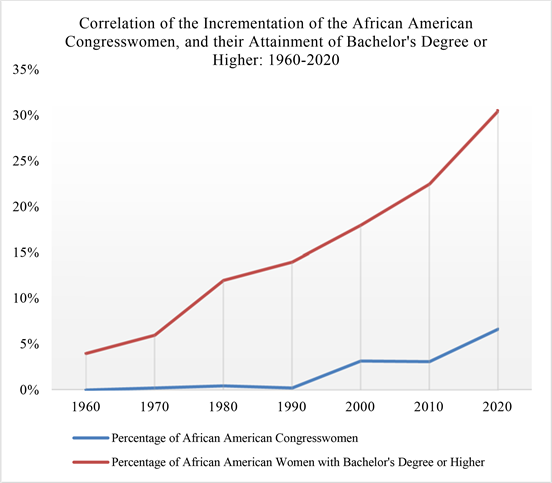
There was no matching increase in the ratio of higher educational attainment of African American women and their participation in the US Congress from 1960 to 2020. It is true that the more higher education level black women gain, the more Congress seats they win, but there is no suitable equivalence in the increase. Figure 10 shows that correlation.
As can be understood from Figure 10, it is true that the African American congresswomen’s number has increased in 2020, nevertheless that increase is not
Source: A prepared chart by the author that shows Percentage of African American Congresswomen in relation to their Higher Educational Attainment: 2020, based on information from History, Art & Archives, U.S. House of Representatives (2023) . People Search. Accessed 13 Aug. 2022, information from BROOKINGS, tabulations of American Community Survey data (2001-2015) and decennial Census data (1940-2000) using IPUMS, and Current Population Survey, Selected Years 1940 to 2020; and Censuses of Population 1940 and 1950, Table A-2 . Available at: https://history.house.gov/People/Search, https://www.brookings.edu/blog/social-mobility-memos/2017/12/04/black-women-are-earning-more-college-degrees-but-that-alone-wont-close-race-gaps/, and https://www.census.gov/data/tables/time-series/demo/educational-attainment/cps-historical-time-series.html.
Figure 9. Percentage of African American congresswomen in relation to their higher educational attainment: 2020.
Source: A prepared chart by the author that shows Correlation of the Incrementation of the African American Congresswomen, and their Attainment of Bachelor’s Degree or Higher: 1960-2020, based on information from History, Art & Archives, U.S. House of Representatives (2023) . People Search. Accessed 13 Aug. 2022, information from Brookings, tabulations of American Community Survey data (2001-2015) and decennial Census data (1940-2000) using IPUMS, and Current Population Survey, Selected Years 1940 to 2020; and Censuses of Population 1940 and 1950, Table A-2 . Available at: https://history.house.gov/People/Search, https://www.brookings.edu/blog/social-mobility-memos/2017/12/04/black-women-are-earning-more-college-degrees-but-that-alone-wont-close-race-gaps/, and https://www.census.gov/data/tables/time-series/demo/educational-attainment/cps-historical-time-series.html.
Figure 10. Correlation of the Incrementation of the African American Congresswomen, and their Attainment of Bachelor’s Degree or Higher: 1960-2020.
satisfactory as their higher educational achievement. That is no compatible speed to their higher educational attainment rate in the same year.
As far as the methodology is concerned, the research has used a triangulation of data from different sources such as the Census Bureau, reputable, guaranteed research centres such as Brookings, National Archives, Center for African American Women and Politics, Library of Congress, The White House in order to get access to reliable information about the past, and the current situation of African American women regarding their higher educational attainment, and congressional participation.
Then, the paper links the higher educational results in 1969 with the contemporary higher educational status of the African American women, and does the same with their Congress participation rates, and then correlates all the results together. In order to do that, I have designed my own figures, tables, statistical pies, bar charts and line charts, using the data that were gathered to the fullest, digging for the essence of the correlational tie that connects the Congressional situation of the African American women and their higher educational status from 1969 onwards to the present.
To accomplish that, evidence data came from the American Census Bureau from 1969 to present, prestigious research centres, as well as the previously mentioned sources. Afterwards, I compared them in order to prove the hypothesis that the deteriorated higher educational condition of the African American women in 1969 affected their political integration in the Congress at that time and that phenomenon continued to be true for the African American women in the 21st Century.
The target group for the detection of the higher educational progress is the African American women with bachelor’s degree or higher who aged 18 years old and over from 1969 to 2020 from the US Census Bureau of 1960, 1970, 1980, 1990, 2000, 2010, 2020. And the target group for pinpointing the Congressional representation is African American Congresswomen from 1969 to present from History, Art & Archives, U.S. House of Representatives (2023) .
4. General Discussion and Conclusion
The American Congress remained a white males’ territory for several decades.
In 1969, Shirley Chisholm became the first African American Congresswoman and she continued to be the only black woman in the Congress until 1972. The total number of the Congress members was 450 in 1969, so black women’s participation represented 0.22%. That ratio is almost 0% of the African American women who served in the Congress from 1969 to 1973.
The research shows that when the bachelor’s degree’s educational attainment rate of African American women was from 4.0% to 6.0% during the period of the 60s, and the 70s or, in other words, during Shirley Chisholm’s early Congress years, the result was almost 0% of the African American women in the Congress, as Shirley Chisholm was the first and the only one in that place during that time.
The higher educational attainment of African American women increased 24.50% since the 70s, while their participation in the US Congress increased only about 6.44% and that happened along half a Century.
It was observed that the percentage of black women who secured a bachelor’s degree or higher was 30.50% in 2020, and their political participation in the Congress was 25 black women members in the 116th Congress, which counts for 5.59% of that Congress.
After more than 50 years since the election of Shirley Chisholm, the mere 30 African American women who serve in the 118th Congress represent 19.48% of the total number of women who serve in that Congress.
There is a correlation between the higher educational level of African American women and their political positions in the US Congress from 1969 to the present.
That leads to the conclusion that education is correlated to their Congressional participation in the second half of the 20th Century as well as in the present. Unfortunately, although the black women’s higher educational attainment rate improved in the recent years, that correlation did not provide a satisfying optimal result. And black women resumed having a diminished presence in the Congress.
The African American women’s higher educational accomplishment increased in the present by about 5 times more than it did in the 70s, and their current political participation in the Congress is nearly 6 times more than their Congressional representation in 1969.
Another noticeable phenomenon is that in about 50 years, the higher educational attainment of African American women increased by a ratio of 0.49% per year, and their Congressional representation improved by 0.12% annually.
The connotation that can be concluded is that African American women will have to wait another 50 years to have another increase of 6.44% of the African American Congresswomen, if that continues to be the rate of rise that they reach every half a Century.
In addition to that, they should have doubled the current percentage of African American women with bachelor’s degree or higher, and that should be 61% of them with bachelor’s degree or higher by 2070. If they continue to have the same speed of rise, then by 2070, there should be about 13% of African American Congresswomen.
NOTES
1For further information, see: sources such as Salvatore (2009) . Civil Rights Voting in America: Racial Voting Rights. Washington: National Park Service.
2Available at: https://www.brookings.edu/blog/social-mobility-memos/2017/12/04/black-women-are-earning-more-college-degrees-but-that-alone-wont-close-race-gaps/ and www.census.gov/data/tables/time-series/demo/educational-attainment/cps-historical-time-series.html.