Characterization of Woody Vegetation in the High Rice Fields of the Commune of Mlomp Oussouye (Ziguinchor, Senegal) ()

1. Introduction
Vegetation is considered an opportunity for human survival and is an essential forest resource. The diversity of woody vegetation participates in the functioning of the ecosystem and allows it to provide goods and services essential to the well-being of populations. In recent decades, Senegalese vegetation cover has suffered a remarkable regression under the influence of anthropic and physical pressures, despite its recognized importance in the past [1] . However, this regression of forest formations is not homogeneous throughout the territory, because in some areas, we are witnessing the opposite effect. By way of illustration, in 2006, the amphibious areas of the Lower Casamance experienced a gradual change of 15% [2] . Due to its geographical position, its bioclimatic personality and its high rainfall, the Lower Casamance is one of the regions that conceal important forest massifs. It remains the natural heritage of the country with a forest cover varying between 30% to 40% [2] . Mlomp, a municipality of Lower Casamance, is a perfect illustration. It is characterized by its rich biological diversity interspersed with large rice fields where the main activity is rice cultivation. Moreover, it is noted more and more a progression of the forest ecosystem towards the high rice fields. The latter, better known as “kuhemba” in Diola, is located under the palm grove or under the clear forest that frequently populates the connecting slopes of the plains to the plateaus and the small cradle-shaped depressions [3] . Thus, these high rice fields, which are used for rice production, have experienced a spatiotemporal colonization of vegetation that is gaining more and more space under the influence of physical and anthropic factors. The wooded area is constantly increasing to the detriment of the high rice fields.
Indeed, 97% of the population surveyed admitted that the annual rice yield no longer covers their food needs and they are forced to buy rice to compensate for the gaps. The growth of vegetation in agricultural land has reduced production, which no longer meets the annual local rice needs.
It is in this context that the usefulness of a characterization of the vegetation situation at the level of the high rice fields of the Commune of Mlomp, supposed to be occupied by agricultural activity, arises. The objective of this study is to highlight the current situation of woody vegetation in these rice-growing areas in order to understand its impact on rice production in this zone.
Presentation of the Study Area
The Lower Casamance region, also called the Ziguinchor region, covers the Atlantic fringe of the southwestern part of the country. It is the result of the division of the former natural region of Casamance in 1984, which gave rise to two administrative entities: the regions of Kolda and Ziguinchor. This region includes the departments of Ziguinchor, Bignona and Oussouye. The latter includes five Communes (Oukout, Djembéring, Santhiaba Manjack, Oussouye and Mlomp). The Commune of Mlomp, formerly called Rural Community, was created in 2013.
Located between Latitudes 12˚28 and 12˚39 North and Longitudes 16˚29 and 16˚41 West, the Commune of Mlomp forms the first loop of the Casamance River at the level of Pointe Saint Georges a few kilometers from the mouth [4] . Due to its geographical position, it is located on the left bank of the Casamance River. It is bordered to the east by the Commune of Enampor, to the west by the Commune of Djembéring, to the north by the Casamance River and to the south by the Commune of Oukout.
The Commune of Mlomp covers an area of 337 km2 with 23 villages and an estimated population of 11236 inhabitants in 2013 or a density of 33 ha/km2 [5] . According to the Local Development Plan [6] , rice cultivation accounts for 90% of agricultural activity. In the 1970s-80s, the average paddy rice yield was 1.09 t/ha over the period 1970-1985 in the area, while the national average was 1.34 t/ha. But with the progression of vegetation in the rice fields and other factors have reduced production by half [7] . It is an area very rich in vegetation with an annual rainfall varying between 1000 and 1500 mm. The majority of the population of this rural, agricultural environment is Diola, belonging to the “Esulalu” sub-group of the Diola-Cassa group (see Map 1).
2. Methodology
For the realization of this work, we considered necessary to use a complementary methodology: documentation, surveys and floristic inventory.
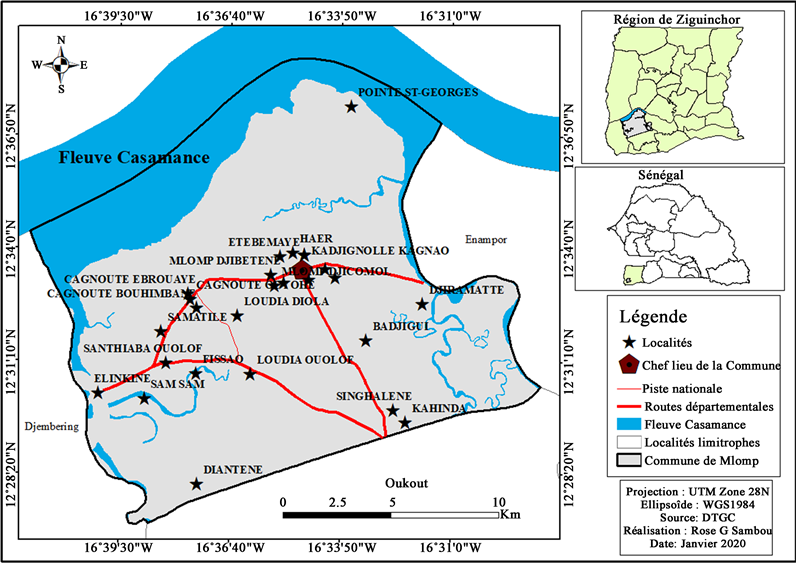
Map 1. Location of the Commune of Mlomp.
2.1. Documentation
It consists in the research of information by the documentary review. In order to achieve the objectives of this study, the documentary research led us to different libraries and research centers. The amplified list is constituted by documents of research centers as the consultation of the works realized in the zone.
2.2. Surveys
Surveys of the populations and interviews made it possible to collect the perceptions of the populations and resource persons in order to analyze the reasons for the evolution of woody vegetation in the high rice fields. According to the demographic data collected [5] , the Commune of Mlomp has 11,236 inhabitants distributed in 23 villages and housed in 1550 concessions. Given the size of the population, we sampled 1/3 of the villages and concessions based on a few criteria, such as villages with significant rice cultivation, villages with woody vegetation in or near rice fields, and villages with rice fields in the Commune of Mlomp. Nevertheless, once we arrived in the field, before beginning our work, we updated the ANSD data. In each village, steps of three were made and within the concessions, we proceeded to survey all households, which allowed us to obtain the following data (Table 1).
2.3. Processing of Satellite Images
Remote sensing, through the processing of satellite images, made it possible to carry out a study of comparison of classifications to identify the dynamics noted in land use. Thus, the images studied come from the United State Geological Survey (USGS) database and 4 dates are used.
The images were taken in the middle of the dry season in order to minimize
![]()
Table 1. Selection of villages and plots to be surveyed.
Source: Faye B., Sambou R. G. field surveys 2019.
the exaggerations of the vegetation cover and the cloud cover [4] . Dates are characterized by ground cover related to vegetation density. Field observations on the types of plant formations and cultivation areas were made in April 2019. (Table 2)
After downloading the different images, a pre-processing of the images, in particular their calibration, the production of colored compositions and directed classifications relied on the performance of the ENVI software while the development of land cover maps was carried out using the GIS tools of ArcGIS software.
The validation of the results obtained by supervised classification from the training plots was done by determining the confusion matrices and calculating the Kappa coefficients. The results obtained from the confusion matrices are satisfactory with accuracy percentages that exceed 90% and kappa coefficients greater than 0.80 for all the images processed (Table 3).
2.4. Floristic Inventory
This approach seeks to identify, in a precise manner, the different types of vegetation present on the study sites. For the realization of this work, it is a question of listing all the woody species and individuals present in the sites to be inventoried. The objective of our inventory is to identify the woody flora present in the high rice fields, the dominance of certain species and the woody stratification.
Nevertheless, the inventory was to be carried out over the entire dry area, along the rice fields of each village to be surveyed. However, given the vastness of the area, we opted to proceed with sampling. We therefore decided to adopt the plot approach.
![]()
Table 2. Summary of acquired images.
Source: United States Geological Survey (USGS).
![]()
Table 3. Landsat image classification accuracy statistics.
Source: USGS, image processing Faye B., Sambou R. G., 2020.
Indeed, the inventory was conducted on five rice fields in the villages surveyed. Of the 08 villages surveyed, only the rice fields assigned to the village of Kadjifolong, better known as “diheumeuk”, and part of Samattite were not surveyed. This is due to the remoteness of the village and the difficulty of accessing them. The rice fields of Sagueur are mostly included in those of Kafone.
However, the plots are arranged in a way that depends on the density of individuals and the biological diversity of the environment. The number of plots per rice field is adopted according to their surface area, so that the rice fields of Kafone “bouyit kafone”, Haer “bousinoit” and Djicomol had more plots with 6 each, Cagnao and Ouyoho had 4 each. Thus, 26 plots were established in all the rice fields of the zone. Square plots were chosen and “the square arrangement is easier to set up than the circular shape, and it is more homogeneous than the rectangular shape [8] . Squares of 40 meters on each side for a surface area of 1600 m2 were created, for a total area of 41,600 m2 or 4.16 ha for the whole.
Also, stratification is carried out in these spaces which were the subject of inventory. Thus, we will subdivide the vegetation structure into four strata: the stratum of species less than 2 m, the stratum of species from 2 to 5 m, the stratum of species from 6 to 10 m and the stratum of species over 10 m.
For the elaboration of this work, materials are used such as a cell phone to take GPS points, a rope, stakes and a camera. These plots are delimited using a 160 m long rope and stakes, then numbered (see Map 2).
2.5. Field Data Processing
After a manual analysis, Sphinx is used, which led to the data being processed with a spreadsheet. Excel software was used to prepare tables and graphs. Electronic tools like mobile phone to take geographic coordinates using mobile topographer and digital camera for photography are used.
Afterwards, the Word software is used for entering and writing the study dissertation. Excel was used for the construction of graphs. These processed data are analyzed during the writing in order to answer the research questions.
The Municipality of Mlomp has significant forest resources. The latter have settled in the rice fields of the area, which requires an important study.
Frequency of species: The determination of the presence of species is necessary in order to be able to highlight the character of homogeneity of each species present in the inventoried space. The species present a significant disparity. Some display a high frequency while others reflect a low or very low frequency. Taking up the words of Gounot M. quoted by these authors ( [9] [10] and [11] ), the author mentions that the low-degree species and those with high degree are not the most interesting but rather those whose attendance is average. On this point, it does not matter whether a species is present in all the surveys or in a single survey. This method will make it possible to differentiate two groups of surveys to know the degree of presence of each class. Ndiaye [9] , quoted by Faye [12] , suggests including only species with an average degree of presence in the
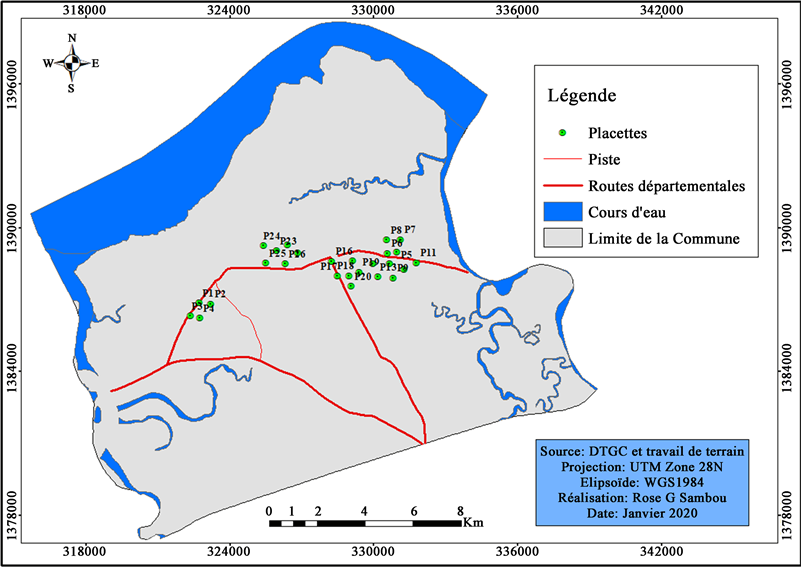
Map 2. Distribution of plots in the high rice fields of Mlomp.
presence table. Faye [13] repeats what ELLENBERG said, which is to retain only species whose degree of presence is between 12% and 60%. However, it is important to point out that this rule does not apply to small areas with few plots, which is why all the plots are grouped together in the same table.
The attendance table is calculated as follows:
P = n/N* 100
n: number of plots where the species exists;
N: total number of plots.
To do this, we will first explain how the plots were laid out, then list the species present in the area, and finally estimate the potential of the woody vegetation available.
Differential analysis: As part of the processing of field surveys, the differential analysis study is only relevant to characterize the proximity between floristic plots. The main objective of this method is to highlight the degree of similarity between the lists of species inventoried in the distinct locations (better present it in the methodology). This statistical treatment used in this work is obtained from Jaccard’s formula quoted by Faye [11] :
PJ = C * 100/(A + B) − C
A = number of species in the first list;
B = number of species in the second list;
C = number of species common to both lists.
Abundance rate: The abundance rate shows the percentage of each species recorded in the rainfed rice fields. This rate is obtained by dividing the number of individuals of a species by the total number of individuals of all species and is expressed as a percentage. (Methodology)
AT (%) = Ni/Nti * 100
Ni: Number of individuals of a species;
Nti: Total number of individuals of all species.
The abundance rate of individuals in the high rice fields of Mlomp makes it possible to see the percentage of each species. It is represented as follows in the table below.
TA = Abundance rate
Diachronic study: the dynamics of vegetation in African countries is strongly linked to livelihoods and production systems [13] . Thus, in Basse-Casamance, the action of man and physical factors are at the source of the spatial dynamics of the ligneous which is perceived from two angles, either positive or negative.
In this context of modification of land use in the Municipality of Mlomp, it is important to make an inventory of land use. The analysis of the latter aims to assess the dynamics of land use in order to see the changes in this area. Thus, the diachronic study made it possible to bring out the monograph of some landscape units, in particular water, mangrove, mudflat, tanne, rice fields and terrestrial vegetation. Therefore, a diachronic analysis from 1973 to 2019 with 2 intermediate dates namely 1986 and 2003 is adopted.
Ultimately, all the steps developed regarding the methodology facilitated the writing of this article.
3. Results
Known for the richness of its ecosystem, the Municipality of Mlomp contains significant forest resources. The latter have settled in the rice fields of the area. It is for this reason that we will present the situation prevailing in the area by characterizing the woody vegetation. The study of the floristic composition seems essential to confirm the colonization of woody vegetation in high rice fields.
Table 4 shows the situation of land use in 1973, 1986, 2003 and 2019. The results obtained, through the diachronic study, show significant changes during the period studied. Thus, to better understand this dynamic, a detailed analysis of the different dates is carried out in order to determine the state of play of the environment in a sequential manner. For Badiane [2] , this approach is important because it makes it possible to have a clearer referential reading admitting to making the analysis of the process of evolution of space practical according to the years considered. To determine the trend of change, the area of each class was calculated, allowing the classes to be compared from year to year.
![]()
Table 4. Land use statistics for the Municipality of Mlomp from 1973 to 2019.
Source: FAYE B. Sambou. R. G, data processing 2020.
Land use between 1973 and 2019 experienced a very turbulent dynamic of the different shaped landscape units. All land cover classes have experienced notable variations. Thus in 1973 and 1986, the occupation was particularly predominated by the rice field with respectively 8882.49 ha (29.86%) and 8281.40 ha (27.84%). On the other hand, in 2003 and 2019, this rice-growing area experienced a sharp decline with respectively 6658.54 ha (22.38%) and 6622.24 ha (22.26%). From 1973 to 2019, terrestrial vegetation has grown. Its area increased from 5673.91 ha in 1973 to 6227.27 ha in 1986, an increase of 553.36 ha. This increase in vegetation continues with an increase of 230.23 ha from 2003 to 2019.
In 1973, the mangrove was dense with an area of 7330.69 ha (24.64%). But in 1986, it experienced a strong decrease with an area of 5686.93 ha (19.12%). In 2003 and 2019, it began to regenerate with respective rates of 21.95% and 21.10%. During the period studied (1973 to 2019), the water was constant with rates varying between 17% and 18%. From 1973 to 2019, the mudflat occupied a small spatial portion behind the tanne with rates varying between 7.11% and 11.45%. As for the tan, it occupied the smallest area throughout the study period with rates of less than 5%.
Map 3 represents the land use units between 1973 and 2019 in the Municipality of Mlomp. Some spatial features have experienced changes in the occurrence of woody vegetation and rice paddies. For a good treatment of this dynamic, we compared the results of the processing of satellite images from 1973, 1986, 2003 and 2019. (Table 5) In addition to this, the information from field surveys made it possible to better understand the change mentioned in the area.
This 46-year period constitutes the synthesis of the evolution of the plant cover but also of the high rice field. During these years, important changes in nature have emerged with two-way dynamics. These are on the one hand the progressive dynamics of the regressive terrestrial vegetation and on the other hand the regressive dynamics of the rice fields. Woody vegetation has increased by 26.15%, or more than a quarter of the plant cover. This change in situation contributed on the one hand to the decline in the rice area of −25.44. Thus, this
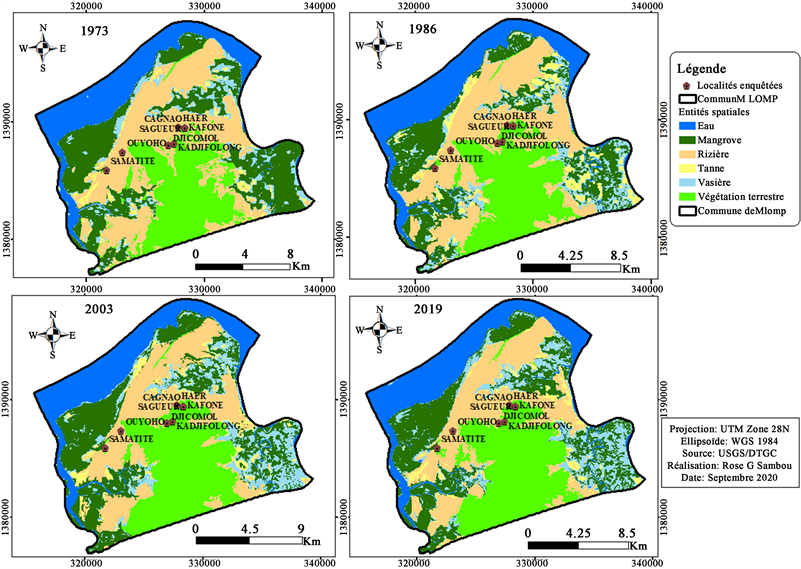
Map 3. Land cover between 1973, 1986, 2003 and 2019 in the municipality of Mlomp.
![]()
Table 5. Evolution of land use areas.
Source: Faye B., Sambou R. G. data processing 2020.
evolution has changed the physiognomy of the environment with the presence of woody plants in the dry rice fields, hence the conversion to wooded savannah with an evolution of woody species of 0.57% each year.
From 1973 to the present day, the area of the rice field continues to regress in favor of the plant cover. This situation is the result of physical phenomena but also of human action. Due to the drop in rainfall, a good number of rice farmers have abandoned their land because they could no longer fulfill their function and resorted to rural exodus, which may justify this change in land use. Since nature abhors a vacuum, after the abandonment of these lands, many species proliferated.
The use of Landsat data has made it possible to understand and analyze the various changes that have occurred in the Municipality of Mlomp during these 46 years. In short, from 1973 to 2019, the diachronic study shows a change in the situation with an increase in vegetation and a decrease in the rice-growing area. Indeed, if we compare these three periods, we find that the evolution is much greater between 1986 and 2003. This period is characterized by a drop in rainfall, the most intense period of the Casamance crisis and an outbreak of rural exodus which led to the abandonment of land. Thus, overall, the Municipality of Mlomp today presents an increase in woody plant cover. In this dynamic, many species have occupied this space which was formerly intended for rice cultivation. Therefore, it is important to identify the causes of this evolution.
3.1. Species Present in the High Rice Fields of Mlomp
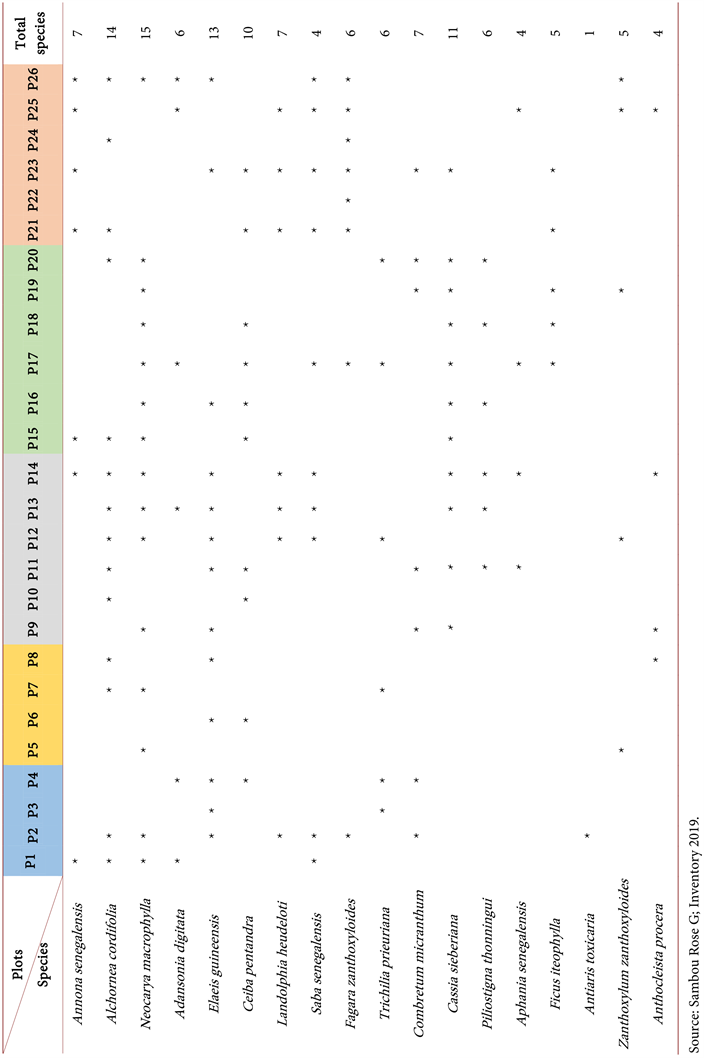
In this section, all the species and individuals identified in the various upland rice fields in the villages that were surveyed are presented in Table 6. Thus, 26 plots divided into 5 rice fields were carried out. Table 6 shows all the species recorded and the number of plants counted in the flooded rice fields of Mlomp.
The upland rice fields that were studied contain a variety of species depending on the site. In each rice field, the presence of species varies from one plot to another. Our presence on the sites to be inventoried made it possible to note the diversification of the progressive dynamics of the woody flora from one rice field to another. In the villages where the forest massif is denser, there are high rice fields with greater floristic diversity.
It is noted that rice fields in villages with dense forests appear to be more important in terms of specific diversity.
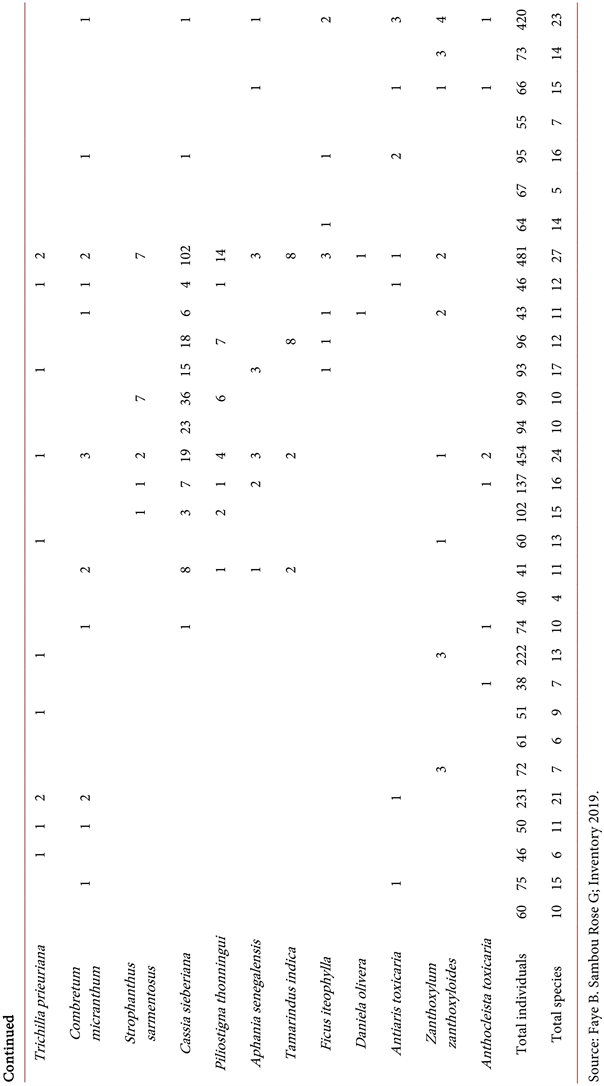
This table shows that the inventory was carried out in 5 rice fields in the Commune of Mlomp. It includes species and individuals present in all the rice fields that were studied. In all 26 plots, 30 woody species were identified and divided into 1808 individuals. The number of these individuals varied from one rice field to another. Thus, the Haer “Bousinoit” and Kafone “Bouyit Kafone” rice fields contain more individuals and species than the others, with coverage rates of 26.6% and 25.1% respectively. It is in these places where the high abandoned rice fields are more important especially with the security situation, the migration of the young and the drop in rainfall due to climate change. In the five sites inventoried, these two rice fields contain more than 50% of the total individuals, i.e. a proportion of more than 1/2.
The total number of individuals in the “Bousinoit” rice field exceeds the total number of individuals in Cagnao and Ouyoho by more than 1%, hence the high presence of individuals in this rice field compared to the others. Of the 30 species
Table 6. Species present in the high rice fields of the targeted villages in the Commune of Mlomp.

recorded in the rice fields of Mlomp, 27 exist in those of Bousinoit and 24 in those of Bouyit kafone. This can be explained by the fact that the rice fields of these villages contain a dense forest than the others, with a high diversity of species, which may be due to a more rapid conversion and adaptation. Strong practice of arboriculture with Anacardium occidentale is noted in the zone and this is reflected in the very large number of trees found in “Bouyit Kafone”.
The rice fields of Cagnao and Ouyoho are home to fewer individuals than the others with a rate of 12.27% and 12.8% respectively. They also record fewer species with 21 for Ouyoho and 13 for Cagnao. This is explained by the fact that these rice fields had fewer plots than the others. As for the Djicomol rice field, it represents a rate of 23.23% with the presence of 23 species, ahead of Cagnao and Ouyoho. The areas occupied by vegetation are smaller in the latter sites than the first due to the return of migrants and the establishment of orchards.
Plots 13 and 14, which were carried out in the rice fields of Bouyit Kafone, have more species and plants with 102 and 137 respectively. This was followed by plots 16 and 18 in the rice fields of Bousinoit with 99 and 96 respectively. Plot 8 in the rice fields of Cagnao recorded the lowest number of individuals with 38. This shows that the high rice fields of the area have recently been invaded by vegetation due to natural and anthropogenic factors such as erosion, the drop in rainfall, the lack of manpower, etc
In addition, Uvaria chamae is the most identified species with 491 individuals, i.e., 27.2%, which means that more than 1/4 of the individuals present in these rice fields are Uvaria chamae, Guiera senegalensis comes in second place with a rate of 15.1%. It is noted that Faidherbia albida, Anacardium occidentale, Cassia sieberiana and Parkia biglobosa are strongly represented with 8.9%, 8.2%, 6.7% and 5.9% respectively. There is also the presence of very rare species that have been the subject of a single census as Daniellia oliveri and Hyptis suaveolens.
3.2. Estimating the Potential of Available Woody Vegetation
In order to determine the potential for woody vegetation available in the upland rice fields, a number of parameters were taken into consideration. Indeed, characterization of the inventory results showed the frequency of species and similarity of rice fields through differential analysis. For greater clarity, we measured the abundance rate, stratification and density of species.
3.2.1. Frequency of Species
Thus, if we base ourselves on the proposal of ELLENBERG, we will have a presence table that highlights the plant formation between 12% and 60%. Of the 30 species inventoried, more than half or 18 are represented in Table 7. Among the 12 species not represented, 7 have a degree of presence higher than 60%, with the dominance of species such as Uvaria chamae (88%) and Faidherbia albida (81%). These species are practically represented in more than 16 of the 26 plots in the series, which is why they were automatically eliminated from the table. Five (5) other species have a degree of presence of less than 12%, which is why
Table 7. Presence of species in the high rice fields of the Commune of Mlomp.
they were also eliminated from the series. Thus, only 18 species are maintained in this table. The latter is dominated by the presence of Neocarya macrophylla and Alchornea cordifolia which represent degrees of over 50%. The presence of Cassia sieberiana in this area is a significant fact in this environment marked by a deficit of rainfall and a conversion to a savanna. This species whose presence is more than 40% resists better to the situation of the zone marked by salinization and a deficit of the pluviometry.
Based on the degree of presence, we were able to categorize all species into 5 classes, each with a specific characteristic (Table 8).
This table characterizing the species present in the rice fields of Mlomp is made using Table 3. It is different from the presence table because it takes into account all the species present in the rice fields of Mlomp. It shows five classes in the distribution of species in space according to presence.
The classes from Table are also distributed in a more visible way by clearly representing the species concerned in Table 9.
Based on this species classification, a presence histogram is established. This provides a good overview of the homogeneity of the ligneous flora.
![]()
Table 8. Characteristics of the species.
Source: Faye B, Sambou R. G. 2019 data processing.
![]()
Table 9. Characteristics of the species by identification of the species concerned.
Source: Faye B, Sambou R. G. 2019 data processing.
From the observation and analysis of this table above, four classes have been revealed. We find that class I, whose degree of presence is accidental and the lowest, records more species (11) or 37%. It is followed by class II species whose presence is incidental, i.e. rare, which represents a rate of 27%. Class IV, whose presence is frequent or important, brings together 17% of the species. Class III, whose presence is quite frequent, and class V, whose presence is very frequent, are the least represented with rates below 15%.
3.2.2. Differential Analysis
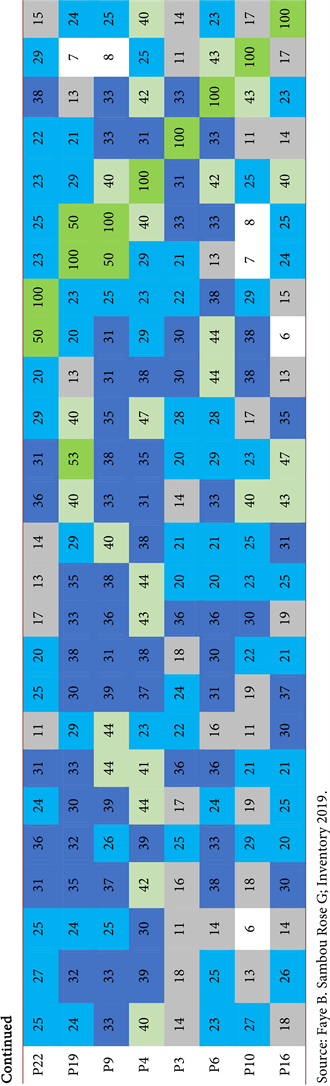
The application of this formula makes it possible to classify and group plots by similar groupings. It also helps to do a differential analysis based on a matrix table following the order. Using this formula will allow the construction of two double entry tables with rows and columns composed of plots. The first table consists of grouping the plots according to the inventory order. The classification of this first table has not been modified. However, in order to show more affinities between plots, a second table is established. It aims at grouping the plots by order of similarity. This allowed us to obtain the results represented in the two following tables (Table 10 and Table 11).
Referring to the matrix data provided in the tables below, we can see a certain trend emerging between the different plots. Indeed, this work shows that all the plots have a certain similarity even if some have a very low degree. The establishment of this matrix brings out different plant groups that have a strong or weak degree of similarity. This means that these spaces have been invaded by the same species but to varying degrees.
Thus, it was identified plant formations with a high degree of similarity of more than half of the species: (P1, P26, P25) (P23, P21, P2, P12), (P14, P13), (P13, P5, P7, P20), (P11, P15, P18, P17), (P8, P24, P22) and (P19, P9). Beside these groups, two other groups with an important affinity between 40% and 49% are noted, they are (P5, P7) and (P8, P24). The other plot groupings show little to very little similarity. Further rearrangements could be made to better bring out the similarities but this is tedious work.
This pattern of similarity shows that plot associations are not necessarily similar or grouped according to rice fields. Some plots have a degree of similarity closer to those of another rice field than to those of their own rice field. This is the case for plot 1 in Ouyoho and plots 25 and 26 in Djicomol, as well as P5 and P7 in Cagnao, P13 in Bouyit Kafone and P20 in Bousinoit (Haer). This is because virtually all of the upland rice fields in Mlomp have the same species. The establishment of woody flora is a phenomenon that has affected almost all rice fields in Mlomp as a result of a number of factors. These rice fields have undergone a change of situation with the presence of adaptation and reconversion species. This will allow the detection of the specific diversity and their similarity.
3.2.3. Abundance Rate
The abundance rate of individuals in the high rice fields of Mlomp allows us to
Table 10. Value of the similarity matrix for the upland rice fields of Mlomp according to inventory order.
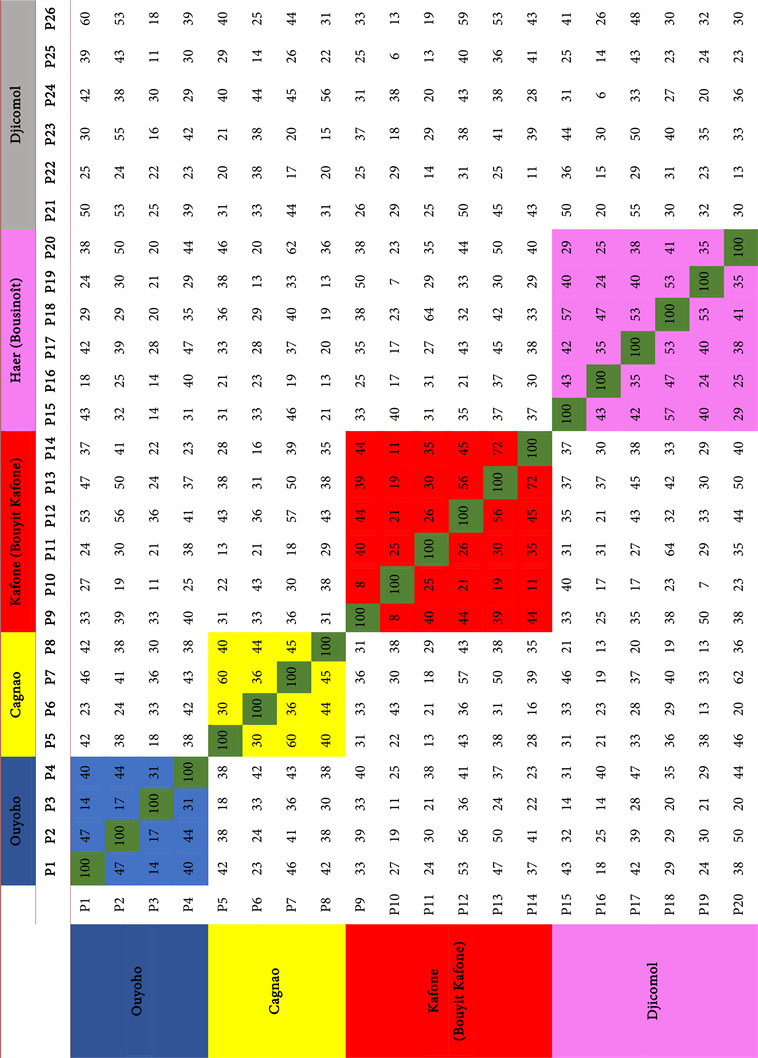
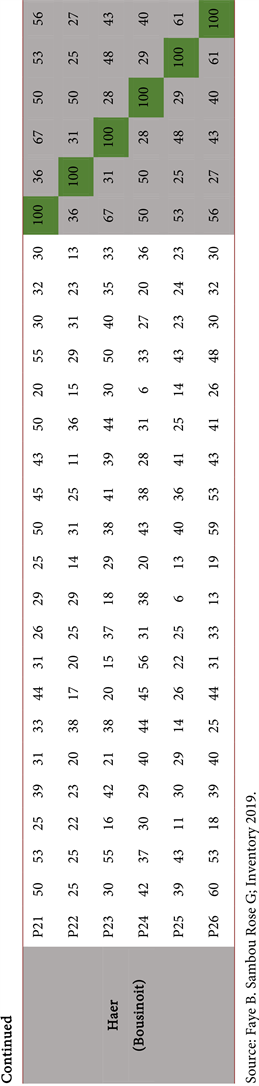
Table 11. Differential analysis matrix in the form of plot grouping.
see the percentage of each species. It is represented as follows in Table 12.
Many of the species Anacardium occidentale are planted by the population for commercial purposes. The other species present in the rice fields of Mlomp have a low or very low rate of occurrence, ranging from 3.7% to 0.1%. Two species have the lowest rates and are presented only once in the table: Daniellia oliveri, Hyptis suaveolens.
In this area, an unequal distribution of the abundance rate of species is noted, varying between 27.2% and 0.1%. Thus, a strong presence of species of less than 4% is more materialized with a number of 24 species out of the 30 species that count the surveys. There are 5 species between 5% and 20%, and only one species has a very important rate of more than 25%.
It is also important to note that the cover in the high rice fields is globally low with relative values of less than 30%. The rice fields of “Bousinoit” and “Bouyit kafone” have the highest rates with a little over 25%. On the other hand, coverage in the rice fields of Cagnao is less important, at just over 12%. This contrast between the different zones can be explained by the fact that the areas with dense cover are dominated by woody vegetation and are surrounded by dense forest, while the rice fields with low cover are dominated by shrubs. Thus, areas with dense cover can be considered as woody savannahs, while areas with low cover are considered as steppe.
3.2.4. Stratification
It consists in determining the height reached by each individual. Thus, it is important for any study of woody vegetation to characterize the vertical structure of the population. The main purpose of this study of the height of the woody plants is to determine the growth of each species but also to indicate the site that shelters more old species. To do this, the distribution of the different strata in each tall rice field studied was carried out. This was done by class, which allowed us to identify three strata: those less than 2 m, 2 to 10 m and more than 10 m.
Following the sorting of Table 13, we note that the vertical structure of the woody vegetation in the high rice fields of Mlomp is essentially dominated by the stratum from 2 to 10 m. It represents a coverage rate of 67% of the 1808 individuals recorded in the different rice fields of the zone. This stratum, marked by medium-sized individuals probably established in the last decade, is dominated by the presence of species such as Uvaria chamae (242), Anacardium occidentale (142). Species such as Faidherbia albida (123) and Guiera senegalensis (115) have a fairly high representation. The stratum of less than 2 m, composed essentially of small species, is also densely represented with an average percentage of 31%. This stratum is globally dominated by species like Uvaria chamae (249) and Guiera senegalensis (158).
The vertical structure of the species in the high rice fields of Mlomp shows that the individuals encountered are small to medium in size. The important presence of the young population is explained by a strong natural regeneration of species often considered as adaptations. The stratum of more than 10 m is
![]()
Table 12. Abundance rates of species in the upland rice fields of Mlomp.
Source: Faye B., Sambou R. G.; Inventory 2019. TA = Abundance rate.
![]()
Table 13. Stratification of species present in the high rice fields of Mlomp.
Source: Faye B., Sambou R. G.; Inventory 2019.
very weakly represented with a rate of 2% or 33 feet on the 1808 individuals counted. In this stratum, species such as Parkia biglobosa (10) and Elaeis guineensis (9) are more numerous.
This shows that the colonization of the high rice fields of Mlomp by woody vegetation is characterized by the predominance of medium-sized species but also a very low presence of very large species. This reveals their recent installation in these agricultural environments.
3.2.5. Density
The study of density is also important in the development of the available potential. In this study, the number of individuals per unit area is used to evaluate the richness of woody species. Thus, the average density is obtained from the ratio between the number of individuals and the area. Thus, this study was carried out in the five (5) sites which were the object of inventory in the Commune of Mlomp. On this, in the rice fields of Cagnao and Ouyoho, four (4) plots of 40 m of side were realized in each site, which makes a surface of 0.64 hectare. Concerning the three other rice fields of Kafone, Haer, Djicomol, they each benefited from six (6) plots of 40 m sides, which makes a density of 0.96 hectare. In this sense, out of the five (5) sites that have been inventoried, an area of 4.16 ha has been inventoried.
From these elements, the average density of species in the Commune of Mlomp is 435 individuals/ha.
On reading Figure 1, the first impression remains a strong inequality of densities according to species. Indeed, on an area of 4.16 ha, 1808 individuals were
![]()
Figure 1. Average density of species in the high rice fields inventoried in the Commune of Mlomp (Source: Faye B., Sambou R. G.; Inventory 2019).
recorded, giving an average density of 435 individuals per hectare in the rice fields of Mlomp (see Appendix). Thus, this study makes it possible to detect that the species Uvaria chamae records the strongest density with 118 individuals per hectare that is to say more than 1/4. The species Guiera senegalensis, which comes in second place, is also densely represented with an estimated density of 66 individuals per hectare. After these two, species such as Faidherbia albida, Anacardium occidentale, Cassia sieberiana and Parkia biglobosa also recorded fairly significant densities per hectare, with 39, 36, 29 and 26 respectively. On the other hand, most of the species recorded low or very low densities ranging from 16 to 1 individual per hectare.
In this sense, we can say that the high rice fields of the Commune of Mlomp are characterized by a rather important and high density. This can be explained by the fact that it is an area of agricultural origin that has changed its vocation due to natural and anthropic factors to become a wooded area.
The processing of the inventory data allowed us to establish the current status of woody flora in the high rice fields of the Commune of Mlomp. After spreading the results, we were able to count 1808 individuals and 30 species in all five (5) sites studied. The colonization of woody plants in the high rice fields of Mlomp varies from one site to another. This is true in all possible directions of observation, whether in numbers, density or height. This is more pronounced in Bousinoit (481), Bouyit Kafone (454) than in Djicomol (420), Ouyoho (231), and Cagnao (222). Through the stratification table, we note that the diversity is characterized by the predominance of medium-sized species with a rate of 67% out of the 1808 individuals listed in the whole Commune.
4. Discussion
The analysis of the woody flora of the cultivated areas of the Djilor District revealed a richness of species. In all 26 plots, 30 woody species were identified and distributed among 1808 individuals (see Appendix with the number of plots per area). The number of these individuals varied from one rice field to another. In the five sites surveyed, two rice fields contained more than 50% of the total number of individuals, i.e., a proportion of more than 1/2. This is because the species are spread by herbivores and by wind [14] . In recent years, the evolution of the tall rice fields could also be explained by their natural regeneration capacity by seedlings, suckering and/or stump sprouts [15] .
However, the high frequency of Anacardium occidentale and Faidherbia albida suggests that their socioeconomic importance favors their conservation. According to some authors [16] [17] and [18] , the choice of species to be conserved in the fields is based on certain peasant logic. Thus, species of socio-economic interest such as Faidherbia albida, Anacadium occidentale and Mangifera indica would be favored and conserved in high rice fields.
The species richness implies that competition was relatively high due to the size of the individuals. The actual stand density was 435 individuals/ha. It was also higher than that found by Yameogo [19] . This could be related to differences in demography and intensity of agricultural activity. The ratio of theoretical to observed density is low, reflecting a tight distribution of individuals in the upland rice fields. The very high regeneration rate in these rice areas demonstrated the high potential for stand renewal. Among the species that showed a high number of seedlings. The high rates recorded by these species would be related to their modes of regeneration, by seeds and by stump sprouts or suckering, which gives them a great capacity for colonization of the environments known as anthropized.
The distribution of individuals by stratum gave an irregular structure marked by the dominance of adult individuals. According to Pindi [20] , this reflects a stand whose dynamics are permanently disturbed by the management objectives of the owners of the high rice fields. Also in relation to height, the analysis of the distribution showed the importance of individuals, beyond 7 m, with an irregular structure. This reveals the importance of tall tree individuals.
5. Conclusions
At the end of this study which is dedicated to the study of the dynamics of the woody vegetation in the high rice fields, a certain number of results found allowed us to appreciate the behavior of the woody flora in the dry rice fields of Mlomp. The latter is facing a change in the situation, namely the progression of woody vegetation that took place around the 1970s. This area has been transformed into a wooded savannah with the dominance of trees of average size ranging from 2 to 10 m.
The cartographic results showed significant changes during these 5 decades. At the end of the results obtained, we demonstrated that between 1973 and 2019, the vegetation experienced a strong progression to the detriment of the rice fields. Thus, the diachronic study showed an evolution of the vegetation according to the periods with a significant increase of 28.82% between 1973 and 1986 and a fairly significant growth of 13.12% between 1986 and 2003. As for the period 2003 and 2019, the progression is low because the variation is only 9.43%, which suggests a reduction in the progression of the ligneous of almost 20% between the periods, and it could even return to normal. This state of affairs is the joint result of physical conditions and human action. The physical elements act in interrelation with the socio-economic realities to give the spectacle currently observed in the environment. A set of physical and human factors contribute to the establishment of woody vegetation in rice fields. In the context of rainfall deficit combined with silting, the degradation of rice fields is notorious, leading to their abandonment. As these spaces are no longer able to serve their intended functions and have been abandoned, opportunistic woody species have been installed. Man, one of the people responsible for this phenomenon through his actions, has also contributed to changes in the situation through migration (reduction of the workforce), arboriculture and grazing. The climatic deterioration combined with socio-economic conditions has pushed people to join the dynamics of migration, which has also weakened the support necessary for the maintenance of rice-growing land.
This woody vegetation is proliferating as it goes along, hence the presence of a good number of adaptation species as well as reconversion species. Nevertheless, in this study, the natural and anthropic factors explain the complexity and the analysis of these changes of state in the environment. As a result, it is important to emphasize the factors involved in this colonization and the effects that may affect the environment and rice production.
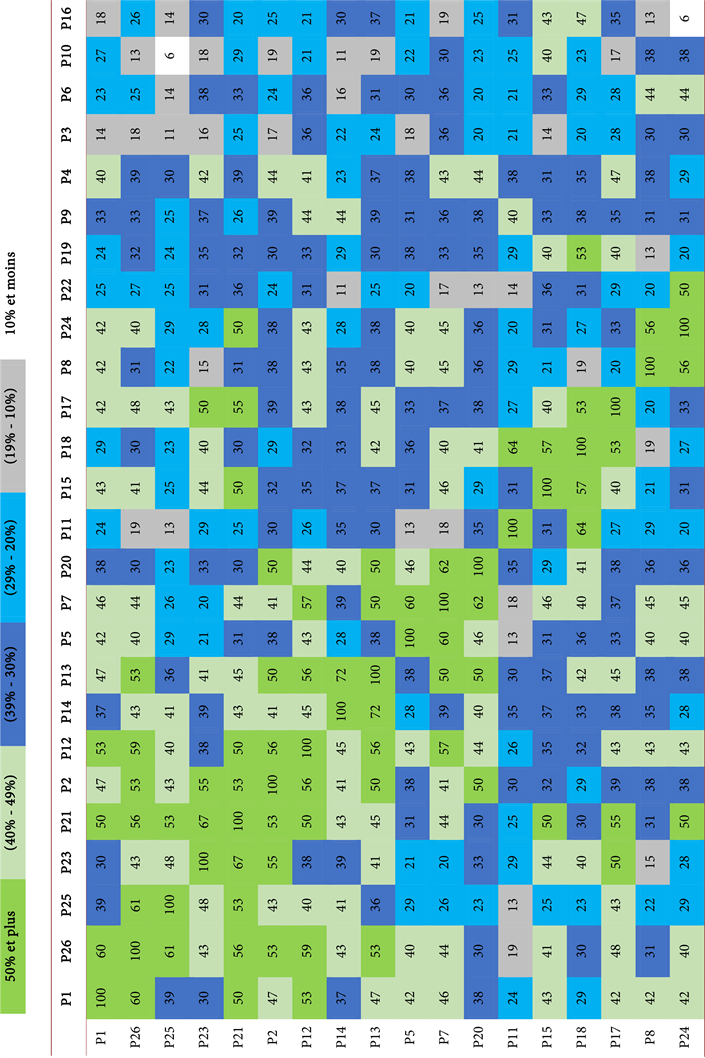
Appendix
![]()
Table A1. Species present in the high rice fields of the targeted villages in the Commune of Mlomp.