Prediction of Attention and Short-Term Memory Loss by EEG Workload Estimation ()
1. Introduction
The electrical activity of brain neurons can be recorded methodically using electroencephalography (EEG). For these recordings, the scalp is used, and numerous electrodes are positioned there in different, specific places. Analyzing recorded EEGs helps describe the status of the brain with deviations from the normal/healthy state, and such deviations engender epileptic seizures, sleep difficulties, attention loss, memory loss, mental stress, and more. Visual examination of the recorded EEG data is not feasible due to the huge volume of data [1] . Successful assessment and understanding of both low and high mental workload states place a high demand on the ability to retrieve meaningful information from EEG signals. Then, considering only a few crucial signal characteristics by using Machine Learning (ML) makes EEG analysis simpler than laborious, time-consuming big data sets for analyzing mental states.
The idea of human mental workload is the cornerstone of research on the assessment of the human brain functions. The broadest definition of mental workload can be stated as the cognitive cost of completing a task in a limited amount of time and its associated prediction is required in order to forecast the operator and system [2] [3] . Mental workload has been identified as a crucial element that significantly affects the human brain’s performance [2] . As a concept, it has been widely used in the design and evaluation of complex human-machine systems and environments, including those for operating aircraft [4] , operating trains and vehicles [5] [6] , different human-computer and brain computer interfaces [7] [8] [9] and educational contexts [10] [11] [12] . Over the past two decades, there has been an increase in interest in studying mental workload due to the emergence of a number of technologies that need users to operate at various levels of cognition and in a variety of environments. The survey of the literature reveals various works on workload EEG analysis to determine attention loss and short-term memory loss. But only a few of them have been conducted for workload analysis where the adequate and useful features are extracted. Different approaches have been put forth to gauge the workload of the human mind using simultaneous tasks (SIMKAP). One of them is an arithmetic task that was introduced to perform mental stress or workload analysis [1] . An approach using (Independent Component Analysis) ICA with three types of task was introduced in [13] for choosing the most suitable EEG channels for classifying mental tasks using power spectrum density (PSD) feature extraction only and it got only 70% accuracy. Simultaneous task EEG workload dataset description with experimental results was proposed with 69.2% accuracy using FFT based PSD features extraction technique only [14] . Another method for emotion recognition was reported by the work in [15] where two types of workload were predicted and it achieved a classification accuracy of 73.14%. Mental workload recognition from EEG signal using deep learning techniques was conducted in [16] and it achieved only 65% classification accuracy. Mental workload estimation using EEG was also introduced by Vishal Pandey et al. in 2020 in an international conference with maximum 72% classification accuracy [17] . Cognitive Workload assessment on simultaneous tasks was proposed by Wonse Jo et al. in 2022 with 74.68% [18] .
We found a glaring deficit in effective feature extraction and feature selection, along with classification based on our examination of the literature that has been discussed in above. In this study, we proposed a feature selection technique selecting the dominant features after feature extraction with fourteen types of statistical features results high classification accuracy from the literature to fill up the gap of the literature and thus classify low and high workload analysis from EEG data to find out the attention loss and short-term memory loss. This is how the rest of the paper is structured: The “Materials and Research Methods” section provides a chronological explanation of the research, including research design and research procedure. The “Results and Discussion” section is next provided, and lastly the “Conclusion” section.
2. Materials and Research Methodology
Materials and required methodology used in this research is provided in this section descriptively. The tasks related to experiment, a description of a dataset used, wavelet transform (DWT), statistical data computation for feature extraction, and a detailed description of classifiers used along with the performance metrics for validation are illustrated in the following subsections.
2.1. Dataset Description and Experimental Design
This paper mainly describes EEG workload estimation technique using simultaneous task or simultaneous capacity (SIMKAP) [14] . The data for each subject follows the naming convention as subno_task.txt. For example, sub01_lo.txt is filtered EEG data for subject 1 at rest, while sub23_hi.txt is filtered EEG data for subject 23 during the multitasking test. The rows of each datafile correspond to the samples in the recording and the columns correspond to the 14 channels of the EEG device, those are AF3, F7, F3, FC5, T7, P7, O1, O2, P8, T8, FC6, F4, F8, AF4, respectively depicted in Figure 1 [14] .
![]()
Figure 1. Electrodes positions based on 10 - 20 international system for EEG recording with The Emotiv EEG Device [14] .
In order to minimize the impact of any between-task activity, the start and last 15 seconds of data from each recording were removed, yielding recordings that lasted 2.5 minutes. After each trial section, subjects were asked to assess their perceived mental workload (MWL) on a scale from 1 to 9.
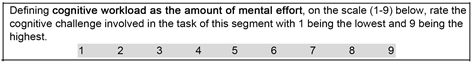
Questionnaire on a 1 - 9 scale for rating of mental workload, which subjects were required to fill after completion of each segment of the experiment has been shown in above screenshot [14] . This was done subjectively confirming that the subject actually felt more work during the test than they did while they were resting. A rating of 1 - 3 can be interpreted as low (lo) workload, (4 - 6 as medium workload was not considered in this study) and 7 - 9 as high (hi) workload. In both low and high workload states, 128 Hz sampling frequency was used with 2.5 minutes of EEG recordings utilizing the Emotiv EPOC EEG headset [14] . According to a study in [19] , the most popular measure in cognitive load studies is the 9-point rating scale [20] , which is comparable to the NASA-1 TLX’s to 21 scale.
The overall functionality of the system is composed of several parts as depicted in Figure 2. Those parts include collecting the dataset from the IEEE Data Port in text format, extracting data based on channels, arranging the processed data corresponding to its label to fit for classification and finally classifying EEG data during high and low workload.
To determine the attention loss as well as the short-term memory loss in brain wavelet decompose technique was applied to decompose EEG signal into its sub band signals, and the relative power of those signals, namely, theta, alpha and beta signals, was determined using percentage of five signals, preparing area and radar plot in excel during high workload.
2.2. Discrete Wavelet Transform
In order to analyze the time-frequency relationship of biomedical signals, discrete wavelet transform (DWT) is used [21] . This DWT is especially helpful in EEG signal processing because of its non-stationary properties. By using long time frames for low frequencies and short time frames for higher frequencies, this transform generates an accurate time-frequency evaluation. The DWT decomposition of a signal uses two down samplers by 2, time series high-pass and low-pass filtering, and time series high-pass and low-pass filtering.
In this case, the mother-wavelet is indicated by DWT’s high-pass filter g(n), and its mirror version is expressed by DWT’s low-pass filter h(n) [21] . Figure 3 depicts the mother wavelet of the Daubechies wavelet (db4) and the scaling function associated to it. The approximation and detail coefficients, marked by A1 and D1, are the outcomes of the first high-pass and low-pass filters respectively.
![]()
Figure 2. EEG workload estimation and relative power calculation during SIMKAP.
![]()
Figure 3. Scaling function and mother wavelet (db4).
The A1 is additionally disintegrated, and procedure is carried out again and again until the desired number of breakdown levels is reached [21] [22] . The dilation function φj,k(n) is reliant on the low-pass, and the wavelet function ψj,k(n) keeps on the high-pass filter, which is represented as follows.
(1)
(2)
where,
;
;
; J = log2(N); and N represents the length of the signal [23] . The primary frequency components of the signal are used to determine the highest decomposition level [24] . DWT coefficients are the dot products of the original time series and the chosen basis functions. The term approximation coefficients Ai and the another term detailed coefficients Di in the ith level are expressed by (3) and (4) [24] .
(3)
(4)
where,
and M is the length of the EEG time-series in the discrete points.
3. Signal Processing, Statistical Features Calculation and Workload Estimation
Computer-based intelligent systems for analysis of mental stress are very useful in diagnostics and disease management. This part presents data acquisition, signal processing techniques and finally mental workload classification for human brain workload estimation. The elimination of noise by digital filter enhances the quality of signal and features extraction facilities. The subject wore a 10 - 20 system for EEG recording. The found data was transmitted to wavelet transform for feature selection for statistical analysis.
3.1. Major Steps Involved for Processing of EEG Signal to Estimate Workload during SIMKAP Task
Below steps are considered for processing EEG signal to estimate workload during SIMKAP task:
3.1.1. Extracting Data Based on Channels
The data are extracted from the dataset and information files found in IEEE data port according to the number of channels. This paper discussed single channel (O2) data for EEG data preprocessing during the SIMKAP process. For this data manipulation process, MATLAB version 2021 was used.
3.1.2. Data Processing for Corresponding to Its Label to Fit for Classification
The processed data was arranged for data corresponding to its label to fit for machine learning with the help of information provided in the rating file in IEEE Data port. A separate file called ratings.txt contains the ratings for each subject. Subject number, rating at rest, and rating for test were provided in comma separated value format. As an illustration, 1, 2, 8 would be subject 1, with a rating of 2 for “at rest”, and 8 for “test”. It was awarded that subjects 5, 24, and 42 did not have available ratings.
3.1.3. Wavelet Decomposition Technique
Wavelet decomposer was used to decompose the EEG signal into its five signals. These are (D5-D8, and A8) gamma, theta, delta, beta and alpha (respectively). After calculating individual power of each signal or level relative power in percentage of the signals are easily calculated.
The overall repeated procedure of the decomposition of EEG signals is been given in Figure 4.
3.1.4. Statistical Features Calculation and Dominant Features Selection from Decomposition Levels (D5-D8, and A8)
There are five decomposed signals or levels found in EEG signals. To find the statistical features from EEG signal wavelet decomposition technique was used to decompose the signal into five sub bands. These are delta, theta, alpha, beta, gamma and Figure 5 depicts the decomposed sample versus time signals. Fourteen statistical features viz. minimum, maximum, mean, mode, median, inter quartile range, standard deviation, variance, root mean square (rms), entropy, kurtosis, peak2rms, peak2peak, Root-sum-of-squares level were calculated for each sub band signal for O2 channel. In this process, 5 × 14 features widow size was found for each number of samples.
![]()
Figure 4. EEG signal sub-band decomposition using DWT.
![]()
Figure 5. Decomposed EEG signals for 60 × 2.5 seconds (2.5 minutes) (No. of sample VS time curve) duration low and high state.
Maximum relevance, minimum redundancy analysis (MRMR) model was used to select dominant features among 70 features. Selecting only five statistical features by this feature selection model provided (denoted by bar diagram) from 70 features (along features index) which results in the same classification accuracy with a wide neural network. The features selection model and confusion matrix found by applying MRMR are depicted by Figure 6 and Figure 7(b) respectively.
3.1.5. Classification
The most rapidly used classification technique is machine learning. We used various machine learning algorithms for classification purposes to classify low and high states that have been discussed in below.
Among all classifiers used in this study, neural networks algorithm helps us in second position to improve machine learning the results of classification performance parameters by combining several models. Neural networks, which are a subset of machine learning and the core of deep learning algorithms, which are also known as artificial neural networks (ANNs) or simulated neural networks (SNNs). In order to mirror the way that organic neurons communicate with one another, their name and structure are both derived from the human brain. Input, one or more hidden layers, and an output layer are the layers that make up a node layer in artificial neural networks (ANNs). There are connections between each node, or artificial neuron, and each one has a threshold and weight that go along with it [25] .
The Ensemble classification algorithm provided 2nd height classification accuracy and other performance parameters. Bagged, Random Forest is some types of Ensemble classification [26] .
![]()
Figure 6. First five features (6, 62, 63, 66, 64) selected by maximum relevance, minimum redundancy analysis (MRMR) model.
![]() (a)
(a) ![]() (b)
(b)
Figure 7. Confusion matrix found by Neural Network classifier, (a) without MRMR and (b) with MRMR.
A group of supervised learning techniques called support vector machines (SVMs) are employed in the identification of outliers, regression, and classification. Support vector machines have some benefits including high-dimensional spaces effectively. Even when there are more dimensions than samples, the method is still effective [27] . It is a revolutionary small-sample learning method that also outperforms existing methods in many ways since it is based on the structural risk reduction principle rather than the conventional empirical risk minimization concept. The optimal surface that resulted from the linearly separable instance is described in two dimensions by the support vector machine [28] .
The Support Vector Machine (SVM) algorithm employs quantum rules to carry out calculations in the Quantum Support Vector Machine (QSVM) quantum version. Classical SVM algorithms that run on traditional machines with CPUs or GPUs can perform better thanks to QSVM, which harnesses the power of quantum technology and software. The first significant stage in quantum machine learning is the conversion of classical data into quantum data using calculations on a quantum computer. The second key step is the conversion of the quantum result back into classical data using the same computer [29] .
4. Finding Attention Loss and Short-Term Memory Loss
To fulfill the demand of the study, after performing the classification process using a complete set of data with more features with machine learning it is needed to find the memory loss in the brain. The relative power of decomposed EEG sub band signals, as mentioned, Alpha, Beta and Theta signals, were investigated with respect to high and low EEG workload (High alpha and low beta power = high retention capacity) [30] . In this work, estimation of the short-term memory loss in the brain during high workload is introduced graphically by radar plot and area chart in excel after following some steps.
4.1. Major Steps Involved for Finding Attention Loss and Memory Loss in Brain
The following steps are involved for finding attention loss and short-term memory loss in brain during high workload:
Relative Power Calculation from Decomposition Levels (D5-D8, and A8)
Five decomposed signals or levels found applying wavelet decomposition technique of EEG signals are labeled by A8, D8, D7, D6 and D5 depicted by Figure 5. The power of each signal was calculated and finally the relative power of them was measured. Finding attention loss and memory loss (short term) in the brain has been discussed in upcoming section 5.
5. Numerical Analysis
The proposed EEG signal classification for low and high mental workload estimation during simultaneous capacity (SIMKAP) tasks is validated in this section. Discrete wavelet analysis for both cases (low and high mental workload) is presented graphically, and statistical parameters with classification results as well as performance parameters are extracted numerically. Finally, the attention loss and short-term memory loss in brain is predicted from the Radar plot and Area curve by using Excel.
5.1. Results and Discussions
In this section, the results from this work and its validation are discussed chronologically. The reliability of a procedure cannot be improved by acting based just on accuracy. Sensitivity, specificity, F1-score, negative projected value, and other metrics are also necessary to support a technique’s performance. In states of high workload, sensitivity identifies a positive EEG signal; in states of low workload, specificity recognizes a real EEG signal. By assessing accuracy, sensitivity, and specificity, precision, F1-score, and negative predicted value as specified below, the performances of the employed classifiers were calculated [31] . Several classification models with the proposed model is shown in Table 1 and comparative of performance of the proposed method with existing methods is also summarized in Table 2.
(5)
![]()
Table 1. High and low Workload Classification Result using different Classifiers algorithms.
![]()
Table 2. Performance comparison with existing methods.
(6)
(7)
(8)
(9)
(10)
The relative power levels of theta, alpha and beta signals during low and high workload are shown from Figure 8. The area plot shows the graphical representation of them. Radar plot of Figure 9 and Figure 10 show the graphical representation of the overall case according to the number of subjects. From these figures it is seen that, theta and alpha powers go higher from low to high workload. Literature showed that an increase in the alpha band is associated with a decrease in attention, and alertness [33] .
![]() (a)
(a) ![]() (b)
(b)
Figure 8. Area plot of sub bands signals.
![]()
Figure 9. Radar plot of sub bands signals during low workload.
![]()
Figure 10. Radar plot of sub bands signals during low workload.
Moreover, a higher power spectrum in theta band indicates a decrease in vigilance and alertness [33] . In this study, alpha and theta bands increase from low to high workload as depicted in Figure 8 resulting in subjects decreasing or losing their attention during SIMKAP tasks going from low to high workload level. After analysis of Figure 9 and Figure 10 it is concluded that, subjects 41 and 31 lost their attention going from low to high workload. Literature also showed that beta band is inversely associated with short term memory tasks [34] . As this study does not start with short term memory loss data, that is why beta power increases from low high workload condition resulting no short-term memory loss in this study.
5.1.1. Classification Results
In case of SIMKAP task during low and high (workload) Neural Network (Narrow) machine learning model was used to classify EEG data. The confusion matrix generated from the Neural Network (Narrow) algorithm is depicted in Figure 7(a) having training results with 86.7% accuracy (max.) with two labels (low and high). Figure 7(b) is depicted for the confusion matrix of the same classification algorithm using MRMR feature selection technique with 86.65% accuracy (max.). SVM, QSVM, Neural Network (Wide) and Ensemble Subspace models were also used to compare the performance parameters with the proposed model shown in Table 1. Performance comparison with existing methods of the proposed method is also shown in Table 2.
5.1.2. Performance Evaluation
For SIMKAP tasks, the classification results are presented in Table 2 with accuracy 86.7% including two labels tasks (low and high) resulting from comparative studies among various classifiers models. The comparative study with literature is shown in Table 2 which outperformed cutting-edge techniques described in the literature by 86.7%.
6. Conclusion and Future Work
6.1. Conclusion
The suggested method analyzes EEG data from the occipital (O2) region of the brain. The proposed classifier responded most favorably to the proposed approach with 86.7% accuracy (max.), 84.4% precision, 86.33% F1 score and 88.37% recall including two tasks (low and high workload). This method is more efficient and performs better than existing equivalent methods in terms of sensitivity, accuracy, precision and F1 Score. Moreover, a furnished and well decorated easy procedure is introduced to find out the short-term memory loss in the human brain with a large number of datasets by using only relative power considerations of the sub band signals. It is envisaged that this work will help further in short term memory loss analysis using EEG data.
6.2. Future Work
The analysis in this study can be used as a gateway for further research on human brain short term memory loss associated with mild cognitive impairment using a large data set.