1. Introduction
The background to this “research” is the recognition that developing nations strive to understand, let alone apply, green urban development in practice. As such, a fresh perspective needs to be offered to entice would be advocates to move to a green urban reality. The purpose of the paper is therefore to guide those, who both influence national policy and strive to achieve in practice, to give meaning to the ambition. Its significance is that it relates a committed international institution’s green development paradigm, through a national government’s policy perspective, down to the urban reality at city government level. This means the need to understand the implications of infrastructure and superstructure in the green development narrative.
2. Policy Impact
Concept
The GGGI greening paradigm is in two parts. First is the concept. It has been developed and conveyed generally through the following illustration, Figure 1.
Its headline interventions border on common sense:
· Efficient and sustainable resource use.
· Green economic opportunities.
· Social inclusion.
· Natural capital protection.
Its overarching goals are (a) a low carbon economy and (b) a resilient society. Its contents are self-explanatory to the point of basic good manners in how we treat our environment. We should not abuse Mother Nature. The question is, how does a national government move and measure in the green urban development direction?
Measurement
Uganda’s second national development plan was based on sectors. It therefore
![]() Source: GGGI HQ Seoul, Korea.
Source: GGGI HQ Seoul, Korea.
Figure 1. The green development paradigm.
suffered many national governments’ dilemma of being trapped in technical silos. That is to say, each ministry pursued its own technical specialist concerns. Water pursued water. Environment pursued environment. The third national development plan (NDPIII) took the significant step of moving to an explicit programme-based analysis. Ministries, departments and agencies (MDAs) were therefore compelled to identify their expenditure for outputs to the applicable NDPIII programmes. Thus, ministries now contribute to applicable inter-agency programmes. A first illustration is in Table 1.
Table 1 illustrates the range of MDAs that implement the applicable programme, sub-programme and its objective through the various activities. Again, this has overcome NDPII’s silo or stricter sectoral approach. The next step is the tracking of implementation. This is through each programme implementation action plan (PIAP).
The PIAP for sustainable urbanization and housing, for the period FY 2020/21 - 2024/25 has three sub-programmes: 101 Physical Planning and Urbanization, 102 Housing, and 103 Institutional coordination. What is important here is that objective 1013 is to “Promote green and inclusive cities…” There are seven generic “green” interventions, as follows:
![]()
Table 1. Programme and sub-programme extract, various MDA contributions.
Source: Government of Uganda, NDPIII.
101301 Conserve and restore urban natural resource assets…
101302 Undertake waste to wealth initiatives…
101303 Develop green buildings…
101304 Promote non-motorized transit…
101305 Increase urban resilience…
101306 Develop and protect green belts.
101307 Establish and develop public open spaces.
Each intervention has a series of actions (Table 2).
On the face of it, Uganda’s green urbanization is well catered for at the policy level, down to resulting actions. The next step is to see if GGGI reflects government’s green urban ambitions in practice.
3. Practical Impact
Figure 1 presents the GGGI green development paradigm. It must be enriched by a process to start giving practical meaning to the concept. In short, where is the dynamic characteristic to the paradigm?
Process
Both goals in the paradigm require a planning process that supports green urban development. It has six items developed by GGGI HQ.
1) Land-use: good planning with clear commitments to sustainability can result in more inclusive, resilient and prosperous urban communities and industrial locations. It concerns the efficient deployment of available land through two sieve analyses; environmental and infrastructural. Both have a direct impact on green development. This is expanded upon in Part 4, concerning infrastructure.
2) Buildings: well-designed buildings that follow green building codes make efficient use of water and energy, reduce GHG emissions and improve indoor air quality—providing overall health benefits. This is expanded upon in Part 5, concerning superstructure.
3) Transport: low-carbon public transportation such as walking, cycling and e-mobility can significantly improve air quality and improves access to infrastructure and services. The most pertinent concept is to relate land-use planning to transportation planning directly. All urban land use generates the movement of people.
4) Energy: enhanced access to renewable energy can reduce GHG emissions and generate new green employment and business opportunities.
5) Water: improved access to potable water and sanitation services reduces public health risks, supports local economic opportunities and avoids ecosystem pollution.
6) Sanitation/waste: effective waste management helps reduce health risks, GHG emissions, creates employment, supports SME development and urban circular economies.
![]()
Table 2. Green urban PIAP (extracts).
Source: Government of Uganda, NDPIII, PIAP for urban development, extracted.
These items introduce a thinking process. What is needed is to understand the resulting impact. Green urban impact, as a measurement framework, was developed by GGGI Uganda as part of its EU funded greening urbanization and industrialization project. The original six urban planning steps were extended to include more contemporary concerns such as connectivity and mobile phones. Indicators, development targets and lastly, green and public health impact items, were included. The important point is that this is taken to a practical level through the EU project.
In other words, the notion of green urban impact gives a sense of what is being aspired to Table 3.
The question is “how do we achieve it”? It is the first test of resilience—to get the responsible city government to be responsive to its urban development challenges. It triggers the idea of institutional resilience.
Responsive
While the conventional approach to urban resilience centres on the physical environment and infrastructure specifically, it is the oft neglected institutional dimension that carries critical importance. One model to achieve that is through an annual planning and review cycle, layered to a three-year programme, within a five-year development framework. It is a responsive mechanism. Figure 2 illustrates.
The five-year cycle starts with a development strategy, moves to a three-year programme-based financial strategy, down to the annual deliverables and supporting budget. The review cycle reverses this logic. It begins by testing the economy of inputs and moves to the immediate effectiveness of outputs on client groups and specific locations. Finally, is the impact on socio-economic variables. While Figure 2 recognizes the applicable SDGs, it remains an internal decision cycle but with the best of participatory intentions.
It is the smart city concept that enriches the notion of responsiveness. It gives additional bite to the idea of urban resilience. Most importantly perhaps, it offers immediacy to direct responsiveness from the recipients of the failing services provided by or on behalf of the city government!
The point here is that green urban development is completely unambiguous. The process to achieve it is outlined. However, an additional dimension is required to give green urban intelligence, life. This is through the concept of smart cities.
4. Smart Cities
First, the word “smart” used to be the acronym, SMART; with its precise meaning
in the technical problem-solving approach to planning. Here, SMART means that each objective should be: Specific, Measurable, Achievable, Relevant, and Time-bound. In order to clarify and indeed, to distinguish matters, this is not the meaning of smart in relation to cities. Secondly therefore, what is?
Concept
The Smart city concept integrates information and communication technology (ICT), and various physical devices connected to optimize the efficiency of
Source: GGGI Kampala, Uganda.
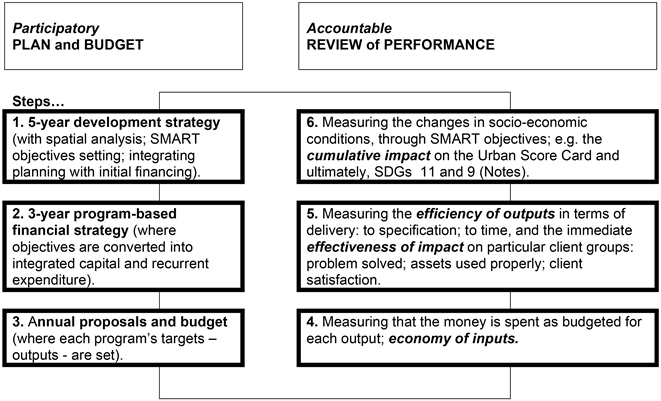
Source: McGill (2018) . Notes: In Uganda’s secondary cities’ setting, the urban score card (USC) has direct application on green development—expanded in the next section. SDG Goal 11. Make cities and human settlements inclusive, safe, resilient and sustainable. Goal 9. Build resilient infrastructure, promote inclusive and sustainable industrialization and foster innovation.
Figure 2. Planning-review cycle—a performance framework.
city operations and services and connect to citizens. Smart city technology allows city officials to interact directly with both community and city infrastructure and to monitor what is happening in the city and how the city is evolving… Smart city applications are developed to manage urban flows and allow for real-time responses.
In 2016, the UN Commission on Science and Technology for Development, presented a report at its nineteenth session in Geneva ( UN, 2016 ). Its purpose included providing “an explanation of the term smart city and described the main components of smart infrastructure”.
The paper defined smart infrastructure under the following topics, smart: buildings, mobility, energy, water, waste management and health (paras. 9 to 14). It then introduced smart digital layers (para. 15). The UN paper then stressed “the need for an integrated approach”.
For any smart city or even a more modest town, one critical point is the integration of smart data for a holistic understanding of the urban challenge. This is very important in relation to the collective institutional response to the multi-faceted urban system. Simply stated: the complexity of the city is not matched by the national government departmental or silo rigidity. The structure of government is not commensurate with the structure of the city.
Arroub et al. (2016) reviewed 41 sources in their quest to understand a smart city. They suggested a three interconnected system approach to its understanding (p. 1):
· Sustainability; by improving the city/environment relationship and using green economy.
· Smartness; context aware economy and governance.
· Inclusiveness; by fostering a high-employment, economy delivering social and territorial cohesion.
All three are already useful tests at the strategic level—and note the unprompted reference to the “green economy”. A city cannot be blind to its physical environment and the impact of environmental degradation. A city’s economy must be known but its governance is a dimension not always considered. Social and territorial cohesion offers the notion of spatial intelligence. Ideally, what is needed is more text on how to turn the idea of a smart city (as a holistic concept) into action that practitioners (local politicians, town planners and community representatives) can understand.
Application
China presents its own definition of a smart city: “a new idea and new mode of promoting smart city planning, construction, management and service, using the Internet of Things (IoT), cloud computing, big data, and spatial geographic information integration, etc.” The critical phrase here is “spatial geographic information integration” ( Ly et al., 2015: 291-294 ). The paper goes on to state, “where the technology is seen as the central importance, ‘smart city’ can be divided into four layers, that is, sensor layer, network layer, platform layer and application layer (its Figure 2). The combinations of sensing, network and information processing platforms enable objects to interact with the each other”. These layers are repeated in Table 4.
The range of smart technology might be considered bewildering. In order to overcome such, the first test of relevance—that is to say, practicability—is to relate the focus of the technology to specific services.
![]()
Table 4. Applications within the four layers of information flow.
Source: Ly et al., 2015 , Figure 2.
McKinsey (2018) published a 152-page report on smart cities. Unlike Table 4’s focus on the layers of smart city ICT, that report takes matters to a more practical level. It suggests, “We also find that using the current generation of smart city applications effectively could help cities make significant or moderate progress toward meeting 70 percent of the Sustainable Development Goals” (p. 4); for this paper, SDG 11.
The report goes on to define the smart applications through ICT. As its Exhibit E2 states, “Our research looked at dozens of smart applications that will be relevant for cities through 2025” (p. 25). The applications concern: Security; Health care; Mobility; Energy; Water; Waste; Economic development and housing; Engagement and Community; see Table 5.
Table 5 illustrates smart city applications. The next step is to relate it to the urban score card (USC), currently deployed in the EU Uganda project. The smart application is ICT dominated. USC is infrastructure dominated.
An explicit connection between the smart city idea (as part of the responsive, indeed resilient, urban system) and USC is made. That link must be taken further. USC is primarily concerned with the shaping of urban form in an environmentally
![]()
Table 5. Smart applications that will be relevant for cities through 2025.
Source: McKinsey (2018) E2.
sensitive and infrastructurally efficient way. First however is its impact on poverty alleviation.
5. Infrastructure Provision
Poverty
There are two basic models of poverty: “lack of income” and “access to services”. The first is obvious. The second moves to the concept of multiple deprivation. It can be defined spatially, through the recognition of where the services do and do not exist. The urban score card (USC) allows such analysis to proceed at a city or town level.
USC is at the very first level of thinking about what any Ugandan town should expect as its urban form is being shaped. Here, sectoral norms such as education and health are seen as the province of specialists in those services. Also, they do not shape the primary spatial pattern of a town. Other things do: water, sanitation, housing, electricity, roads, and safety. USC should therefore be seen in two lights: people’s access to the basics expected in a town and the provision of this infrastructure. These are the initial “urban results”:
1) Having access to clean water.
2) Having a functional sewage and garbage disposal system.
3) Having a home that is weather-proof and secure in tenure.
4) Having constant electricity supplies.
5) Being able to travel in all weather; and
6) Feeling safe, day and night.
The poverty perspective, through multiple deprivation, requires that no one should be deprived of such services. The argument is that even getting to this first level of urban results is going to take low to middle-income countries, many years.
Presented in a different way, USC is simply an “urban profile”, emphasizing primary infrastructure; that which binds the resulting superstructure (buildings) together. The positive targets (T = 100%) are development aspirations for any modernizing country. Any negative target (T = 0%) concerns, for example, reducing informal locations to zero. The resulting objectives (where now, X% and where we want to be in five years, Y%) define the programme of deliverables in each case.
USC is the key to rational and spatially reinforcing trunk or arterial infrastructure planning and budgeting. If the process is highlighted in Figure 2 and its urban intelligence is in Table 5, USC moves on to its spatially reinforcing and green urban development consequences. Table 6 presents extracts from USC.
![]()
Table 6. Urban score card (extracts)
Source: McGill (2018) . aIncludes education and health.
Spatial
Taking the first planning process (Table 1), it remains to explain how environment and infrastructure syntheses help to influence resulting spatial form. In both cases, we heed environmental sensitivity and the efficient provision of trunk infrastructure. The process is governed through sieve analyses.
Environmental conditions should be plotted on a map to show the areas to be “taken care of” and those areas that are “more suitable for development”. We want to define the environmental areas to be nurtured and protected; to build-up the picture of locations that are “sound” as opposed to others which are “unsound” for development. The theory is that by defining what should be husbanded, we define where change might occur, with the least damage and the maximum benefit. In short:
1) We need to understand areas of sensitivity that need to be cherished and nurtured.
2) We need to understand other areas that are under threat and need remedial action.
3) In so doing, we start to identify where the best locations are for new development, which are not harmful to the environment.
The conclusion at this point is to set the environmental analysis against the existing land use map so that we get the result of the first sieve analysis; from an environmental perspective, where best to locate future development.
The second sieve is for tracking trunk infrastructure patterns. Two things are needed.
1) Identifying suitable land served by existing, water, sanitation, roads, electricity (where capacity still exists).
2) Identifying suitable land where it is easiest to provide new infrastructure and supporting services (where new significant capital investment is needed).
Network infrastructure is the collective system that binds a town together. It forms the arteries (that bind the land uses) to make the town work. Such infrastructure usually includes:
· Water supply.
· Sewerage systems.
· Solid waste management.
· Flood control and general drainage.
· Power supply.
· Trunk roads.
· Other major (non-site-specific development) roads.
All network infrastructure should be recorded as accurately as possible, on a topographical map. The water supply system should be plotted. Its capacity (or threshold), condition and level of use should be known. Where a sewerage system exists, it should be plotted, with the same supporting information. Solid waste management patterns and routes should be recorded. Flood control and strategic drainage patterns should be drawn. All utilities have to be known. Their capacity must also be indicated. Trunk roads, including their rate of use (say, movements per hour in relation to an optimum figure) should be offered. Any accompanying drainage and street lighting should be recorded. The same information will apply to all other (non-site development specific) roads.
The ideal outcome of both sieves is locations for future development that are environmentally sensitive and infrastructurally efficient. These alone are major contributions to green urban development. The last stage concerns superstructure, the buildings themselves. How are they assessed towards certification? What is their impact on climate change.
6. Superstructure—Green Buildings
There are various definitions of a green building. The World Green Building Council (2022) defines such as one “in whose design, construction or operation, reduces or eliminates negative impacts, and can create positive impacts on our climate and natural environment. The World Bank refers to a green building as one that uses 20 percent less energy, water and embodied energy in materials compared to an equivalent local benchmark” ( EDGE, n.d. ). Both definitions underscore the importance of reducing the use of resources such as energy, water and materials, in order to lessen the environmental impact of a building and its related activities.
Certification
EDGE (n.d.) is a green building rating system, with a practical dimension. It empowers emerging markets to scale up resource-efficient buildings. Thus, it enables developers and builders to quickly identify the most cost-effective strategies to reduce energy use, water use and embodied energy in materials. There is a resulting certification for the buildings that reach that green, externally verified, status.
The green building community is recognising the importance of integrating sustainability with resilience. For instance, green building rating systems, such as BREEAM and LEED, have incorporated resilient measures, even though it is on a limited scale Al-Saeed et al. (2014) .
In 2015, the United States Green Building Council (USGBC) developed a LEED Climate Resilience Screening Tool to assess each LEED v4 credit’s resilience potential ( LEED, n.d. ). It was found that LEED v4 was still insufficient in addressing all resilient measures in its credits ( Champagne et al., 2016 ).
USGBC then developed LEED Resilient Design pilot credits to be incorporated into LEED v4 and LEED v4.1 for new construction projects ( US, 2022 ). The credits include:
· Assessment and planning for resilience,—1 point Assessment (2022)
· Designing for enhanced resilience—2 points—Design (n.d.)
· Passive survivability, and back-up power during disruption—2 points—Passive (2022).
Despite these efforts, there was a need to give a more holistic approach to the resilient design of buildings and communities by emphasising the planning for acute hazards. Therefore, the Institute for Market Transformation to Sustainability (MTS) and its Capital Markets Partnership developed an independent resilience rating system called RELi (n.d.) . It defines a resilient design as one that “pursues buildings and communities that are shock-resistant, adaptable and regenerative through a combination of diversity, foresight and the capacity for self-organisation and learning”.
Regarding resilient buildings, RELi takes some reference from LEED. This illustrates the synonymous nature of green and resilient buildings. Thus, while resilience explores how buildings can withstand calamities like climatic disasters, sustainability seeks to minimize or even eradicate the environmental impact of buildings. Green buildings seek to address climate change through innovative designs, technologies and methods. Beyond this, they also tackle the devastating effects of natural disasters. This makes green buildings an integral part in building a resilient community.
Climate
The link between green buildings and climate change comes down to energy reduction and environmental impact. Buildings use energy for construction and operation resulting in significant emissions of greenhouse gases. Globally, the building and construction sector contributes the largest share of CO2 related emissions (39%) and energy use (36%). In Africa alone, buildings and building related activities account for 32 percent of CO2 emissions ( Global Alliance, 2022 ). Yet the building stock in the continent is set to double by 2050 while the global material use will more than double by 2060. A third of this rise is through increasing demand for construction building materials, to meet the needs of the growing urban population.
Increasing concentrations of CO2 trap more heat in the atmosphere leading to global warming and climate change. In addition, climate change alters the precipitation patterns of the planet, leading to drought, famine and floods, that undo decades of development. This justifies the need to set the building and construction sector as a primary target for CO2 reduction.
Green buildings are a powerful approach, that once employed, can cut down the carbon emissions by half, if we are to reach net zero emissions by 2050 (Global Alliance). BREEAM on average saves 22 percent of CO2 emissions, and EDGE achieves a minimum 20 percent savings in energy, water and embodied energy in materials. Furthermore, the financial implications associated with decarbonising the building sector are the lowest, compared to other sectors, as indicated in Figure 3 ( Mackres, 2016 ).
With such compelling statistics, one wonders where the impediments to progress are? The answer is simple.
There is a general lack of understanding of the concept of green buildings and the benefits they generate for building users, owners and the environment at large. This knowledge gap starts from the policy makers who play a crucial role
![]() Source: World Resources Institute.
Source: World Resources Institute.
Figure 3. Emission reductions by sector.
in steering a country’s ambitions that guide development. This is coupled with the lack of technical capacity by the professionals to deliver sustainable building designs and high-performance buildings. This technical capacity gap stems from the educational curricula that do not feature sustainability concepts.
In most developing countries, stakeholders in the building and construction industry are hesitant to take on concepts and materials that are not in the mainstream. They find innovative technology as risky and at high cost, without a guaranteed return on investment. For these reasons, the adoption rate of green buildings is slow on the African continent.
It is true that sustainable buildings often require high capital costs. This deters some developers from investing in them. The high cost of constructing a green building can be due to overestimation of the energy saving strategies, underestimating of cost saving methods and the high consultation fees. In contrast, incorporating green building concepts from the concept stage makes them easy and low cost to implement during construction. Thus, a well-designed and planned green building usually offsets the initial investment in less than five years through utility savings.
Another benefit: green buildings have reported higher occupancy and rental rates ( Miller et al., 2008 ). Moreover, buildings constructed with a comfortable indoor environment, including natural daylighting, reduced noise and good ventilation, have proved to attract a rental premium of up to 20 percent ( Clifford, 2018 ). This presents a good business case for investors and developers.
The adoption of green buildings is often hindered by the regulatory framework. It does not provide for the use of sustainable innovative technology. In some cases, the existing legislation concerning the greening of the built environment is weak and too often, is not being enforced. As the biggest contractor of large-scale buildings and infrastructure, African governments need to procure green buildings in order to set the trend for other stakeholders in the industry. This is why the current EU funded greening urbanisation project is not only supporting the preparation of green physical development (land-use) plans but also, securing amendments to the building codes to support the green urban imperative.
While the technical challenge of urban development, through green buildings, is clear, it is the institutional response that becomes the critical dependent variable. This means the penetration and application of knowledge, from ministries, departments and agencies to city and municipal governments. Then, private developers, contractors and their professional advisers—town planners, architects, engineers, surveyors—need to embrace the green ambition and turn it to practice.
7. Conclusion
This paper has been presented in five sections, beyond its introduction and conclusion. Firstly was the green policy impact with an urban bias. Secondly was the green practical impact, explicitly urban, from a responsive institutional perspective. Thirdly, the responsive description was taken to the smart city idea of service delivery intelligence. Fourthly was infrastructure, specifically its shaping or reinforcing urban form, with an initial poverty aspect. Finally was superstructure—in this case, green buildings. Each section has been offered as a step towards a greater appreciation and potential application of green urban development.
The political economy of this argument is the engagement of the policy dimension in practice. Each of the five sections closes with a statement, to show the next step in achieving green urban development. However, requirements of the political economy concerning this challenge mean a fundamental change in the mind-set of individuals at industrial, commercial and household levels. Industrial and commercial land-uses consume energy and discharge waste, most commonly, without a care for its environmental and cumulative climatic impact. The heads of such enterprises must take responsibility and display leadership in how their enterprises perform.
The biggest land-use in all cities is housing. In Uganda’s case, approximately 60 percent is unplanned, informal and with very limited, if any official services provided. Is it any wonder that streams that manage to flow through such locations are often blocked with debris and household waste. Whereas heads of enterprises can be chastised, so can every head of household that permits waste to be dumped rather than be sorted and collected.
If all such mindsets could be transformed, the remaining (and welcomed) burden would be on city governments and their fundamental responsibilities for urban management. Whereas urban planning is mediating the spaces and creating the places for development, urban management should be making our towns and cities work. This means ensuring the environmentally sensitive and efficient provision of infrastructure (from whatever external funder) and encouraging the decent delivery of the resulting services: water, sanitation, power and so on.
In closing, this has been action-research over the past three years. It has sought to highlight some general principles to govern green urban development. As such, it has attempted to relate a specialist institution’s green credentials (GGGI1) with unfolding practice in Uganda. That practice concerns the provision of infrastructure and the development of superstructure, both enriched by a possible smart city perspective. A shortcoming is the lack of empirical evidence to allow a causal connection to be established between green infrastructure-superstructure on the one hand and the information and communication technology (ICT) critical to smart cities.
If future research was possible, one would seek to explore modest but successful applications of smart city ICT in practice. Given that Uganda’s secondary cities are growing more rapidly than its capital, Kampala, one hears the demand from these smaller places’ residents to avoid all the errors that currently pervade the capital. Journeys to work seem endless, traffic can be horrendous. Utilities such as water and power are not continuous in supply. Housing is dominated by individual plot development. This compounds two facts. At least 60 percent of urban dwellers are in informal locations. Under 30 percent of all construction is approved officially through the development planning and building control systems. Smart city ICT, if applied correctly, could have a significant impact on traffic management, utilities provision and even housing. Here, any authorized construction generates a geo-reference; a key to real property taxation. This would help to address the perennial lack of financial capacity in city governments. In short, there is so much more to research!
Acknowledgements
My colleagues in GGGI Uganda have enriched my own understanding and resulting narrative on this subject. However, I single out Regina Mwenyango (who triggered my earlier thoughts on smart cities) and Hilda Nankya (who produced some telling work on green buildings, what they mean and how to achieve them).
NOTES
1https://gggi.org/about/.