Factor Analysis on E-Learning Implementation in Mongolian Higher Education ()
1. Introduction
The Parliament of Mongolia ratified the state policy on education that aims to enable every citizen with lifelong learning opportunities (The Parliament of Mongolia, 2015) . The higher education reform roadmap from 2010 to 2021 aims to expand distance and e-learning programs and increase citizens’ access to higher education through new means. The guideline of postgraduate studies conducted and approved by the Ministerial Order A/370 of 2014 states that HEI can apply ICT and online open sources to face-to-face learning. Ph.D. committee members can vote electronically (Ministry of Education, Culture and Science, 2014) .
E-learning is claimed to be practiced by many lecturers and HEIs in Mongolia. However, there is no research or information about e-learning courses and factors that influence their development. Earlier authors published survey results covering 58 academics and researchers from 5 HEIs (Tuul, 2019) .
Babson Survey Research Group periodically measures online education in the United States and presents the trend (Seaman, Allen, & Seaman, 2018) . The Canadian survey revealed that student and instructor experience should be focused and there is a lack of internal accountability for tracking online learning (Bates, 2018) . The Chinese researchers concluded that a “production-utilization-research” model for information technology products is needed to optimize e-learning resource construction (Wang, 2018) . In Russian Federation, the Ural state university investigated the three models such as web-facilitated model, blended learning with the online examination, and online format with tutor support model were investigated among 800 bachelor program students and concluded that online education does not reduce the learning outcomes or grades (Larionova, Brown, Bystrova, & Sinitsyn, 2018) .
The article comprises methodology, results, and conclusion sections. The results of cluster analysis and regression analysis are presented.
This study is significant because there are no national statistics or research report about current practices of e-learning in Mongolia. Three years later, we surveyed to observe the update and assess the changes. The research questions are:
1) What types of e-learning courses are practiced in Mongolian higher education?
2) What factors influence e-learning course development?
2. Methodology
Hereby, we refer to e-learning as a general term that incorporates all forms of learning occurring via the internet. Web-facilitated learning occurs when course outline, lecture notes, seminars, discussions, assignment, and assessment are online, but without significantly reducing classroom time. Blended learning is a combined form of online and classroom settings. The course outline, lecture notes, seminars, discussions, assignments, and assessments are online, which partially replaces face-to-face learning. It occurs when students participate in online activities, but certain physical attendance and face-to-face interaction are still practiced. Online learning occurs when all educational activities are practiced fully online. To quantify the measurement, we used Allen and Seaman’s methodology. Web-facilitated learning if online content is 1% - 29%, blended learning if online content is 30% - 79%, and fully online course if online content is over 80% (Allen & Seaman, 2014) . The e-learning course is a 1 - 4 credit hour course made up of educational programs that are delivered to the student through the Internet, which continues for 16 weeks. Article 4.1 of the Higher Education Law of Mongolia states that Higher Education Institution (HEI) is a general term for universities, colleges, and institutes (The Parliament of Mongolia, 2018) .
The survey is presented in Appendix 1. The authors improved the survey questionnaire, which was used in 2015. The significant change is that we used a sum of 2 instead of 5 variables. In 2015, we used 5 variables such as lectures, seminar or laboratory work, self-assessment quizzes, mid-term exams and assignments, course books, and supporting printed materials to classify the e-learning type. In 2018, we used 2 variables such as lectures and seminar to avoid diversion.
The survey is composed of 2 parts with 26 questions: 12 questions on demographics, and 14 questions on the e-learning course. We asked a volunteer to complete a pilot survey, and some questions were revised as a follow-up. Authors disseminated paper copies and emailed online surveys via Google forms from November 25, 2017 to February 20, 2018. The phone books and emailing lists of the HEI’s were used.
The k-means approach measures and groups items by minimizing the square of the Euclidean distance. Factor analysis is used to model the interrelationships among items. It reduces a large number of variables into fewer numbers of factors (Hill & Lewicki, 2006) .
3. Results
There were 6924 lecturers in 96 HEIs in the academic year 2017-2018 (Ministry of Education, Culture and Science, 2017) . We calculated that 364 lecturers would represent 6924 lecturers with a 95 percent confidence interval using Student distribution:
.
The sample represents the population as 726 lecturers participated in the survey. The sample size is calculated based on reliability and validity criteria for statistical inference.
The biggest age group is 30 - 44, representing 53% of the respondents. The smallest age group is 20 - 24, constituting 3%. 61% of the respondents are women.
As of the ownership, 18.7% are public institutions, 78.1% are private institutions, and 3.2% are affiliates of foreign universities. 85% of the HEIs are located in urban area and 15% are located in rural areas. 75% are colleges and institutes, whereas 25% are universities. 85% of respondents reside in urban areas, and 15% live in rural areas.
Most respondents work in engineering and technology, and this trend remained stable for both surveys. The number of e-learning courses in medicine, life sciences, and humanities increased, whereas natural sciences decreased (Table 1).
We aimed to determine the factors influencing the tendency to develop an e-learning course. The training is not compulsory for the lecturers. 56.6% of the respondents said they were enrolled in the training for e-learning course development, whereas 43.4% were not. We used the Chi-square test to check if the enrollment to the e-learning course development training varies according to the location and ownership. The non-enrollment in training was 59.6% in the urban areas, whereas in the rural areas, it was 42.5% (Figure 1). The trend is consistent for public and private HEIs and the training enrollment is low.
In 2015, every fourth respondent did not participate in the training to develop an e-learning course. In 2018, every second lecturer did not participate in the training to develop the e-learning course. This indicates that there is an immense necessity for faculty development. 30.4% of the respondents were enrolled in the training from 1 to 5 days, 8.9% were enrolled in the training from 6 to 30 days and 4.1% were enrolled for more than 2 months. The training is organized in relatively short terms. Table 2 presents a comparison of the training duration.
The funding source of the training varies according to the duration. 40% of respondents self-funded the training, which continued from 2 to 4 months. 25% of the respondents said that training continued for 4 - 12 months, and foreign projects or programs funded it. The universities and colleges are funding the training for their academics without considering training duration (Table 2). The Chi-square test revealed that those universities and colleges that have LMS have a higher tendency to enroll their academics in training.
![]()
Table 1. Comparison of the fields of science.
Source: Authors’ comparison.
![]() (a)
(a) ![]() (b)
(b)
Figure 1. Participation of the lecturers in the training (according to the location and ownership of the institutions). Note: The Chi-square test was used to test if there was a correlation between variables: 1) The lecturers’ participation in the training is correlated with the location of the institution at the 1% of statistical significance; 2) The lecturers’ participation in the training is correlated with the ownership of the institution at the 1% of statistical significance. Source: Authors’ calculation.
![]()
Table 2. Comparison of the e-learning training course duration undertaken by the lecturers.
Source: Authors’ calculations.
307 lecturers were enrolled in the training to develop e-learning courses, and similarly, 311 lecturers developed e-learning courses. If the lecturer was enrolled in the training to develop e-learning courses, the possibility of developinge-learning courses is 59.6%. Conversely, the possibility of developinge-learning courses is 31.4%.
Lecturers named the course components they developed: lecture 45.3%, test 22.6%, seminar 18.1%, additional material 8.1%, forum/discussion board 4.0%, other 2.0%. To sum up, the e-learning courses are developed to direct knowledge building which is similar to the results of the 2015 survey.
Table 3 shows a breakdown of the time devoted to developing components of the e-learning course. Time devoted to the e-learning course development does not vary component-wise, but they spend 4 - 12 months in most cases. The mean time for the e-learning course development is 5 - 6 months, the median is four months. In 2015, the median time for the e-learning course development was five months. The e-learning course development time is decreased by one month.
![]()
Table 3. Time devoted to developing components of the e-learning course.
Source: Authors’ calculations.
Table 4 presents the application of the learning theories in the e-learning course development. If the lecturer was enrolled in the e-learning course development training, the application of learning theories would rise. Every third lecturer does not apply learning theories in the e-learning course development. This trend remained stable for both surveys. In 2015, 37.21% of the total respondents who said do know or did not apply learning theories. In 2018, 34.6% of the total respondents said that they do not know. This indicates the strong need for faculty development.
The lecturers consider e-learning suitable for master’s and bachelor’s professional courses. The e-learning course development is a time-consuming activity. 43.8% of lecturers worked in teams, and 56.2% worked individually to develop an e-learning course. The teamwork is not dependent on the lecturers’ age, gender, and e-learning course development training.
Most lecturers developed the e-learning course based on the management’s request. 43.92% of the respondents received monetary and non-monetary compensation, 39.74%received no compensation as it was their duty, and 16.99% said do not know. The response does not vary based on the lecturer’s demographics or institutional ownership.
The challenges in the e-learning course development were grouped into 7 areas, as presented in Appendix 2 ( Table A1). Figure 2 provides a summary of challenges reported by lecturers.
72.65% of the respondents raised environment and faculty development issues. Technology and environmental obstacles are lack of equipment, software, low network speed and weak coverage, lack of recording facilities, technical faults, absence of licensed software, antivirus software, and weak information security. The faculty development issues are problems related to methodology, experience, understanding, standards, information technology knowledge, mentor, instructional designer, and English. 5% of the lecturers indicated that they do not have time. 8% of the respondents reported about the students’ related problems such as students are not ready to use e-learning, lack of trust, learner’s inappropriate ethics (if the particular student has completed the test or
![]()
Table 4. Application of the learning theories in the e-learning course development.
Source: Authors’ calculations.
![]()
Figure 2. The challenges in the e-learning course development in 2018 survey, percentage. Source: Authors’ calculations.
assignment), lack of student’s motivation and too small or too big classes. 9% of problems related to policy and support. The policy difficulties are declarative policy, weak planning, inconsistent implementation, weak coordination of intellectual property, and a weak legal environment. The support-related issues are lack of financial and other incentives. Around 10% of the respondents highlighted that e-learning is unsuitable for their courses. The University of the Culture and Arts courses requires face-to-face interaction.
Some challenges coincide with the study results, which covered 10 Dutch Higher Education Institutions. The barriers were uncertainty about the value for them to share openly, uncertainty about quality, copyright violations, lack of time, support, and awareness of opportunities for openness (Janssen & Schuwer, 2018) . The challenges were similar to the other developing countries, such as lack of environment, technology, and faculty development; developed countries face challenges related to the individual characteristics of the student and lecturers (Andersson & Grönlund, 2009) .
3.1. Cluster Analysis Results
We classified the sample size into three clusters based on the sum of the two variables such as the proportion of the e-lectures in the total lectures and proportion of the e-seminars in the total seminars. We have chosen two main variables contributing to the e-learning course to avoid diversion based on the lessons learned from the previous survey. This analysis reveals group characteristics and relations between the variables.
The 13 HEIs out of 15 HEIs practice e-learning. However, this survey mainly covers only those lecturers who developed an e-learning course. If we considered it in the sample, the percentage of the lectures and seminars would drop from 71.62% to 25.9%. As it is shown in Table 5, the total weight of the e-learning courses would not exceed 30%, which means that e-learning course development and application are low at the national level.
According to Allen and Seaman’s threshold values, MNUMS, NUM, Mongolian National University, Mongolian University of Life Sciences, New Civilization Institute, Institute of Economics and Finance, and UFE are implementing blended learning, whereas the rest of the Higher Education institutions implement the web-facilitated learning. As shown in Table 4, the UFE sample does not represent the population. The selection bias occurred as only those lecturers who developed e-learning courses participated in the survey. Therefore, we decided to drop 5 UFE respondents from the initial list of 726, and the sample contains 721 respondents. We conducted the cluster analysis for the 721 respondents classifying the total sample into three groups using lecture and seminar time.
If the lecturer did not develop or teach the e-learning course, it was given 0 value. It means that the lecturer taught 0 hours. The variable used for the classification is the mean of the sum of the e-lectures and e-seminars ((percentage of the e-lectures + percentage of the e-seminars)/2). As it is shown in Table 6, the mean of the cluster varies in each cluster. For example, theme was 0.7% in Cluster 1, 60.4% in Cluster 2, and 98.2% in Cluster 3. The minimum and maximum of the clusters are compliant with the threshold values.
Proportion-wise, 67% are web-facilitated courses, 18.9% are blended courses, and 13.03% are online courses. In 2015, we found that 22.4% of the courses were web-facilitated courses, 74.1% were blended courses, and only 3.4% met the requirement of online courses. Web-facilitated courses are mostly practiced, with few online and blended courses.
After data cleaning, we evaluated 698 observations (Graph 1) of how these variables influence the tendency to develop an e-learning course. Afterward, we analyzed 12 factors influencing cluster classification (Graph 1). Out of 12 factors, only LMS had an eigenvalue above 1, regarded as the cutoff point.
Graph 2 shows that only LMS is the main variable that influences the cluster classification. LMS makes a difference to the e-Learning course development as it combines pieces of content into the time-framed course. Therefore, we tried to
![]()
Table 5. The weight of the e-lectures and e-seminars by higher education institutions.
Source: Authors’ calculations.
![]()
Table 6. Classification of the e-learning courses (percentage of the e-lecture in the total lectures, the percentage of the e-seminars in the total seminars, cluster-wise).
Source: Authors’ calculations.
![]()
Graph 1. The explanation of the variables that influence the cluster classification. Source: Authors’ calculations.
![]()
Graph 2. The relationship between the factors and variables. Source: Authors’ calculations.
determine how the lecturers’ characteristics, diversity of the universities and colleges influence the e-learning course development.
3.2. Results of the Regression Analysis
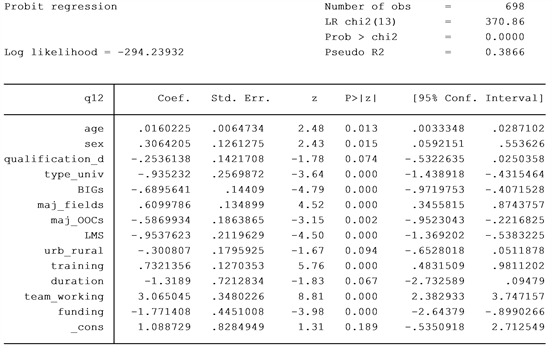
Using logit which is used for nonlinear regression analysis, we used a 721 sample to determine the major factors that influence the probability of developing an organized de-learning course (UFE data was dropped due to the selection bias).
We have chosen the dependent variable as (Yi) as a response to the “Have you developed and organized de-learning courses?” question. If the response is “no”, then it will take “0” value, else it will take “1” value. If we will use the ordinary least square method, sometimes, we will get a value less than 0 or more than 1 though signs of independent variables will be the same over OLS and logit regression. Furthermore, logit regression does not require an error term following a normal distribution, which is more favorable for our estimation. We have used the logit analysis based on the sample.
(1)
Note:
is a binary dependent variable that takes 1 or 0;
is a set of independent variables that represent the lecturers’ demographics (Those are: age, gender, and enrollment to the training on the e-learning course development);
is a set of independent variables that represent the institutional characteristics (Those are: location, ownership, and LMS).
The probability of developing e-learning courses is low 43.5% since 316 lecturers said they developed an e-learning course. To achieve the purpose of the evaluation, the variables were converted as those lecturers’ demographics and institutional variables are insufficient to explain the tendency to develop e-learning. Those are:
- If the lecturer holds a doctoral degree, the dummy variable (qualification_d) value is 1. Otherwise (if he/she holds master’s (or bachelor’s degree, not common)) 0.
- If the university or college is public, then the dummy variable value is (type_univ) 0. If private, then 1.
- If the lecturer works in engineering technology or medical sciences, the dummy variable (maj_fields) value is 1, otherwise 0.
- The position can have an impact on the tendency to develop e-learning. Therefore, if the respondent holds the professor, senior lecturer, lecturer positions then the dummy variable (qualification_d) value is 0, otherwise 1. The dummy variable relationship shall be negative.
- If the HEI has LMS, then the dummy variable (LMS) value is 1, otherwise 0 (LMS).
- If the HEI is located in the urban area, then the dummy variable (urb_rural) value is 1. If it is located in a rural area, the dummy variable is 0.
- If the lecturer was enrolled in the e-learning course development training, then the dummy variable (training) value is 1, otherwise 0.
- If the e-learning course development training continued for less than 4 months, the value of the dummy variable is 1. If the training continued for more than 4 months, the value of the dummy variable is 0 (duration). If the lecturer was not enrolled in the e-learning course development training, the dummy variable is 1.
- If the lecturer worked alone to develop the e-learning course, the dummy variable (team_working) regarding the team who developed the e-learning course is 0, otherwise 1.
- If the training to develop the e-learning course was funded from an international project or program, then the dummy variable (funding) is 1, otherwise 0.
After data cleaning, we evaluated 698 observations (Graph 3) of how these variables influence the tendency to develop an e-learning course.
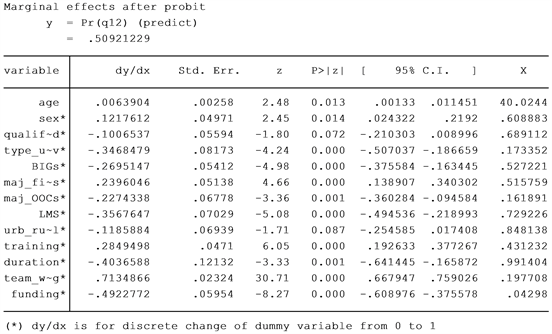
The age of the respondents positively affects the tendency to develop e-learning courses by 6% (age). The female lecturers have a higher tendency to develop the e-learning course by 12.2%, compared to the males (sex). Private institutions are less likely to develop e-learning courses by 34.7% (type_univ). The tendency to develop engineering technology and medical sciences courses is higher by 24% compared to other sectors (maj_fields).
The LMS negatively affects the tendency to develop e-learning courses by 35%. This indicates that the HEIs do not fully explore the LMS. As earlier said, HEIs with LMS tend to enroll their lecturers in the e-learning course development training at organizational expenses. The example of Kenyan University shows that instructors were not satisfied with training on LMS use and course development. They also expressed concerns about low motivation from the university and the lack or limited access to e-learning seminars and workshops where they can learn more about e-learning (Hadullo, Oboko, & Omwenga, 2018) .
The variables such as enrollment to the e-learning course development training (training) and teamwork to develop an e-learning course (team_working) influence the tendency for e-learning course development (Cox & Trotter, 2017) .
(a)
(b)
Graph 3. Results of the regression analysis. *p < 0.05; **p < 0.01; ***p < 0.001. Source: Authors’ calculations.
If the lecturer was enrolled in the training to develop an e-learning course, the tendency to develop e-learning courses is higher by 28.5% compared to the lecturer who was not trained (training). However, the sign of the coefficient indicates that if the training continued for less than 4 months, the tendency decreases (duration). The lecturers tend to work individually rather than engage in teams (team_working) by 71.3%.
If the training is provided within the framework of international projects or programs, it decreases the tendency to develop e-learning courses by 49.2%. The reason shall be explored in-depth. The possible explanations are university management did not explain the relevance of the training to the university mission and objectives, and the training did not meet their expectations or demand; there was no usage of the acquired skills and follow-up responsibility to the lecturers and lecturers’ lack of commitment.
In 2015, the variables such as lecturers’ position, LMS, master’s degree courses out of all levels of tertiary education, team leadership, the expected lifetime of e-course, and marking down assignments in face-to-face learning significantly influenced on e-learning classification.
3.3. Results of the Factor Analysis
We used the factor analysis using principal component analysis. We have selected 9 variables such as age (age), gender (sex), qualification (qualification), LMS (LMS), ownership (type_univ), location (urb_rural), a field of science (field), duration of the training on the e-learning course development (train_duration), and funding source of the training on the e-learning course development (train_funding).
Their eigenvalues are presented in Table 7.
Based on Figure 3, if we sum up the eigenvalues of the first 6 eigenvalues and divide it into the sum of all 9 eigenvalues:
, where
is ith eigenvalue.
It means that the first 6 components can represent the whole information by 82 percent. The covariance matrix is calculated in Table 8.
The varimax rotation was applied such that it will maximize the
. The results are shown in Table 9.
The 1st component, whether the university has LMS (LMS) and ownership (type_univ) are factors that influence the tendency to develop e-learning courses. The 2nd component, the location of the university and colleges (urb_rural) and training duration (train_duration) of the academic are factors. The 3rd component, age (age) and qualification (qualification) are factors. The 4th component, the field of science (field) is a factor. The 5th component gender (sex) and the 6th component of the e-learning funding source (train_funding) are the factors.
4. Limitations
Students were not surveyed. The survey respondents are limited to the lecturers, instructional designers, managers, and researchers who agreed to respond to the survey voluntarily. The survey validity relies on the survey data. The survey data depends on the instrument and respondents’ honesty and accuracy. The survey presents a glimpse of the current state from the lecturers’ and instructional designers’ perspectives. It cannot be generalized due to the above-mentioned limitations.
5. Conclusion
The survey revealed that there is a strong necessity for faculty development as every second lecturer was enrolled in the e-learning course development training.
Extraction method: Principal component analysis.
![]()
Figure 3. The eigenvalues. Source: Authors’ calculations.
Every third lecturer neither knows about the learning theories nor applies them to the e-learning course development. The significant challenges are environment, and faculty development, as 72.65% of the respondents have raised these issues. The web-facilitated courses (67%) are mostly practiced with few online courses (13.03%) and blended courses (18.9%). Figure 4 presents a summary of the regression and factor analysis.
![]()
Table 8. Calculation of covariance matrix.
Extraction method: Principal component analysis. a: 6 components extracted.
![]()
![]()
(a)Extraction method: Principal component analysis. Rotation method: Varimax with Kaiser normalization.
(b)Extraction method: Principal component analysis. Rotation method: Varimax with Kaiser normalization. f: Rotation converged in 8 iterations.
Table 9. Varimax rotation, rotated component matrix f.
![]()
Figure 4. The regression and factor analysis. Source: Authors’ estimates.
The regression analysis method was applied. The institutional factors such as LMS (−35.6), location (−11.85), ownership (−34.7%), provision of the training for its academics, and individual factors such as age (6%), gender (12.2%), qualification (−10.06), a field of science (−24%), enrollment to the training (28.5%), training duration (−40.3), funding source (−49.2) influence to the e-learning course development. This study confirms the results of the Kenyan study, which revealed that instructor characteristics and institutional factors influence e-learning course quality.
Statements
The authors requested the Mongolian National University of Medical Sciences for the information and received the institutional endorsement. The student information is coded and available upon request of the corresponding author.
Appendix 1: Factors for the E-Learning Course Development Survey
Thank you for the acceptance to participate in the survey. The purpose of the survey is to explore the components of the e-learning course and determine the factors that influence its development. The E-learning course is a 1 - 4 credit hour course that makes up educational programs delivered to the student through the Internet, which continues for 16 weeks. If you did not develop the e-learning course, you will spend approximately 3 minutes. If you have partially or fully developed the e-learning course, please respond to each question, which will take around10 minutes. You might need to look at your schedule, and notes. The survey results will be used only for research purposes. If you want to clarify some questions, please contact the author.
I) General information
1) Age:
2) Gender: ☐ Male ☐ Female
3) Qualification: _________________________________________________
4) University: ___________________________________________________
5) Department: __________________________________________________
6) Position: _____________________________________________________
7) Email: _______________________________________________________
8) Have you even participated in the e-learning course?
Yes ☐ No ☐
If no, please proceed to Question 11.
9) If yes, please indicate the duration of the training and seminars.
1 - 5 days ☐ 2 - 4 weeks ☐ 1 - 4 months ☐
☐ From 4 months to 1 academic year ☐ Longer than 1 academic year
10) Please indicate the funding source of the training and seminars.
☐ University ☐ Foreign projects/programs ☐ Private ☐ Other
11) What are the challenges that you have encountered in the e-learning development?_______________________________________________________
12) Have you developed an e-learning course? ☐ Yes ☐ No
If yes, please proceed to Section II. If no, this is the end of the survey. Thank you’re your time.
II) E-learning course
13) What is the name of the e-learning course that you have developed?
________________________________________________________________
14) How many credit hours is the e-learning course worth? ☐
15) How many lectures does the course have? ☐
Note: A lecture is content that lasts for 1 hour and 30minutes. The semester has 16 weeks. Please multiply the number of lectures that are you teaching per week for 16 weeks. For example, 1 lecture per week * 16 weeks = 16 lectures.
16) Out of these, how many online lectures have you developed? ☐
17) How many seminars or assignments does the course has? ☐
18) Out of these, how many online seminars or assignments have you developed? ☐
19) Please tick the e-learning course components that you have developed?
☐ E-learning curriculum ☐ Self-evaluation quiz
☐ Mid-exams ☐ Assignment, project
☐ Final exam ☐ Reading materials, textbooks
☐ Figures, audio, video recordings ☐ Glossaries
☐ Articles and theses ☐ Past exams
☐ Manuals, instructions and recommendations
☐ Other_______
20) Please select the most importantcomponent ofe-learning course?
☐ Discussion board ☐ Lecture ☐ Test/quiz ☐ Seminar
☐ Additional materials ☐ Other____________________
21) How much time did you spend on e-learning course development?
☐ Up to 2 months ☐ 2 - 3 months
☐ From 4 months to 1 academic year ☐ More than 1 academic year
22) Which theory have you applied to develop an e-learning course?
☐ Behaviorism ☐ Cognitivism ☐ Constructivism
☐ Humanitarian theory ☐ Cultural and historical theory ☐ Other
☐ Do not know
23) Please tick to the relevant section where your e-learning course belongs?
24) Have you teamed with someone to develop an e-learning course?
☐ Yes ☐ No
25) If yes, how big is your team? Please tick the relevant number of the team members that developed the e-learning course.
☐ 1 person ☐2 - 3 persons ☐ 3 - 5 persons
☐ More than 6 persons
26) Have you benefitted or received any incentives for the e-learning course developing?
☐ Nothing as it was part of duty ☐ Non-monetary compensation
☐ Credit hours (points, per cents) according to the lecturers’ performance evaluation guideline
☐ Monetary compensation ☐ Do not know
Thank you for your time.
Appendix 2: The Challenges in the E-Learning Course Development
![]()
Table A1. Challenges and Integrated conversion.