1. Introduction
Cassava (Manihot esculenta Crantz) is an important starchy root crop used for food, feed and various industrial applications [1] . The starchy storage roots of cassava are important source of dietary energy in sub-Saharan Africa (SSA) as they provide more returns per unit of input than any other staple crop [2] [3] . Cassava serves as food security and income generation crop for resource poor farmers due to its tolerance to erratic rainfall and poor soils compared to other root and tuber crops. In Sierra Leone, cassava ranks as the second most important staple crop after rice. The fresh storage root production of the crop in the country has increased from 82,500 tons in 1970 to 4.59 million tons (MT) in 2019, growing at an average annual rate of 12.08% [4] .
However, on-farm cassava yields are significantly lower than the potential yields of improved varieties, which have been estimated at ≥25 tons per hectare [5] . For instance, in 2019, an estimated 59,660 ha were cultivated to cassava by 101,021 households, producing 817,342 MT. A wide yield variability ranging from 6.5 MT·ha−1 to 33.9 MT·ha−1 exists among genotypes, with an average yield (14.5 MT·ha−1) below 50% relative to yields obtained under good agronomic practices [5] . Cassava is grown extensively across the country because it is easily propagated, reliable, adaptable to different soils and climate, as well as its high food productivity potential. Cassava is utilized as food for human consumption, animal feed and agro-industries [6] .
Assembling of cassava germplasm is crucial for the conservation and population improvement targeting key traits such as high yield, high starch quality, disease and drought tolerance, early maturity, easy cooking and good flavor. The introduction of genes from diverse populations broadens the genetic base and serves a potent source for delivering of novel genes or quantitative trait loci (QTLs) for important agronomic traits. Genetic diversity is the amount of existing divergence present in genotypes or populations or species [7] . In cassava, genetic divergence results in variations in the DNA sequence, morphological (above and below ground), biochemical (protein structure or isoenzyme), and physiological (abiotic and biotic stress resistance or growth rate) traits of cassava [8] . The genetic diversity of cassava in Sierra Leone is mainly maintained in work collections, in-situ gene bank at the Sierra Leone Agricultural Research Institute and farmers’ fields, represented mainly by landraces and improved/introduced varieties selected by farmers [9] .
Genetic markers are often used to assess the genetic divergence and population structure in living organisms [10] . For instance, molecular markers have been applied in several crop species to determine the population structure and genetic diversity of genotypes [11] . In cassava, Okogbenin et al. [12] reported the useful application of molecular markers in robustly determining population structure and genetic divergence in the crop. Some of the molecular markers utilized in cassava are diversity array technology (DArT), single nucleotide polymorphisms (SNPs), restriction fragment length polymorphism (RFLPs), random amplified polymorphic DNA (RAPD), amplified fragment length polymorphism (AFLP), and simple sequence repeats (SSRs) [13] .
Advances in microarray-based marker technology reveals the diversity arrays technology (DArT) markers as genetic markers of choice for the construction of high-density maps, mapping quantitative trait loci (QTL) and genetic diversity analysis based on their efficiency and low cost [14] . The QTL mapping methods based on bi-parental mapping populations identify the genomic regions with low resolution, whereas, genome-wide association studies (GWAS), based on linkage disequilibrium (LD), utilizes populations from diverse genetic backgrounds for dissection of the genetic architecture of complex traits with high resolution. The GWAS strategy has increasingly been utilized in many crops, including root and tuber crops, to dissect the underlying genetic control mechanism in complex traits [15] . Moreover, with the decreased genotyping cost and improved statistical methods, GWAS is considered as one of the powerful tools to overcome limitations in traditional QTL mapping [16] . The combination of the complexity reduction of the DArT method with high-throughput next-generation sequencing (NGS) technologies, led to the advent of the DArTseq platform with the merit of sequencing of complexity reduced representations [17] . The DArTseq markers based on genotyping-by-sequencing (GBS) technology have been successfully applied for linkage mapping, QTL identification in bi-parental mapping population, GWAS, genetic diversity, as well as in marker-assisted and genomic selection [18] . This technique is rapidly gaining popularity as a preferred method of genotyping by sequencing [18] .
In the last four decades, cassava breeding programs in Africa, Asia, and Latin America, have developed genotypes to ameliorate various production constraints such as biotic and abiotic stresses with improved yield and starch content [19] [20] . While phenotype-based recurrent selection has contributed significant progress, the rate of genetic gain is low due to several breeding complexities associated with the biology of crop typified by the lengthy breeding cycle of the crop due to its inherent poor and asynchronous flowering, insufficient seed production, heterozygosity, slow multiplication rate of planting materials, and a long annual growing cycle of 12 months [21] . These problems limit conventional breeding techniques resulting into inefficient and a low level of genetic gain. The complementation of the conventional crop improvement techniques with advanced molecular tools contribute to reduce the breeding cycle in crops [15] [22] . Moreover, understanding the genetic basis of variation in key traits of interest is critical for increasing their selection efficiency, shortening the breeding cycle and the rate of genetic gain.
Modern crop improvement techniques such as marker-assisted selection (MAS) and genomic selection (GS) can be used to accelerate genetic improvement particularly by reducing generational interval and increasing selection intensity [21] [23] . However, integration of molecular markers as part of MAS in breeding pipelines requires an initial investment in discovery research to identify major effect loci that serve as the targets of selection. With the advances in next-generation sequencing (NGS) technologies, it is now possible to generate genome-wide marker data in targeted populations. The combination of this molecular information from this technique and phenotype data, makes it possible to identify and map locations of agriculturally important genes and quantitative trait loci (QTL) at the whole genome level [24] . The marker trait association obtained is a useful technique that guides the selection of individuals with higher genetic value through marker-assisted selection (MAS) [25] . Thus, the main objectives of this study were to: 1) investigate genetic diversity and genome-wide association studies (GWAS) in cassava germplasm from Sierra Leone; 2) identify SNP markers associated with African cassava mosaic disease and fresh storage root yield of cassava via GWAS. The identified markers are anticipated to facilitate marker assisted selection (MAS) of the studied traits in cassava, and the cassava accessions with high fresh storage root yield and tolerance to ACMD will be potential parents for cassava breeding.
2. Materials and Methods
2.1. Plant Materials
The study panel comprised of 131 cassava varieties collected from different geographical areas (three agro-ecological zones) of Sierra Leone (Figure 1; Supplementary Table S1). The varieties were collected using the multistage sampling approach. Districts considered as the cassava belt areas within the country were selected and three communities per district were also selected at random based on the list of communities used by Statistics Sierra Leone during 2018. The varieties were collected from farmers’ fields with the aid of International Institute of Tropical Agriculture (IITA) cassava descriptors, farmers’ knowledge, preferences and special attributes of the varieties. The different collection sites were located using global positioning system (GPS). A minimum of 10 km separated the two nearest sites of collection. The planting materials collected were stem cuttings.
2.2. Field Experiment and Phenotyping
The experiment was conducted at the Biological Sciences Experimental Farm, Njala University (08˚14'S, 12˚1'W), southern Sierra Leone. The experiment was laid out in an augmented randomized complete block design with three replicates. The stem cuttings of each variety were cut into 20 cm long each and planted in holes made on the crest of single ridge plots measuring 10 m2. The cuttings were planted at a planting distance of 1 m × 1 m between and within rows giving a plant population of 10,000 plants ha−1. The field trial management was done whenever necessary, following the technical recommendations and standard agricultural practices for cassava [26] . Phenotypic data on fresh storage root yield and African cassava mosaic disease (ACMD) severity were recorded. Detailed trait description and ontologies are available
(https://cassavabase.org/search/traits). The fresh storage root yield was recorded
![]()
Figure 1. Population structure and diversity analysis of current GWAS panel. (A) Population structure based on STRUCTURE when K = 5. (B) Neighbor-joining based clustering observed in the study panel using 12,500 SNP markers. (C) Three-dimensional plot of the first three principal components, and (D) heat map of pairwise kinship matrix of 131 cassava genotypes.
in t·ha−1 at·harvest (eight months after planting). The ACMD severity score was done based on a visual assessment of the relative area of plant surface affected by the mosaic virus disease using a five-ordinal scale of 1 - 5 at 6 months after planting. The 1 - 5 disease rating scales used to record the proportion of a plant surface in a plot affected by ACMD represented the following: 1 for no visible virus symptom, 2 for mild symptoms on few leaves but no leaf distortion, 3 for low symptoms of the mosaic virus on leaves, 4 for the severe mosaic on most leaves and leaf distortion, and 5 for severe mosaic and bleaching with severe leaf distortion and stunting.
2.3. Phenotypic Data Analysis
The phenotypic data were analyzed using the one-step linear mixed model that utilizes G-matrix to compute the best linear unbiased predictor (BLUP) values of each genotype for a trait from the best fit model; and the average information criterion (AIC) in restricted maximum likelihood (REML) algorithm [27] was done in the ASReml-R version 4 package [28] . Accordingly, the genetic variance was partitioned into the additive genetic effect (i.e. the proportion that associated with a covariance structure proportional to genetic relationships derived from the molecular markers) and the non-additive genetic effect. The non-additive genetic variance is explained by individual identity rather than the genomic relationship matrix [29] [30] . Broad sense heritability (H2) estimates for fresh root yield and ACMD were estimated from phenotypic variance (σ2p) and the genotypic variance (σ2g). The BLUP values of the genotypes for the traits extracted from the best fit model were used as input for the GWAS model.
2.4. Genotyping and SNP Data Analysis
Total genomic deoxyribonucleic acid (DNA) was isolated from lyophilized young and fully expanded healthy leaves of each varieties studied. The DNA was extracted using the CTAB procedure with slight modification [31] . The quality and concentration of the DNA were assessed using agarose gel and nanodrop, respectively [32] . High-throughput genotyping was done using 96 plex DArTseq protocol, and SNPs were called using DArTSoft as described by Kilian et al. [33] . The raw HapMap file generated was first converted to a Variant call format (VCF) and filtered for missing value and polymorphic SNPs using quality control criteria of low sequence depth < 5; SNP markers with missing values > 20%; genotype quality < 20; minor allele frequency (MAF) < 0.05 and heterozygosity > 50 [15] [34] . Of the 61,214 SNPs subjected to the filtering quality criteria, 12,500 good-quality SNPs were retained for further analyses.
2.5. Population Genetic Analysis
Different population genetic analysis techniques were used to explore the structure and level of genetic diversity in the germplasm. The SNP distribution and density were determined using the “Cmplot” function implemented in the CMplot R package [35] . The SNPlay open website was used to estimate the rate of transition and transversion across the retained SNP. Summary statistics on the minor allele frequency (MAF), polymorphism information content (PIC), the observed and the expected heterozygosity were estimated based on the function “--freq” and “--hardy” using PLINK V1.90 [36] .
The genetic relationship among the cassava germplasm was explored using the principal component analysis (PCA) in FactorMiner R package V3.3 [37] . For the PCA, the origin of the varieties was used as factor.
The cluster samples were put into populations using structure software version 2.3.3 [38] [39] . The structure simulations were done using the admixture model with a burn in period of 20,000 iterations and a Markov chain Monte Carlo (MCMC) set at 20,000. The simulations were repeated 3 times for K-values of 1 to 10. The optimal subpopulation model was determined using the following procedures: 1) by applying the informal pointers (i.e. geographical origin) proposed by Pritchard et al. [38] and Falush et al. [39] ; 2) by considering ΔK, a second order rate change with respect to K, as defined in Evanno et al. [40] , and implemented in STRUCTURE HARVESTER V0.6.94 [41] . Structure population was then plotted using barplot function implemented in R. The phylogeny tree was constructed using ape version 5.0 implemented in R [42] . The exploratory Discriminant Analysis of Principal Components (DAPC) was applied using the adegenet package V2.1.8 [40] . The Admixture was performed through the Bayesian Information Criterion (BIC). A hierarchical cluster was constructed utilizing a kinship relation matrix implemented in GAPIT V3 [41] .
2.6. Genome Wide-Association Study (GWAS) Analysis
The GWAS analysis was done using the compressed mixed linear model (CMLM) implemented in the GAPIT R package V3 and the Manhattan and the QQ plots were visualized in CMplot [35] . For the GAPIT analysis, population structure (Q) and the relationships among individuals were accounted for through a principal component (PC) analysis and a kinship (K) matrix generated from marker data, respectively [36] . For each trait, the optimal number of PCs/covariates included in the GWAS models was determined through model selection using the Bayesian information criterion (BIC), with a maximum of four tested PCs. The GWAS study was done using the following formula:
; where Y was treated as the observed vector of BLUP; β as the fixed effect vector (p × 1) other than molecular markers effects and population structure; α as the fixed effect vector of the molecular markers; ν as the fixed effect vector from the population structure; u as the random effect vector from the polygenic background effect; X, W, and Z are the incidence matrixes from the associated β, α, ν, and u parameters; and ε as the residual effect vector. The significance threshold for the marker-trait associations (MTA) was set to p = 0.05 after assigning the associated probability (P) to each marker using the Bonferroni threshold correction (−log10(P)). The percentage of variation explained by the associated marker (R2) was determined using a step regression implemented in GAPIT.
Circular Manhattan and Quantile-Quantile (QQ) plots were generated by plotting the negative logarithms (−log10) of the P-values against their expected P-values to fit the appropriateness of the GWAS model with the null hypothesis of no association and to determine how well the models accounted for population structure using CMplot [35] . The Manhattan plot was created for visualization of GWAS on the entire genome, and zoom mapping was performed on a particular chromosome after identifying a significant SNP marker.
3. Results
3.1. Phenotypic Trait Assessment
Broad-sense heritability estimates was high, 0.99 for African cassava mosaic disease and intermediate, 0.51 for fresh root yield. The phenotypic value for ACMD ranged from 1.0 to 5.0 with an average of 1.76. The phenotypic value for the fresh root yield ranged from 0.20 to 21.40 t·ha−1 with an average of 7.08 t·ha−1 ( Table 1). The best linear unbiased predictor (BLUP) values of African cassava mosaic disease (ACMD) and fresh storage root yield (FSRY) varied among 131 cassava varieties studied (Supplementary Table S2).
3.2. Genetic Diversity, Population Structure and Linkage Disequilibrium
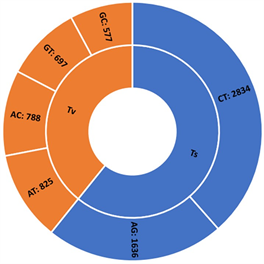
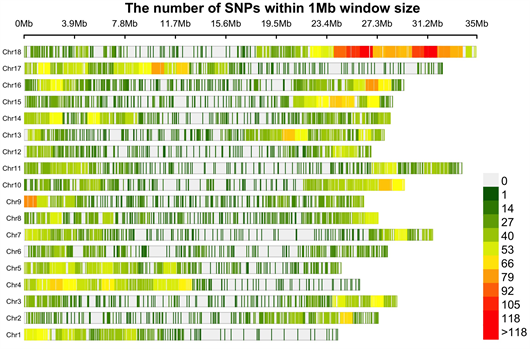
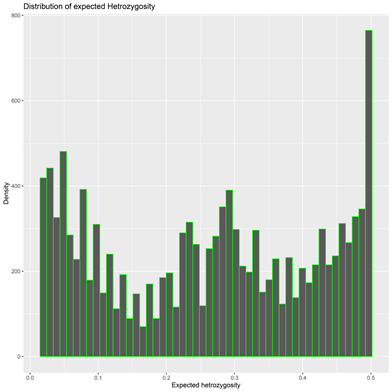
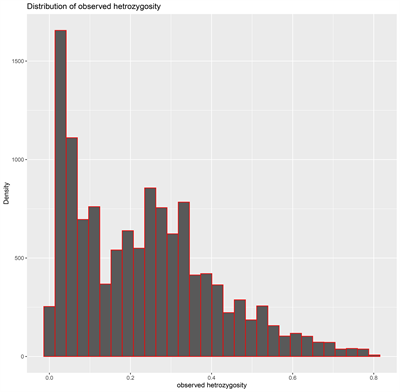
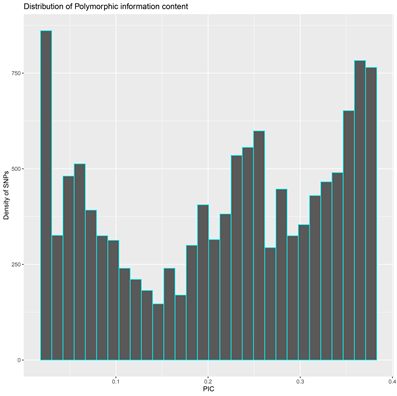
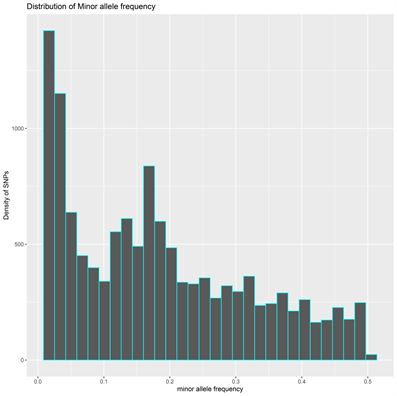
The DArT genotyping of 131 cassava varieties detected the highest number of SNPs (1434) mapped on chromosome 1 and the lowest of 457 on chromosome 13 (Supplementary Figure S1(A)). Transition SNPs (60.76%, 4,470 SNPs) were more frequent than transversions (39.24%, 2887 SNPs) (Supplementary Figure S1(B)). The observed heterozygosity value ranged from 0.0 to 0.802, with an average of 0.233 (Supplementary Figure S1(C)). The expected heterozygosity value ranged from 0.023 to 0.5, with an average of 0.263 (Supplementary Figure S1(D)). The minor allele frequency ranged from 0.012 to 0.500, with a mean of 0.184 (Supplementary Figure S1(E)). The polymorphic information content (PIC) ranged from 0.02 to 0.38, with an average value of 0.22 (Supplementary Figure S1(F)).
The population structure of a diverse panel of 131 cassava varieties was investigated on the basis of a 1K method of model-based Bayesian clustering using 12,500 SNP markers. The population structure analysis revealed the existence of five distinct subpopulations in the cassava panel, which was found consistent with the results of the phylogeny tree analysis through the kinship matrix, and
![]()
Table 1. Descriptive statistics of African cassava mosaic disease (ACMD) and fresh root yield (FRY) of cassava.
ACMD = African cassava mosaic virus, FSRY = fresh root yield (FRY) of cassava.
PCA (Figure 1). The highest membership was recorded in group 1 (36 varieties) and the lowest reported in group 5 (12 varieties).
Group 1 had 36 varieties comprising 34 landraces (collected from farmers and maintained at the Njala Agricultural Research Center, Njala, Sierra Leone) and two improved varieties. One of the two improved varieties, SLICASS6 (SC6_6) is a released variety. Group 2 consisted of 30 varieties, mainly comprising 29 local landraces and one improved variety (IP6). Group 3 had 28 varieties, comprising of 23 local and five improved varieties. Group 4 had 25 varieties, comprising 21 local and four improved varieties. SLICASS6 (SC6_1) and SLICASS4 (SC4_2) are released varieties. Groups 5 had 12 members, comprising 10 local and two improved varieties (Supplementary Table S3). The Cluster membership displayed through the phylogeny tree was in perfect alignment with the Discriminant analysis of principal components (DAPC) cluster membership (Supplementary Table S3). The genetic relationship based on the principal component analysis revealed that the first two PCs account for 85.8% of the total variation (Figure 2). Both the local and improved varieties were distributed along PC1 and the PC2 (Figure 2).
3.3. Genome-Wide Scan for African Cassava Mosaic Disease Resistance
Two SNP loci exhibited significant association with the reaction to African cassava mosaic disease infection (Table 2, Figure 3). The two SNP loci (chr2_10463640 and chr2_11944909) that associated with ACMD had marker effects of 2.47 and 2.93, respectively, and explained 22.6% of the total phenotypic variance (Table 2). These SNPs were mapped on chromosome 2 at 10463640 and 11944909 bp physical positions, respectively. The Quantile–Quantile (QQ) plot corroborated with reducing −log10 (p-value) towards the expected level for the ACMD (Figure 3). The LOD values for SNPs chr2_10463640 and chr2_11944909 were 4.83 and 4.06 with minor allele frequency (MAF) of 0.012 and 0.018, respectively.
3.4. Genome-Wide Scan for Fresh Storage Root Yield
Three SNPs significantly associated with fresh storage root yield (t·ha−1), based
![]()
Table 2. Summary of significant single nucleotide polymorphism (SNPs) describing different genomic regions associated with African cassava mosaic disease (ACMD) and fresh root yield (FRY) in a panel of 32 cassava varieties.
p represents the analysis of variance probability value associated with the variation across variants, SNP = single nucleotide polymorphism, MAF = minor allele frequency, LOD = logarithm of odds.
![]()
Figure 2. Principal component displaying the relationship between and among the local and improved varieties of cassava used in the study.
on p-values (p ≤ 0.005) across the whole cassava genome scan (Table 2, Figure 4). Of the three significant markers, one SNP locus (chr18_1103992) had marker effect of −2.33, and explained 10.1% of the total phenotypic variation. The other two SNPs chr1_31172650 and chr15_10392402 exhibited marker effects of 6.08 and 3.00, respectively, and explained 21.4% of the total phenotypic variation. The SNPs chr1_31172650, chr15_10392402 and chr18_1103992 were mapped on chromosomes 1, 15 and 18 at 31172650, 10392402 and 1103992 bp physical positions, respectively. Evidence of the SNP association was also found in the quantile-quantile (QQ) plot of the observed p-values of the association analysis for
![]()
Figure 3. Genome-wide association analysis of African cassava mosaic disease (ACMD). (A) Rectangular Manhattan plot of 131 cassava varieties indicating the genomic regions significantly associated with the ACMD. The dashed lines on the Manhattan plot represent the significant threshold. (B) Circular Manhattan plot; and (C) Quantile-quantile (QQ) plot of the observed p-values of the association analysis that is expected in a null association for the phenotype.
the FSRY (Figure 4). The LOD values for SNPs chr1_31172650, chr15_10392402 and chr18_1103992 were 4.28, 4.11 and 4.33 with minor allele frequency (MAF) ranging from 0.012, 0.065 and 0.223, respectively.
4. Discussion
4.1. Phenotypic Variation
The natural variation among the cassava accessions for traits was very informative. High broad-sense heritability of 0.99 for African cassava mosaic disease (ACMD) and intermediate broad-sense heritability of 0.51 for fresh root yield
![]()
Figure 4. Genome-wide association analysis of fresh root yield (FRY) of cassava. Rectangular Manhattan plot of 131 cassava varieties indicating the genomic regions significantly associated with the FRY. The dashed lines on the Manhattan plot represent the significant threshold. (B) Circular Manhattan plot; and (C) Quantile-quantile (QQ) plot of the observed p-values of the association analysis that is expected in a null association for the phenotype.
demonstrated substantial genetic variation in the studied traits among the different varieties. These findings indicated that the studied traits are amenable to genetic improvement through selection [43] . Furthermore, the observed natural genetic variation in the studied cassava germplasm signifies their relevance for genetic studies.
4.2. Population Differentiation
A good understanding of the existing population structure within cassava breeding population is necessary for determination of its effects on the ability of GWAS to infer marker-trait association. In this study, all the three clustering methods utilized, DAPC, Kinship relationship matrix and structure, revealed five sub-populations that are imperative for preventing sham associations in GWAS [44] . Thus, the sample size, marker density and diversity demonstrated that the cassava breeding panel used for this study is sufficiently powered to capture allelic variations for ACMD and FSRY studied.
The average minor allele frequency of the risk allele tested for varieties was greater than 10% indicating its significance in detecting genetic effects in the studied populations. The findings support the view that loci with high minor allele frequency have a higher power to detect weak genetic effects compared with those with lower minor allele frequency values [45] [46] . The numbers and patterns of SNP mutations in this study indicate a bias in chloroplast genome evolution in varieties of cassava. The diversity and patterns of SNP mutations in the cassava varieties were possibly due to the function of genes as previously suggested by Cao et al. [47] .
4.3. Genome Wide Association Study
The whole-genome scan for phenotypic and allelic variation in African cassava mosaic disease resistance and fresh root yield identified genome regions on four chromosomes (chromosomes 1, 2, 15, and 18) with significant −log10 values. Both Q matrix (population structure) and K matrix (Admixture) were considered covariates in a mixed linear model for the association analysis to reduce false-positive associations. The Q–Q plots for tolerance to African cassava mosaic disease and fresh root yield showed no inflation of p-values indicating that the structure of relationships was well accounted for in the GWAS analysis. These findings are consistent with the view that traits with no inflation of p-values show that the structural relationship is adequate for GWAS analysis [15] [48] . Genome-wide association mapping has been used to explore the elite alleles of many agronomic traits such as green mite infestation [49] , cassava brown streak disease [50] , cassava mosaic disease [51] and provitamin A and dry matter content [52] in cassava (Manihot esculenta). The genetic basis of ACMD resistance has been reported to be caused by a single major gene, CMD2 locus, detected on chromosome 12 [53] and chromosome 14 [54] . This gene was discovered using bi-parental linkage mapping [55] and GWAS [51] . In the present study, we detected two additional loci on chromosome 2 that indicate the existence of the ACMD resistance gene.
The phenotypic effect values of the favorable alleles of the studied traits were assessed and inferred to positively affect ACMD; and positively and negatively affect FSRY. Based on the stringent criterion of −log10, two significant markers trait associations exhibiting 1.46 e−0.5 and 8.68 e−0.5 were identified for ACMD and three ranging between 4.71 e−0.5 and 7.71 e−0.5 were identified for FSRY. The information on SNP variants from this study would fast-track the application of genomics-informed selection decisions in breeding cassava for resistance to African cassava mosaic disease and higher root yield. Similar studies revealing the great potential of GWAS in contributing to genomics-informed selection decisions have been reported for some root and tuber crops such as cassava [56] , water yam [44] , white yam [15] and potatoes [57] .
5. Conclusion
The present study demonstrates the potential of highly informative and selective SNP markers for genetic diversity analysis and genome wide association studies in the 131 cassava varieties. This study also provides a direction for breeding efforts in the selection of parents from the current collection with potential for novel genes or QTLs for important agronomic traits: high root storage root yield and tolerance to African cassava mosaic virus (ACMD). Genome-wide association studies successfully identified and tagged five single nucleotide polymorphism (SNP) loci significantly associated with the studied traits. The information from our study could contribute to the design of new breeding strategies to hoard superior alleles for tuber yield per plant and yam mosaic virus in future marker-based breeding. Findings also contribute to a better understanding of the genetic architecture of ACMD and fresh root yield traits in cassava. The chromosomal regions controlling these studied traits could be exploited for selection and effective pyramiding of favorable alleles in white yam population improvement.
Acknowledgements
This research was supported by the International Atomic Energy Agency (IAEA) TC project (FS-SIL5020-1801894) to Janatu V. Sesay (PhD student), Njala University (NU), Sierra Leone. The authors are thankful to National Crops Resources Research Institute (NaCRRI), Kampala, Uganda, for facilitation with DNA extraction and analysis. The technical support from the cassava breeding team, Njala, Sierra Leone is dully acknowledged.
Supplementary
Supplementary Table S1. Description of cassava varieties utilized for the study.
Supplementary Table S2. Best linear unbiased predictor (BLUP) values of African cassava mosaic disease (ACMD) and fresh root yield (FRY) among 131 cassava varieties.
Supplementary Table S3. Cluster membership of 131 varieties of cassava based on Discriminant analysis of principal components (DAPC).
Cl = cluster.
(A) (B)
(C) (D)
(E) (F)
Supplementary Figure S1. Overview of SNP genotyping data. (A) Density of SNPs on the 18 chromosomes of the cassava association mapping panel, (B) number of transition and transversion SNPs, (C) histogram of observed heterozygosity, (D) histogram of expected heterozygosity, (E) histogram of minor allele frequency distribution and (F) histogram of polymorphic information content across the Manihot exculenta genome.