Monitoring and Evaluation of Air Pollution at Ohaji/Egbema Flow Station and Its Environs via GPS in Ohaji Egbema Lga, Imo State Nigeria ()
Abstract
The work of “Monitoring and Evaluation of Air Pollution” the main aim of this work is to measure the concentrations of gases which include CO2, CO, NOx, SOx and thermal radiation and carry out an analysis of the measured data. This experiment was scheduled to take place at Egbema flow station which is managed by NPDC (Nigerian Petroleum Development Commission) Shell location 2 in Obiakpu, Ohaji Imo state. The bad effects of these pollutant gases on the community can include cause of diseases to plants and animals, causes of physical ailments in the respiratory tract of humans, and death and degradation of the surrounding environment. The parameters measured during this exercise include the distance from the flow station, latitude and longitude of the distance measured on the earth’s surface, time for the experiment and the concentration of pollutant gases. The instrument used includes CO meter, CO2 meter, SOx and NOx meters, and thermal radiation meter. The gases were measured in three different time intervals between 10:50 am - 11:23 am (for CO: 0.02 ppm, 0.01 ppm, 0 ppm, 0 ppm, 0.01 ppm, 0 ppm; for CO2: 0.04 ppm, 0.01 ppm, 0.01 ppm, 0.02 ppm, 0.01 ppm, 0 ppm; for SOx: 0 mg/m3, 0 mg/m3, 0 mg/m3, 0 mg/m3, 0 mg/m3, 0 mg/m3; for NOx: 0.127 mg/m3, 0.098 mg/m3, 0.12 mg/m3, 0.122 mg/m3, 0.113 mg/m3, 0.103 mg/m3; for thermal radiation: 57.4 W/m2, 61.5 W/m2, 65.1 W/m2, 64.9 W/m2, 81.9 W/m2, 148.3 W/m2), 1:30 pm - 2:13 pm (for CO: 0.01 ppm, 0.02 ppm, 0 ppm, 0 ppm, 0.1 ppm, 0 ppm; for CO2: 0.01 ppm, 0.01 ppm, 0.01 ppm, 0.01 ppm, 0 ppm, 0 ppm; for SOx: 0 mg/m3, 0 mg/m3, 0 mg/m3, 0 mg/m3, 0 mg/m3, 0 mg/m3; for NOx: 0.122 mg/m3, 0.117 mg/m3, 0.114 mg/m3, 0.115 mg/m3, 0.122 mg/m3, 0.11 mg/m3; for thermal radiation: 120.5 W/m2, 132.8 W/m2, 156.7 W/m2, 170.5 W/m2, 148.5 W/m2, 95.1 W/m2) and 5 pm - 5:37 pm (for CO: 0.02 ppm, 0.1 ppm, 0.1 ppm, 0 ppm, 0 ppm, 0 ppm; for CO2: 0.03 ppm, 0.2 ppm, 0.1 ppm, 0.1 ppm, 0 ppm, 0.1 ppm; for SOx: 0 mg/m3, 0 mg/m3, 0 mg/m3, 0 mg/m3, 0 mg/m3, 0 mg/m3; for NOx: 0.128 mg/m3, 0.118 mg/m3, 0.119 mg/m3, 0.117 mg/m3, 0.124 mg/m3, 0.114 mg/m3; for thermal radiation: 121.4 W/m2, 133.3 W/m2, 160.2 W/m2, 177 W/m2, 161.4 W/m2, 97.2 W/m2) at distances of 0 m, 100 m, 300 m, 500 m, 1000 m and 1500 m respectively. From the values gotten from the gas concentration measurements, we can say that SOx gases are either minute or not available in the environment. Also, from the graph analysis carried out on the gases, we can also say that CO2 concentration is either increasing or at the same level throughout the distance while the concentrations of NOx, CO and thermal radiation reduce with increasing distance. On the part of the “averaging time model” used in the analysis, we can say that at increasing averaging times the concentration of gases reduces. Analysis of whether the environment is polluted and with which gas exactly is also carried out using the Air quality index and it was deduced that the environment is polluted with NOx gases because the concentration is above the normal environmental ambient temperature.
1. Introduction
The nuisance caused by air pollution to the surrounding environment and the world as a whole is worrisome. Air pollution can take several forms where some are visible to the naked eye while some are so minute that they cannot be seen with the naked eye. Since primary pollutants are largely due to human processes, they are referred to as anthropogenic [1]. Increased industrial activities have led to pollution stress on surface water from industrial, agricultural and domestic sources [2] [3]. It has severally been noted that water is one of the most important substances on earth. People can only survive seven or fewer days without water [4]. They can take the form of exhaust smog, factory emission and dust particles. The simple definition of air pollution is that it is the introduction of chemicals, particulate matter and biological matter to the atmosphere which has the potential of causing harm or damage to the surrounding environment, humans and living organisms [5]. Air is said to be impaired when its natural uses are impaired [6]. Major streams in industrial areas of some Nigerian cities are already seriously polluted by waste from industries such as streams flowing through densely polluted areas [7]. In our cities, the rampant use of low-quality fuel is combined with an expansion in the number of vehicles [8]. Air pollution is accountable for the death of 7 million persons worldwide each year or one in eight premature deaths yearly. Almost 570,000 children under the age of five die every year from respiratory infections linked to indoor/outdoor pollution and secondhand smoke. Children exposed to air pollution have an elevated risk of developing chronic respiratory problems such as asthma. Secondary pollutants on the other hand include ozone and products of photochemical reactions including those formed as a consequence of chemical reactions involving the primary pollutants and other agents such as soot and sunlight [9].
This suggested that Nigeria’s oil fields or flow stations contribute more to global warming (through the flaring of associated gas) than the rest of the world [10]. Nigerian roads can cause significant air pollution problems. Lead and Carbon emissions into the environment are major air pollutants in urban centers such as Onisha, Portharcourt and Lagos. In large metropolitan cities, the emission of toxic gases from vehicles is another source of atmospheric pollution [2]. In the monitoring of air pollution, several researchers worldwide have developed models to monitor many of the pollution gases such as sulphur dioxide, carbon monoxide, carbon dioxide, nitrogen oxides, etc. [11].
Oil industry activities have polluted the environmental quality, and the paradox of poverty in the Niger delta, the petroleum industry, the economy and the environmental pollution [12]. Undertook a comparison of concentrations of ambient air pollutants in the region and Lagos State and concluded that pollutant concentrations are the highest in the Niger Delta and argued that some of the greenhouse gases (such as methane and carbon dioxide) emitted at flare sites contribute to global warming. Report from Katestone Scientific to Environment Protection Authority of New South Wales [13].
The report also indicates that Nigeria accounted for 19.79 percent of the global figure [14]. It is estimated that motor vehicles can emit 26 times more the amount of Carbon Monoxide, 21 times the amount of hydrocarbons and 3.6 times the amount of nitrous oxide of an average vehicle in Nigeria as compared to the United States.
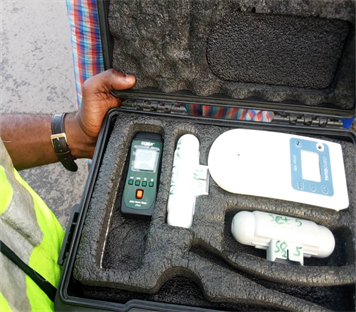
2. Equipment and Instruments Used
Carbon monoxide meter.
Carbon dioxide meter.
SO2 and NO2 meters.
Thermal radiation meter.
Watch used for measurement of time.
GPS meter app is used to measure distance and GPS locations.
Tape measure.
2.1. Nigerian Ambient Air Quality Standard
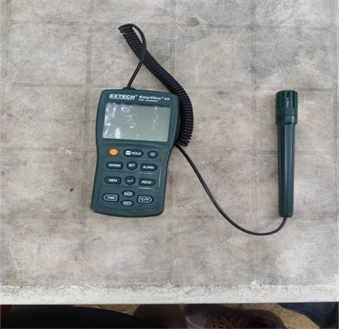
2.2. Carbon Monoxide Meter

Meter description.
1) LCD display.
2) Power On/Off key.
3) MODE key.
4) Power on/Alarm light.
5) Sel key.
6) Sensor.
7) Battery compartment.
2.3. Operating Principles and Measurements
IMPORTANT: Ensure that the meter is turned on in an area free of CO. If not, the meter will read incorrectly when subsequently measuring CO.
1) Press the ON/OFF button to turn the meter on. Allow time for the meter to perform the self-test and for the display to settle.
2) To use the meter, trace the CO around the area of the suspected leak.
3) The meter will indicate the presence of CO (in ppm) on the LCD display. An audible beep will sound at 35 ppm alerting the user that the threshold of dangerous CO levels has been detected. The higher the concentration of CO, the faster the beeper will sound. Above 200 ppm the beeper will sound continuous.
4) To turn the meter off, press the ON/OFF key. If the meter is left on, the meter will automatically power off after 15 minutes.
2.4. How Do Carbon Monoxide Detectors Work?
Carbon monoxide detectors sound an alarm when they sense a certain amount of carbon monoxide in the air over time. Different sensors set off different types of alerts.
Biomimetic sensor: A gel changes color when it absorbs carbon monoxide, and this color change triggers the alarm.
Metal oxide semiconductor: When the silica chip’s circuitry detects carbon monoxide, it lowers the electrical resistance, and this change triggers the alarm.
Electrochemical sensor: Electrodes immersed in a chemical solution sense changes in electrical currents when they come into contact with carbon monoxide, and this change triggers the alarm.
Once the alarm sounds, the carbon monoxide detector must be in a carbon monoxide-free environment to reset itself.
2.5. Carbon Dioxide Meter
A gas sensor measures the concentration of gas in its vicinity through direct interaction with the gas. The sensor identifies gases by measuring the current discharge in the device.
The carbon dioxide gas sensor measures gaseous carbon dioxide levels by detecting the quantity of IR radiation absorbed by carbon dioxide molecules. The sensor employs a hot metal filament that acts as an IR source to generate IR radiation.
The IR source is located at one end of a sensor tube, and another end is provided with an IR sensor. The IR sensor measures the amount of radiation that passes through the sample without being absorbed by the carbon dioxide molecules.
The sensor measures the IR radiation absorbed in the narrow band at 4260 nm. The greater the absorbing gas concentration in the sampling tube, the lesser the amount of radiation from the source.
As a result of this increase in temperature, a voltage is generated, amplified and read by an interface system. Meanwhile, the carbon dioxide gas diffuses via the sensor tube by the eight vent holes.
Vernier Software and Technology provide a clear demonstration of how a modern-day carbon dioxide sensor works to measure the carbon dioxide concentration.
2.6. The Sulphur Oxide (SOx) and Nitrogen Oxides (NOx) Meter
The sustainment of all living things is due to a combination of gases in defined proportion that collectively form the atmosphere. Any increase or decrease in percentage of these gases will cause imbalance and can be harmful for survival. Emission of gases that contain sulphur oxides (SOx) and nitrogen oxides (NOx) are the main source of the acidifying substances in the environment. The pollution norms for these are becoming stricter day by day. In recent years the emission norms for SOx and NOx for thermal power plants have been revised to 100 mg/Nm3 for all plant installed from1st January 2017. In view of this, accurate measurement of SOx and NOx in the flue gases is very important. The principles which are being commonly utilized for measurement of SOx and NOx are
Infrared (for analyzing SOx, NOx, CO and CO2).
Chemiluminescence (for analyzing NOx).
Ultraviolet florescence (for analyzing SOx) When a molecule of sample gas is exposed to infrared light, it absorbs some of the light and thus gains energy to vibrate and rotate. As a result, the infrared absorbing gas expands. The wavelength region in which a gas absorbs light is unique to each gas.
By measuring the intensity of infrared light that travels through the gas the concentration of a gas can be determined. The analyzers with infrared technique are generally used when concentration of SOx and NOx to be measured is relatively high (>100 ppm). Analysis of CO and CO2 is mostly carried out using infrared principle. Chemiluminescence technique is used to analyze NOx. Total oxides of nitrogen (NOx) can be measured using this technique by passing the sample over a heated catalyst to reduce all oxides of nitrogen to NO2. NO2 will oxidize to NO2 in the presence of O3 as it is relatively unstable molecule. Certain quantity of light is produce for each NO2 molecule which is reacted in this reaction. This light can be measured using a photodiode tube and associated amplification electronics.
The intensity of light in the measurement cell is proportional to the mass flowrate of NO2. The chemiluminescence reaction of
Light Ultraviolet florescence method is used for analyzing SO2. This method is based on the principle that SO2 molecules absorb ultraviolet (UV) light and become excited at one wavelength, SO2 + UV light at one wavelength = SO2# (Excited) Then decay to a lower energy state emitting UV light at a different wavelength. SO2# = SO2 + UV light at another wavelength the intensity of fluorescence is proportional to the SO2 concentration. The sample gas is passed through the hydrocarbon scrubber which removes hydrocarbons contained in sample gas, which are excited with UV light and consequently emit fluorescence. The SO2 molecules pass through the hydrocarbon scrubber unaffected.
2.7. Thermal Radiation Meter
Basic Operation Principle
Generally, a thermal detector contains the following:
There is a light absorber, which is thermally more or less insulated against the environment, so that its temperature can rise when incident light is absorbed.
There is also some temperature sensor, which either measures the absolute temperature of the absorber or the temperature difference between absorber and heat sink. In the former case, one either needs to keep the heat sink temperature constant or to measure it separately.
In addition, there are some parts for mounting the sensor, possibly also a cooling system and integrated electronics for signal amplification and digitization.
2.8. Absorbers
The absorption of light should be strong in order to obtain the maximum temperature rise for highest sensitivity of the detector. One often uses relatively thin surface absorbers, having a rather small absorption length for the light. That minimizes the heat capacitance and thus optimizes the speed of response. However, the most robust absorbers are volume absorbers with a longer absorption length; these can tolerate high optical intensities.
2.9. Distances Measured
The distances measured cover the range from 0 meter from the flow station to 1500 meters away from the flow station. We took measurements between the following distance intervals 0, 100, 300, 500, 1000 and 1500 meters. We focused our attention within the 1500 meters radius to know the concentration of these gases, as active communities falls within this 1500 meter radius on the geographical map. The following table shows the distances in meters and the longitude and latitude of our measuring distance intervals.
3. Results and Analysis
![]()
Table 1. Tables and graphs for analysing the results of the experiment.
![]()
Table 2. 2nd table for result of the experiment done between 1:30 and 2:13 pm.
![]()
Table 3. 3rd table for result of the experiment done between 1:30 and 2:13 pm.
4. Discussion of Results
The monitoring and evaluation of air pollution at the Egbema flow station in the Obiakpu community was a very important field trip. Tables 1-3 respectively show the readings gotten from the measurement of concentrations of pollution gases in the atmosphere which includes CO, CO2, NOx, SOx and thermal radiation was carried out using CO meter, CO2 meter, NOx meter, SOx meter and thermal radiation meter. The graphs in Figures 1-3 are showing the level of pollution caused by the activities of the oil facilities in that environment. The readings gotten from these exercises can be used to ascertain the concentration level of gases in the atmosphere and know whether it is harmful or not and whether it is above the ambient level. While graphs in Figures 4-6 are thermal radiation plots, concentration against distance plots and thermal radiation (w/m2) against distance with respect to time.
After taking readings of the required gases with the required instruments, from the results of the first readings we discovered that all other gases from the scope (CO, CO2, NOx and thermal radiation) were present in the atmosphere except SOx. The reason there is no detection of SOx can be a factor of the lesser release of SOx gas in the environment, the factor of us being far from the point
![]()
Figure 1. The graph of CO, CO2, NOx and SOx for 1st result.
![]()
Figure 1. The graph of CO, CO2, NOx and SOx for 1st result.
![]()
Figure 2. The graph of thermal radiation for 1st result.
![]()
Figure 3. The graph of CO, CO2, NOx and SOx for 2nd result.
![]()
Figure 4. The graph of thermal radiation for 2nd result.
![]()
Figure 5. The graph of CO, CO2, NOx and SOx for 3rd result.
![]()
Figure 6. The graph of thermal radiation for 1st result.
source, or a technical issue where the equipment in use is not able to make detection of that particular gas. We assume the absence of the gas in the atmosphere as the reason for the zero-readings.
5. Conclusions
From what we have done so far, we are able to deduce from the analysis that the environment is polluted by this set of gases: CO, NOx and thermal radiation excluding SOx.
We also deduced that the concentration of CO, NOx and thermal radiation was reducing as distance increased, and the concentration level of SOx is so minute that it cannot be measured using the measuring instrument. And the concentration of the CO2 is increasing and remains constant throughout the distance covered.
This analysis shows that CO, NOx and thermal radiation have a particular point source which is the Egbema flow station while SOx is a non-point source that can be generated from the environs.
Again from the averaging times model, we can deduce that as the averaging times increase from 3 minutes, 10 minutes and 30 minutes. The concentration of the pollutant gases decreases.
Finally, from AQI analysis, we can say that the environment is highly polluted with NOx while other gases are not. Actions should be taken to reduce the concentrations in the atmosphere due to the adverse effect.
References
- 1. Cunningham, P.W., Cunningham, M.A. and Saigo, B. (2005) Environmental Science—A Global Concern. McGraw Hill, New York, 330-336.
- 2. Ajayi S.O. and Adeleye S.A. (1977) Pollution Studies on Nigeria Rivers I: Preliminary Report on the Pollution Level of the River Ona and Ogunpa. Bulletin of the Chemical Society of Nigeria, 2, 71-82.
- 3. Ajayi, S.O. and Osibanjo, O. (1981) Pollution Studies on Nigeria Rivers, II: Water Quality of Some Nigerian Rivers. Environmental Pollution Series B, Chemical and Physical, 2, 87-95. https://doi.org/10.1016/0143-148X(81)90044-6
- 4. Anyikwa, S.O., Ngolube, C.B., Nzeoma, C., Umeojiakor, C.T., Edo, F.A., Nmecha, M.I. and Okereke, C.J. (2019) Effect of Brewery Effluent on Surface Water Quality of Ikpoba River, Benin City, Edo State. International Journal of Science and Engineering Investigations (IJSEI), 8, 130-134. http://www.ijsei.com/papers/ijsei-89119-16.pdf
- 5. Pope III, C.A., Burnett, R.T., Thun, M.J., Calle, E.E., Krewski, D., Ito, K. and Thurston, G.D. (2002) Lung Cancer, Cardiopulmonary Mortality, and Long Term Exposure to Fine Particulate Air Pollution. Journal of American Medical Association, 287, 1132-1141. https://doi.org/10.1001/jama.287.9.1132
- 6. Schandorf, E.A and Asiedu, A.B. (2003) The Tropical Environment and Environmental Pollution. In: Adinna, E.N., Ekop, O.B. and Attah, V.I., Eds., Environmental Pollution and Management in the Tropics, SNAAP Press, Enugu, 13-14.
- 7. Stone, D.K., Lynch, S.K., Pandullo, R.F., Evans, L.B. and Vatavuk, W.M. (1992) Flares. Part 1: Flaring Technologies for Controlling VOC-Containing Waste Streams. Journal of the Air and Waste Management Association, 42, 333-340. https://doi.org/10.1080/10473289.1992.10466996
- 8. Talebi, A., Fatechifar, E., Alizadeh, R. and Kahforoushan, D. (2014) The Estimation and Evaluation of New CO, CO2, and NOX Emission Factors for Gas Flares Using Pilot Scale Flare. Energy Sources, Part A: Recovery, Utilization, and Environmental Effects, 36, 719-726. https://doi.org/10.1080/15567036.2011.584117
- 9. Tesner, P.A., Smegiriova, T.D. and Knorre, V.G. (1971) Kinetics of Dispersed Carbon Formation. Combustion and Flame, 17, 253-260. https://doi.org/10.1016/S0010-2180(71)80168-2
- 10. Tesner, P.A., Tsygankova, E.I., Guilazetdinov, L.P., Zuyev, V.P. and Loshakova, G.V. (1971) The Formation of Soot from Aromatic Hydrocarbons in Diffusion Flames of Hydrocarbon-Hydrogen Mixtures. Combustion and Flame, 17, 279-285. https://doi.org/10.1016/S0010-2180(71)80049-4
- 11. Venkatram, A. (2002) Accounting for Averaging Time in Air Pollution Modeling. Atmospheric Environment, 36, 2165-2170. https://doi.org/10.1016/S1352-2310(02)00200-5
- 12. Victoria Environmental Protection Authority (1985) Plume Calculation Procedure: An Approved Procedure under Schedule E of State Environment Protection Policy (The Air Environment). Publication No. 210. Environment Protection Authority of Victoria, Melbourne.
- 13. Katestone Scientific (1998) Peak-To-Mean Ratios for Odour Assessments. Report from Katestone Scientific to Environment Protection Authority of New South Wales.
- 14. Orubu, C.O. (2002) Oil Industry Activities, Environmental Quality, and the Paradox of Poverty in Niger Delta. In: Orubu, C.O., Ogisi, D.O. and Okoh, R.N., Eds., The Petroleum Industry, the Economy and the Niger-Delta Environment, African Journals Online, 17-31.