A Comprehensive Economic Assessment of Producing Biodiesel Derived from Used Cooking Oil Using the BioPro380 EX ()
1. Introduction
Biofuels are sustainable alternative source of energy for addressing the global concern caused by the combustion of high carbon fuels [1] [2]. Several authors [3] included, predicted that by 2040 biodiesel share in the global energy mix is expected to increase by 70% in the transportation sector. At the present, biodiesel is mainly produced from conventionally grown edible oils, such as soybean, rapeseed, sunflower, and palm oil. However, the use of grown edible oil to produce biodiesel is unsustainable particularly for developing nations of which most nations still struggle to sufficiently feed their population. Consequently, the shift from the use of grown edible biodiesel feedstock to non-edible ones is becoming increasingly attractive globally. The shift is believed to be influenced by scientific reports which suggest that producing biodiesel from grown edible oil is approximately 55% more expensive when compared to the use of non-edible oils [4] [5] [6]. Authors further echoed that the cost depends on the type of feed stock employed. This observation suggests that, using low-cost non-edible oils, such as used cooking oil, is likely to increase the economic case of biodiesel production on a large scale making its unit cost competitive to petroleum diesel.
[7] [8] [9] [10], reported that unit cost of biodiesel is highly influenced by feedstock costs, which range from 60 to 95 percent of the overall biodiesel production costs. Available evidence also indicates that the high cost of production is the primary barrier for commercial application of biodiesel development sector in several countries particularly in developing nations. To determine the cost of competitiveness of biodiesel, [11] evaluated the cost of petroleum diesel to the cost of producing Jatropha-based biodiesel between 2010 and 2013. The study revealed the price difference of petroleum diesel and biodiesel in 2010 was estimated to be approximately 33% with biodiesel leading the market price. However, in 2013 the investigation further revealed a 16% price difference with drop in biodiesel pump price by approximately 48% in a period of three years, supporting predictions made by [3] that by 2040, biodiesel is expected to increase its share in the global energy mix by 70% in the transportation sector.
Several authors [12] included also echoed that plant capacity to produce biodiesel is also a major factor on the cost of production. The authors employed small processing plants capacity of approximately 15,360, 7680, and 1920 liters per year, to investigate the impact of plant capacity on biodiesel production cost. The cost of producing biodiesel using soybean and sunflower oils as feedstock was evaluated by the authors. The overall difference in production costs between relatively small and large plant capacity for soybeans and sunflower feedstock were 17% and 37%, respectively. The investigations further revealed that increasing plant capacity lowers production costs regardless of the type of feedstock employed. Similarly, [13] also performed economics analysis of producing biodiesel in three different plant capacities of 125,000, 80,000, and 8000 liters per year using used cooking oil as a feedstock. The authors revealed that the production cost of a small plant capacity of 8000 liters per year was approximately 19.3% higher than that of a larger plant capacity of 125,000 liters per year. [14] [15] also report that increasing plant capacity improves biodiesel production plant efficiency thereby reducing the unit cost of production. These authors further noted that biodiesel produced from high-capacity plants can be cost-competitive with conventional diesel. This is consistence with observations made by [16], who also observed that a large-scale biodiesel facility with a capacity of equal to or higher than 100,000 tons/year which is approximately 8.3 tonnes of production per month is recommended for continued cost-effective biodiesel production. Several studies, including a study by [13], show that biodiesel production in large scale plants is more cost effective than in small scale plants.
The paper employs Bio-Prob 380 EX biodiesel reactor to study economic analysis of producing biodiesel using used cooking oil collected within Gaborone City in Botswana. The results are used to scale up the production plant capacity to 5500 liters of biodiesel production per month. The economic analysis employed sensitivity and cost to plant capacity analysis to determine the effects on profit and loss when the unit selling price and unit cost of production are varied. According to [17] [18] [19] [20], sensitivity analysis, also known as “what if” analysis, is an important part of the decision-making process, because it evaluates how the project’s outcomes are correlated to and influenced by its inputs. This type of analysis is used to identify the relevant variables that have the greatest impact on the project’s feasibility and effectiveness. Similarly [21] [22] [23], stated that cost to capacity method is a cost estimating approach that utilizes historical costs and capacity to generate current cost estimates for a facility or a single piece of machinery or equipment. In the present investigation a scale factor of 1 (one) was employed to demonstrate price difference of constructing a small scale plants to large scale plant. The scale factor influences the precision of the cost estimation obtained by a cost to capacity analysis. These tools help to evaluate the feasibility of biodiesel production.
2. Materials and Methods
The study was carried out at the University of Botswana using readily available feedstocks such as used cooking oil to produce biodiesel. This study employs analytical quantitative methodologies such as sensitivity analysis on data collected during production, in order to determine the economic feasibility of biodiesel production in Botswana. The research also highlights the multiple processes involved in converting feedstocks such as used cooking oil, beef tallow, and plant oil to biodiesel.
2.1. Determination of Free Fatty Acids (FFA)
Before conversion of used cooking oil to biodiesel the authors first determined the level of FFA of the used cooking oil. This was done to determine whether to use a single or two step transesterification processes during biodiesel production. [24] [25] [26] reported that relatively high levels of FFA (>3%) suggest a two-step transesterification processes. In the present investigations, a titration method was used to determine the level of FFA, and the authors followed the same procedures by [27] [28] [29]. Consequently, the detailed procedure on the determination of FFA level will not form part of the methodology for the present investigation. Prior to charging the biodiesel reactor, demonstrated by Figure 1 under Section 2.4, the feed-oil was heated and filtered. Section 2.2, therefore described the heating and filtration processes which were applied in the present investigation.
2.2. Heating and Filtration Processes of Feed-Oil
The determination of FFA level of used cooking oil was followed by pumping approximately 400 litres of feed-oil from collecting tanker into two metal containers
![]()
Figure 1. Bio-Pro 380 EX schematic diagram.
of approximately 200 litre each using double diaphragm pump connected to air compressor and operating at flow rate of approximately 45 litres per minute. Electrical heating belts were then used to heat the feed-oil from room temperature to approximately 60˚C and maintained at the same temperature for approximately 8 hours before charging the biodiesel reactor (Bio-Prob 380 EX). Figure 1 shows the schematic diagram of Bio-Pro 380 EX processor. The heating processes enabled most of the suspended particles to settle at the bottom of the metal containers. The feed-oil was then filtered using 1.18 mm filter wire mesh and then pumped into the Bio-Pro 380 EX processor before the commencement of transesterification processes. Figure 2 shows used cooking oil as received and after heating. The data depicts the difference in appearance of used cooking oil before and after heating. The used cooking oil before heating was dark brown in colour while after heating exhibited relatively clear and less dense.
2.3. Energy Consumption during the Production Process
To collect the required data for economic analysis, an energy data logger 1738 fluke power logger was then prepared to record energy consumed during each stage of biodiesel production. The 1738 fluke power logger automatically records the real time voltage, current and consumed power. The power logger was connected to the Bio-Pro 380 EX biodiesel processor power breaker box to record the total energy consumed and the cost of energy associated with all stages of production processes. The power logger has an integrated system that allows the operator to specify the energy cost per kWh, file name, duration for data recording, and interval for the logging session before operation. Figure 3 shows a single-phase connection electrical lead connected to a Bio-Prob 380 EX power breaker box for data collection, while Table 1 presents specifications of the power data logger.
2.4. Conversion Processes of Used Cooking Oil to Biodiesel Using the Bio-Pro 380 EX Processor
The FFA results suggested two-stage transesterification processes. The first
![]() (a)
(a) ![]() (b)
(b)
Figure 2. Demonstrate used cooking oil samples before and after heating. (a) As received; (b) After heating.
![]()
Figure 3. Single-phase connection of the power logger on the biodiesel processor breaker box.
![]()
Table 1. Power logger specifications.
transesterification stage which is referred to as acid-catalysed transesterification involved reacting feed-oil with 25 litres of methanol and 0.5 litres of 98% concentrated sulphuric acid (catalyst). This was performed to reduce relatively high FFA (6%) level recorded for the feed-oil to approximately below 3% which is recommended by several authors as mentioned in Section 2.1. During the acid-catalysed transesterification processes, the mixture was continually stirred, and reactor temperature was maintained at approximately 60˚C. The acid-catalysed transesterification process took approximately 6 hours. During the first 6 hours the energy consumed by the reactors was also continually recorded by the energy data logger as mentioned earlier.
The second stage of transesterification commenced, by dissolving 5 kg of Potassium Hydroxide (catalyst) flakes in 50 litres of methanol, producing methoxide. The methoxide was then pumped into the reactor using the same double diaphragm pump. The reaction time was further set to approximately 4 hours, with the reactor temperature still maintained at approximately 60˚C while continuously stirred the mixture. The power data logger was also programmed to record the electrical power consumed during stage two of biodiesel production. At the end of reaction time, the reactor was switched off to allow the mixture to separate into biodiesel and crude glycerol layers, with crude glycerol at the bottom of the reactor. To ensure complete separation, the process was allowed approximately 24 hours before draining the crude glycerol from the bottom of the reactor. From at least 380 litres of feed-oil about 75 and 360 litres of crude glycerol and biodiesel were produced respectively.
To complete the production processes, biodiesel was then washed by pumping hot water (mist) at approximately 70˚C from above the biodiesel in the reactor. The biodiesel was washed three times. During the last stage the stirrer was activated, and energy data logger was also re-programmed to record the electrical energy consumed during the final washing stage when the stirrer was in action. At the end of the biodiesel washing processes, the biodiesel drying processes commenced. The processes involved heating and stirring of the biodiesel with the energy data logger continuously recording electrical energy consumed during the biodiesel drying processes. The drying period was based on the maximum allowable moisture content of 0.5 mg/g as specified in American Society for Testing and Materials Standard (ASTM D 2709). Consequently, the moisture content of biodiesel in the biodiesel reactor was recorded every hour of the processing time, and the reactor was switched off when the level of moisture content was lower than the stipulated level of 0.5 mg/g.
2.5. Sensitivity Analysis
In the present investigation, the unit cost of production, unit selling price, and annual production quantity of 87 batches of 360 liters which is approximately 31320 liters of biodiesel per year were used as inputs in a sensitivity analysis to evaluate their effects on profit or loss. To demonstrate yearly profit or loss for biodiesel production, an income statement was generated in Microsoft Excel, as presented in Table 2, displaying all revenue and expenses which include, the production cost, marketing and advertisement, taxation, and wages. The maintenance or depreciation of equipment does not form part of the income statement during the first year of production. In addition, business advertising and networking was also assumed to be achieved through social media platforms resulting in the use of electronic advertising through websites, Facebook pages and
Table 2. Income statement and sensitivity analysis for used cooking oil biodiesel production.
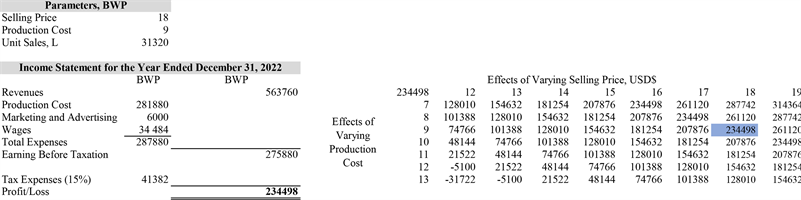
YouTube. As such, the authors assumed the cost of marketing and advertising to be around BWP 6000 (USD 484.59) per year which mainly, includes the website page design and maintenance cost. Several authors including [30] [31] reported that approximately 1% of a business’s social media followers (people who have engaged the firm’s advertisements) really engage a business’s site. As a result, regularly producing better advertising content for social media that helps achieve greater market reach and engagement is critical when using this new marketing approach.
To generate the income statement, the annual wage was set to BWP 34,483.32 (USD 2785.02) for two employees, while the government tax was set at 15%. The wages bill and the 15% government corporate tax were based on the government Income Tax Act Chapter 52:01 Section 59 and levies of 15% on manufacturing companies. All these parameters were used to calculate the profit or loss.
The profit determined from the income statement was transferred to the sensitivity table, demonstrated by Table 2 to analysis its sensitivity to varying selling price per unit and unit cost of production. The various anticipated values of unit selling price and unit production cost were then utilized to show how altering them in ascending and descending order from current prices of BWP 9 (USD 0.72) unit production cost and BWP 18 (USD 1.41) unit selling price can affect profit or loss. The sensitivity analysis showed what happened to profit during biodiesel production when the unit selling price as well as unit production cost is increased or decreased from BWP 12 to BWP 18 and BWP 7 to BWP 13 respectively. Following that, the determined profit value is highlighted in the sensitivity table to demonstrate its position and corresponding selling price per unit, as well as unit cost of production.
2.6. Cost to Capacity Analysis
The authors used a scale factor of one to demonstrate the estimated construction cost of approximately 5500 liters per month plant which translate to approximately 66,000 liters per years. The study employed already known pilot scale plant capacity of 31,320 liters per year as well as construction cost of BWP 400,000 (USD 32,305.69) to determine the building costs of scaled up plant capacity of 66000 liters per year. The sensitivity analysis was also carried out in similar manner to the study pilot scale plant capacity of 31,320 liters per year, however the unit sales were increased to 66,000 liters per year while the expenses except tax levy remained constant. The study calculated the investment cost (machine cost, installation costs and labour cost) for increasing biodiesel production using the Equation (1) cost to capacity analysis.
(1)
where:
C2 = Estimated cost of plant 2 with capacity Q2;
C1 = Known cost of BWP 400,000 (USD 32,305.69) for plant 1 with capacity Q1;
Q2 = Known capacity of 66,000 liters per year for plant 2;
Q1 = Known capacity of 31,320 liters per year for plant 1;
x = Scale factor of 1 for Facility 2 and 1.
3. Presentation of Results and Discussion
The purpose of the study was to establish the economic viability of biodiesel production and commercialization. This section contains a comprehensive description of the results of the data obtained throughout production to show its cost effectiveness.
The authors performed a comprehensive economic analysis to determine the unit cost of producing approximately 360 litres of biodiesel using used cooking oil as feed-oil. The feed-oil was collected within the Greater Gaborone City. The results are presented as follows: Figures 4-7 3.1 to 3.4, present input costs, percentage contribution, and expected revenue per batch. Figure 8 provide summary on electrical energy consumed during each stage of biodiesel production. In addition, Table 3 and Table 4 present a sensitivity analysis of annual profit or loss for two plant capacities of, 31,320 and 6,6000 litres per year. Equation (1) depicts the cost to capacity analysis which demonstrates the projected construction cost for increasing plant capacity from 31,320 to 66,000 litres per year. The expected payback period for 31,320 litres per year plant capacity is also presented.
The data in Figure 4 should be viewed in parallel with the one in Figure 5, which shows percentage contribution of biodiesel production inputs. The data in Figure 4 shows that feed-oil (used cooking oil) is the most expensive input to the production of biodiesel, accounting for approximately 61% of the overall cost, followed by methanol with 19% then direct labour with 13%, as demonstrated by Figure 5. Although the percentage contribution by feed-oil appears to
![]()
Figure 4. Production Input Costs in (BWP) and (USD) of Used Cooking Oil biodiesel production.
![]()
Figure 5. Showing the total percentage contribution of biodiesel production inputs.
agree with percentage reported by pervious authors [2] [9] [10] included, it is the view of the authors that in the context of Botswana, once the biodiesel production is fully established in the country, the percentage contribution of used cooking oil and methanol are likely to reduce. The observation is because currently, all used cooking oil collected in the country is exported due to lack of local market for the product. Available data indicate that during the 2018-2019 period, approximately 393.39 tonnes per year of used collecting oil was collected and exported. The results in Figure 4 reveal that the overall input cost of producing approximately 360 liters of biodiesel using used cooking oil as feed-oil and using Bio-Pro 380 EX biodiesel reactor is approximately BWP 3297.65. This is equivalent to U$D 280.81 per batch, with electrical energy contributing only 2% of the overall cost as demonstrated by Figure 5. The unit cost of production for a single batch of 360 liters biodiesel is calculated to be BWP 9 per liter (USD 0.72 per liter). The calculated unit production cost was then used as basic line data to perform the sensitivity analysis depicted in Table 3.
The results in Figure 6 demonstrate the expected revenue which is likely to be generated from the production of 360 liters of biodiesel using biodiesel reactor (Bio-Prob 380 EX), when used cooking oil is the feed-oil. The current unit price (pump price) of a liter of petroleum diesel in Gaborone City at the time of investigation was BWP 17.92, which is equivalent to approximately U$D 1.41. If the same pump price is used for 360 liters of biodiesel, this will generate a revenue of BWP 6451.2 (USD 508.52), against the total production of BPW 3297.65 (U$D 280.81), thus approximately 49% profit margin. The findings are consistent with previous research by [5] [32] [33] [34] which suggests that biodiesel production will become cost effective as the cost of petroleum diesel increases. The results are also in line with [35] which suggest an average return of approximately 36.1%.
Furthermore, considering the cost of feedstock shown in Figure 4 and the expected revenue of biodiesel demonstrated by Figure 6, the overall results suggest revenue increase by approximately 69%. The results therefore appear to suggest that under the current economic situation where the petroleum diesel pump price is BWP 17.92 per liter, there is corresponding increase in the economic case to produce biodiesel at commercial scale in Botswana utilizing resources such as using used cooking oil. Since available data indicates that the unit price of biodiesel is currently cost-competitive with the price of petroleum diesel demonstrating a 50% difference. These results are consistent with numerous researchers [36] included showed that with approximately 40% increase in diesel pump price biodiesel production is economically feasible.
The results in Figure 7 and Figure 8 depict cost of energy recorded during different stages of biodiesel production. The two figures should also be viewed in
![]()
Figure 6. Showing expected revenue from biodiesel outputs per batch.
![]()
Figure 7. Showing energy cost of producing a batch of biodiesel using the BioPro 380 EX.
![]()
Figure 8. Show percentage contribution of cost of energy during different stages.
parallel. The results show total energy cost of BWP 55.51 (U$D 4.48), with base catalyzed and acid catalyzed transesterification processes accounting for 28% and 23% respectively as presented by Figure 8. Similarly, the drying, heating, and washing processes account for approximately 22%, 18% and 9% of total energy cost respectively. However, it is important to note that considering all the inputs costs, energy account for only 2% as demonstrated by Figure 5. It is appropriate therefore to conclude that Bio-Pro 380 EX reactor is relatively a low energy intensity biodiesel reactor, suitable for low scale biodiesel production.
As mentioned earlier, the authors performed sensitivity analysis to examine how the difference in production cost per unit and selling price per unit affects profit and loss. For sensitivity analysis, the unit selling price of BWP 18 was used. The data in Table 3 shows that, if the unit selling price is maintained at BWP 18 and the unit production cost is varied from BWP 7 (USD 0.57) to BWP 13 (USD 1.05), the profit value is expected to reduce by an average of approximately 12% per unit price increase. However, if the production cost per unit is maintained at BWP 9 (USD 0.72) and the selling price per unit increases from BWP 13 to BWP 18 (USD 1.45), the profit value is expected to rise by an average of about 13% per unit price increase. The analysis demonstrated that the unit production cost is inversely proportional to profit while the selling price per unit is directly proportional to profit. The results are consistent with several authors [37] [38] [39] included who demonstrated that sensitivity analysis has a significant impact on assessing the effects of applying a certain action throughout a process. As a result, its use is critical in the decision-making process.
The information in Table 3 should also be viewed in conjunction with the data in Table 3 & Table 4, which demonstrates the sensitivity analysis of the proposed plant capacity of 66 000 liters per year. The data in Table 3 and Table 4 shows that, increasing plant capacity from 31,320 to 66,000 liters per year results in a profit increase of approximately 53%, assuming unit production costs of BWP 9 and unit selling prices of BWP 18. The tables also indicates that when
![]()
Table 3. Sensitivity analysis on yearly Profit and Loss for pilot scale plant
![]()
Table 4. Sensitivity analysis on yearly Profit and Loss for large scale plant
unit production costs are equal to or greater than the unit selling price, a loss is projected due to operating expenses surpassing operating income. In this case, the total revenue equals the total production cost, but the additional expenses such as wages, marketing, and advertisement result in a net loss.
According to the cost to capacity analysis, Equation (1) increasing biodiesel production from roughly 31,320 liters per year to approximately 66,000 liters per year will cost approximately 53% more. The results also show that the cost of building two small-scale plants is roughly the same as that of building one large-scale plant. However, operating two small plants is less efficient than a large plant.
(1)
The feasibility of biodiesel production is a very important factor which was considered in the present investigation. However, the focus was only on payback period, sensitivity, and cost to capacity analysis. In the present investigation, payback period was performed based only on the expected total revenue generated from sales as demonstrated by the data in Figure 6 and the overall plant construction cost which includes cost of biodiesel reactor (Bio Pro 380 EX) and plant installation cost. Based on biodiesel production processes, described under Section 2.2, the overall production time for a batch is 3 days, making approximately 87 batches per year considering 261 days of production in a year. The total cost of biodiesel reactor was BWP 400,000.00 (USD 32,305.69) and the production input cost as well as the expected revenue per batch is demonstrated by Figure 4 and Figure 6 respectively. Thus, the net yearly cash flow is BWP 274,359, (USD 21,562.51) therefore expected payback period for biodiesel production using used cooking oil as feed-oil was determined to be.
(2)
where:
A represents the Initial investment in Botswana Pula;
B represents the Net yearly cash flow in Botswana Pula.
The expected payback period is 1.5 years this means that it takes approximately 1 year and 6 months to recover the initial investment on the cost of machine. The results are consistent with [40] [41], which demonstrated that the payback period is determined by the annual net cash flow. To demonstrate the economic feasibility of upscaling biodiesel production from 31,320 to 66,000 liters per year the authors calculated the payback period for a 66,000 liters per year plant. The authors assumed the same number of batches 87 were produced in a year, at the same unit production cost of BWP 9 and selling price per unit BWP 17.92 Therefore, the total cash inflow and outflow was calculated to be BWP 1,182,720 and BWP 594,000 respectively. As a result, the yearly net cash flow was determined to be approximately BWP 588,720. The determined construction cost for a large capacity plant of BWP 842,912 obtained from equation (1) was used as initial investment cost, hence payback period was estimated to be at least 1.4 years. The results demonstrated that the payback period for a large plant 66,000 liters per year is 1 months shorter than the small plant capacity. These results agree with the ones discussed by [5] [12] [13] [16] which affirm that large scale plant capacity is more profitable than small scale plant capacity.
4. Conclusion
The authors performed economic assessment of producing biodiesel at pilot scale using used cooking oil as feed-oil. The investigation revealed that among all input costs, feed-oil is the most expensive contributing 61% followed by methanol accounting for 19% then direct labour with 13%, and energy accounting for only 2%. Despite all these, the investigation revealed that the production of biodiesel using used cooking oil at pilot scale is economically feasible, further suggesting viability of biodiesel production at commercial scale in Botswana. The investigation demonstrated relatively low payback period of 1.5 years suggesting viability of biodiesel production in the country. The available data also indicates that the price of biodiesel is currently cost-competitive with the price of petroleum diesel demonstrating a 50% difference. The percentage difference is expected to continue increasing as petroleum diesel prices rise with time. Additionally, the study revealed that the profit or loss is 13% and 12% sensitivity to BWP 1 price variation in either the unit selling price or production cost per unit, respectively. Furthermore, the study revealed that increasing biodiesel production costs approximately 53% more, with an expected increase or decrease on profit or loss of at least 53% per year. A further assessment of increasing plant capacity revealed that the payback period for a large plant capacity is 1 month shorter than a small plant capacity. As a result, investing in a large capacity plant is more cost effective than a small plant capacity.