Obesity and High Blood Pressure among Professional Long-Distance Drivers in Yaoundé, Cameroon: Cross-Sectional Study ()
1. Introduction
Growing evidence suggests that High Blood Pressure (HBP) and obesity are significant public health problems around the world and are the basis of the cardiovascular disease epidemic. These two pathologies have become a major health problem due to major changes in lifestyles, population aging, urbanization, and socio-economic changes. A sedentary lifestyle is one of the risk factors for these diseases, hence professional drivers who sit for long periods during their activity could be at risk of developing HBP or obesity. The associated impacts could not only be dangerous for the driver’s health but can also endanger other user of these transportation services.
Globally, about 57% to 87% of truck and bus drivers are overweight or obese, and obesity-associated comorbidities such as HBP, dyslipidemia, and type 2 diabetes are common among this occupational group [1].
According to the Ghana Metro Mass Transit in 2010, long-distance drivers are professional drivers who regularly cover 140 km or more [2]. These drivers by nature of their work leave home early in the morning and return late in the evening or even return the next day. As a result of their work schedule, and irregular sleeping habits, these drivers are stressed at the end of the day [2]. In addition, these drivers are physically inactive because their work is more sedentary and most of them make no effort to exercise when not working [3]. The occupational health of drivers has a significant impact on public safety [4].
In a city in Korea, according to Shin, et al. (2013), 53.9% of drivers had a body mass index (BMI) greater than or equal to 25 kg/m2, 40.9% had a waist circumference greater than or equal to 90 cm, with a prevalence of 53.3% of HBP [5]. Studies in Canada and the United States suggest that some of the crashes (less than 5%) involving a commercial vehicle can be attributed to cardiovascular disease [6]. In the United States, the prevalence of cardiovascular diseases is also high among the population of long-distance drivers with an associated 69% of prevalence of obesity and 51% smoking among drivers [7]. The work of Sangaleti et al., (2014) on cardiovascular disease risk factors among truckers in Brazil has shown a prevalence of 72.8% among drivers with physical inactivity; 66.8% among alcohol consumers; 19.2% among systematic users of certain types of stimulants during work activities; and 29% among smokers [8]. In India, the results of the study by Chankaramangalam et al., (2017), on factors associated with HBP in truck drivers show that the prevalence of overweight was 50% and the prevalence of HBP was 40% [9].
In Nigeria, in 2015, the prevalence of HBP was 33.5% and was associated with a body mass index greater than 25 kg/m2 and an age greater than 40 years [10]. In Ghana, the studies reported in 2013 a high prevalence of overweight (36.5%), obesity (14.2%), high fasting blood sugar (72.5%) and high-density lipoprotein (8.8%), diastolic (22.4%), and systolic (21.2%) HBP levels. The proportion of drivers who drank alcohol was then 45.9% and 64.7% had a low level of physical activity. Only 8.8% had the desirable level of high-density lipoproteins [2].
In Cameroon, several studies have been carried out on the risk factors of cardiovascular diseases such as obesity and HBP focused on adolescents, the military personnel, workers of six companies in the city of Douala, and the comparison between urban and rural areas. Through the studies of Sobngwi et al. (2002); Nkondjock and Bizome, (2010), Fouda et al., (2012); Kingue et al., (2015) [11] [12] [13] [14], epidemiological data on obesity and HBP in the workplace are insufficient, especially among long-distance drivers in Cameroon. It is based on all the above that we thought it useful to conduct this study to determine the prevalence and risk factors of obesity and HBP among professional long-distance drivers in Yaoundé.
2. Materials and Methods
2.1. Study Design
This was an analytical cross-sectional study and data collection took place over a period of two months, from March to April 2018. The target and the study population were made up of professional drivers working for a transport company, stationed in Yaoundé, and serving the various capital cities of the Littoral, West, East, South, North-West, and South-West regions.
2.2. Study Population
Our target population consisted of all professional drivers in Cameroon, working for a transport company based in Yaoundé and serving the various capital cities of the Littoral, West, East, South, North-West and South-West regions.
Were included in our study, any drivers: working in a transport company and consenting to fill out the study questionnaire. The criteria for exclusion were drivers who were absent at the time of the investigation.
2.3. Sampling
Lorentz’s formula was used to calculate the minimum sample size with the prevalence of 24.2% of HBP/obesity in the driver population reported in a study by Heckel, (2013) [2], with a 95% confidence level and a 5% margin of error. The minimum size thus calculated was 282 participants. To factor in non-response and increase statistical power, we added 10%, so we surveyed 310 drivers.
We used cluster sampling. All the transport agencies serving the Littoral, East, West, South, North-West, and South-West regions formed our cluster. Then using the file of Mfoundi division (Centre Region of Cameroon) travel companies obtained from the Ministry of Transport, we grouped the different transport companies serving the same region. Due to the absence of information on the number of drivers per transportation company, we surveyed a total of 70 transportation agencies depending on the destinations.
2.4. Collection of Data
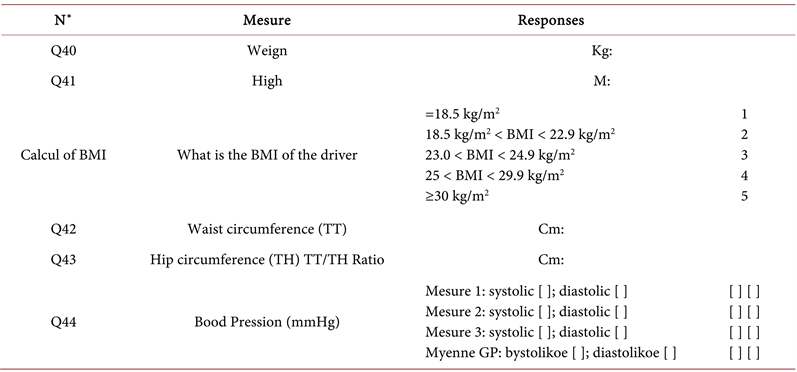
The data was collected through the administration of a questionnaire (face-to-face, and read and filled by investigators) that we developed and pre-tested, made up of several sections: 1) socio-professional characteristics; 2) eating habits; 3) lifestyle, including physical activity and the consumption of alcohol, tobacco; 4) anthropometric measurements, including weight, height, and blood pressure.
These measurements were made using standard methods including electronic blood pressure monitors; calibrated and verified scales for weight measurements.
Anthropometric measures: 1) The weight was measured in Kg (RobustaTM by Seca®, capacity: 200 Kg) by using a calibrated and verified electronic scale. The person to be weighed stood upright, without shoes or heavy clothes and without moving until the weight was recorded. 2) The height was measured by an adult scale Stadiometer (210 cm), the person stood straight, with stable and flat feet on the stadiometer.
Body Mass Index (BMI): BMI was calculated as the ratio of weight (in kilograms) to the square of height (in meters). Subjects with a BMI > 30 Kg/m2 were considered obese [15].
Blood pressure: Measured with a CBOKANG BK6002 automatic digital electronic cuff blood pressure monitor. Expressed in Millimeters of Mercury, this BP made it possible to classify the figures of blood pressure. Electronic blood pressure recording was performed with the subject resting for at least 10 minutes in a seated position and with the right arm maintained at the heart level. Arterial blood pressure measurements were taken by the same observer and repeated three times in a row in the participants in a seated position while respecting the interval of 3 minutes per measurement. Any driver with either systolic blood pressure ≥ 140 mm Hg and/or diastolic blood pressure ≥ 90 mmHg or any driver diagnosed with HBP by a clinician or under treatment for HBP was considered hypertensive [16].
2.5. Data Processing and Analysis
Two types of data analysis methods were performed namely descriptive methods and explanatory methods. Descriptive analysis was done with univariate analysis, bivariate analysis, and multiple correspondence factor analysis at the descriptive multivariate level. The explanatory analysis was performed with binomial logistic regression, considering the dichotomous nature of the dependent variable. As tools, four types of data analysis software were used. These are SPSS 21, STATA 13, SPAD 5.5, and Excel. The first software cited made it possible to do the flat sorting of the variables, their recoding, the bivariate analysis and to transfer the data to STATA. The later software made it possible to compute the binomial logistic regression model. SPAD software was used to describe the profile of obese or hypertensive drivers. The Excel software made it possible to draw the tables and graphs.
2.6. Ethical Consideration
This study obtained administrative authorization from the Minister of Transport and received ethical clearance from the Institutional Ethics Committee for Research for Human Health (CEIRSH) of the Catholic University of Central Africa (Ref. No2017/00631/CEIRSH/ESS/MSP).
3. Results
3.1. Socio-Professional Characteristics of Drivers
Out of a total of 309 drivers whose data was analyzed (Table 1), the most represented age group was that of 31 - 40 years (45.63%); the majority (83.82%) of drivers had a secondary education level, and the proportion of drivers with a higher level of education was almost zero, at 0.32%. Most drivers (94.5%) had seniority of 5 years and more in the field of transport. Almost half (48.87%) of drivers estimated that they average between 240 - 340 km per day; 37.86% traveled at least one 440 km trip. More than half of the participants (58.58%) say they make an average of one trip per day and 41.42% underline an average of 2 trips per day. The minimum travel time was estimated between 2 h to 4 h by 5.50% of drivers and the maximum duration estimated by 68.93% was between 4 - 6 h.
The measurement of obesity and HBP according to socio-professional characteristics by the Body Mass Index and Blood Pressure measurements showed that, 27.18% of drivers were obese while 17.80% had HBP. Age group (p = 0.017), longevity of professional service (p < 0.001), time spent on the trip (p = 0.009) were significantly associated with obesity at the 5% and 1% threshold. Furthermore, only the age group (p = 0.009) and professional length (p = 0.005) variables are significantly associated with the 1% threshold for blood pressure (Table 1).
3.2. Influence of Socio-Professional Variables, Eating Habits and Lifestyle on the Occurrence of Obesity and HBP
Professional seniority influences the occurrence of obesity in drivers at a threshold of 5% (p = 0.002). Regardless of body mass index or blood pressure, age group, level of study, the average daily distance traveled, the average number of trips per day and to some extent, the time took on the journey (considering the 5% threshold) does not discriminate in terms of risk of obesity/HBP among
![]()
Table 1. Distribution of drivers according to socio-professional variables.
** significance threshold of 5%; *** significance threshold of 1%; ns: not significant.
drivers between the different categories (Table 2). The longevity of professional service influences the occurrence of obesity in drivers at a threshold of 5% (p = 0.002). The risk of obesity is 3.99 (95% CI 1.65 - 9.64); 14.57 (95% CI 3.65 - 58.16) and 15.23 (95% CI 3.30 - 70.40) times higher in drivers with a professional experience of 10 - 14 years, 15 - 19 years and 20 years respectively and over compared to their counterparts whose seniority dates from 5 - 9 years (Table 2).
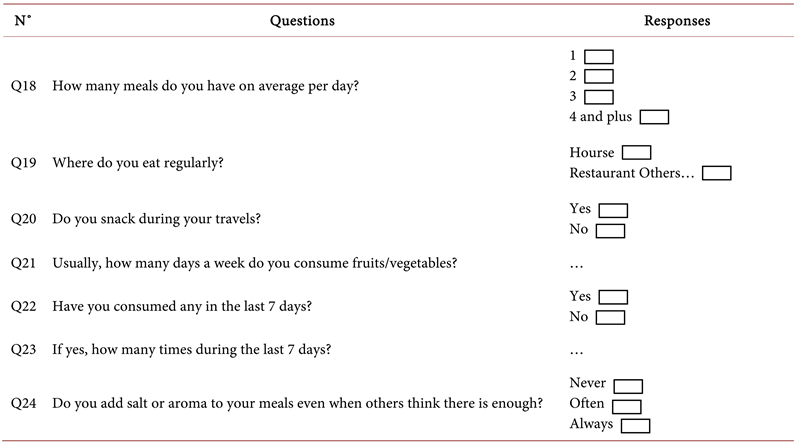
Among 309 drivers, more than half (59.22%) of drivers ate an average of 1 to 2 meals per day, and 40.78% said they consumed three meals on average. As a result, 87.06% ate in restaurants. More than half (64.40%) of drivers admitted that they snack on the trip; 2.59% claimed they never add salt or flavoring to meals. All the variables related to eating habits (the number of meals on average per day, the place of consumption of the meal, snacking during travel, adding salt or flavoring to the meal) influence obesity among drivers at the 1% threshold (p < 0.001). Moreover, only consumption of snacks during travel (p = 0.026) influences the 5% threshold for blood pressure (Table 2). The measurement of obesity and HBP according to drivers’ eating habits showed that, the number of meals on average/day (p < 0.001), the place of consumption (p < 0.001), snacking during the trips (p < 0.001), and the addition of salt/flavoring in the meal (p = 0.007) were significantly associated with the body mass index in drivers at the 1% threshold. Age (p = 0.022), snacking while traveling (p = 0.0008) are significantly associated with blood pressure, unlike the case of body mass index (Table 2).
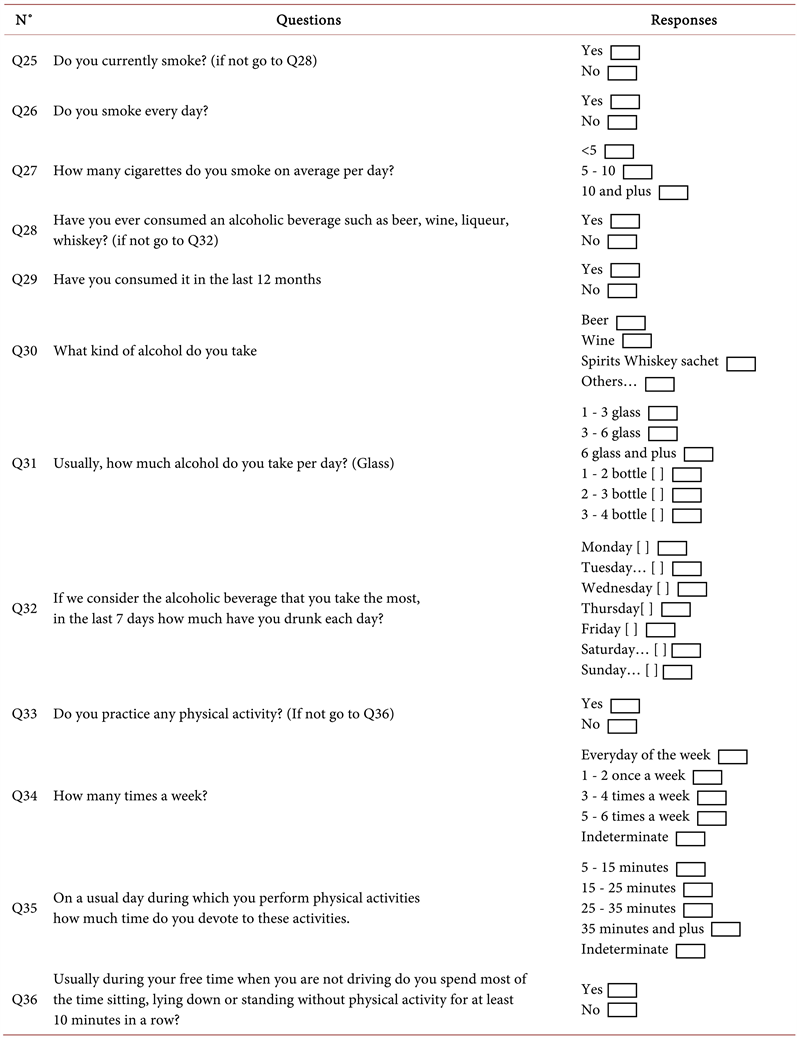
The proportion of drivers who declared themselves to be smokers is not negligible, that is 27.18%. Among these smokers, 26.21% took at least 5 cigarettes per day. A large majority of drivers (87.06%) reported consuming alcoholic beverages and when they do, they take 1 to 2 bottles (43.04%); or 3 to 4 bottles (29.13%). In the context of physical exercise, a high proportion of drivers (57.93%) declared not to practice any physical exercise or sports and only 22.33% of drivers do so once or twice a week. Those who practiced any sports spent between 15 - 24 min (27.18%). 64.72% of drivers reported making trips of at least 10 minutes on foot or by bicycle. We also noticed that the non-response rate was high (>10%) for questions exploring the time spent in a sporting activity, the number of times/weeks spent practicing a sporting activity, the amount of alcohol consumed, and the number of cigarettes per day. About 78.6% of respondents said they were unaware that their job exposes them to obesity and HBP. All lifestyle variables influence the occurrence of obesity in drivers at the 5% threshold, except making trips of at least 10 minutes on foot or by bicycle. Only the consumption of alcoholic beverages (p = 0.01), making journeys of at least 10 minutes on foot or by bicycle (p = 0.035) significantly influence the occurrence of HBP in drivers (Table 2). The measurement of obesity and HBP by driver’s lifestyle showed that, smoking (p = 0.024), consumption of alcoholic beverages (p = 0.025), the practice of sports activity (p < 0.001), making trips of at least 10 minutes on foot (p < 0.001) were significantly associated with a high body mass index (Table 2).
![]()
Table 2. Association between lifestyle, eating habits, socio-professional factors and obesity/high blood pressure among drivers.
*** significance threshold of 1%; ** significance threshold of 5%; * significance threshold of 10%; ns: not significant.
3.3. Measurement of the Association between High Blood Pressure and Obesity
Blood pressure and body mass index was significantly associated with the 1% threshold (p < 0.001). HBP is observed more among obese drivers (34.5%) than when the latter have a normal body mass index (11.6%). The body mass index significantly influences the occurrence of HBP in bus drivers at a threshold of 5%. The explanatory multivariate analysis revealed the net effect of the variables in the presence of the other variables. Obesity and HBP among drivers were commonly influenced by socio-professional type variables (professional longevity or seniority), variables linked to eating habits (consumption of snacks during trips), and much more by variables linked to the mode of life of the latter (the practice of sporting activity, and making trips of at least 10 minutes on foot or by bike). On the other hand, in the case of obesity, it is the number of meals on average per day, adding salt or flavoring to the meal, smoking, the consumption of alcoholic beverages, the place of consumption that has a significant influence. In the case of HBP, only obesity has an influence (Table 3).
4. Discussion
This study found that the prevalence of obesity and HBP among bus drivers was 27.18% and 17.80%, respectively. Regarding the prevalence of obesity, it is close to the results observed in the study by Caban, et al., (2005) [17]. In their comparative study of obesity between several occupational groups, the authors observed that drivers had a higher prevalence than other professionals in other fields (31.7%). The prevalence of obesity in this study is also close to that of Kunsoan (2016) [18]. According to the author, among the factors associated with road traffic accidents on the Yaoundé-Douala highway, obesity was included with a 28.4% obesity rate reported. In the study by Sangaleti, et al. (2014) [8], the authors obtained an obesity prevalence of 30% among truckers. On the other hand, the prevalence of obesity observed in our study differs from that of the studies by Shin et al. (2013), Sieber et al. (2014) in the United States, Chankaramangalam et al. (2017) in India, and that of Heckel (2013) in Ghana. These authors in their studies obtained a prevalence of overweight and obesity of
![]()
Table 3. Association between HBP and obesity.
*** significance threshold of 1%.
53.9%; 69%; 50% and 14.2% respectively. The difference with the results of Shin et al., (2013) in Korea, could be explained by the fact that the study population these authors were mostly older (59.1% of them were included in the 50 - 59 years age) than our population (45.63% of drivers aged between 31 - 40 years). Also, these authors combined overweight and obesity while we have broken down the BMI thresholds into two categories namely normal and obese [2] [5] [7] [9].
The prevalence of HBP in our study was 17.8%. This prevalence is like that of the study by Satheesh & Veena, (2013) which in their work whose objective was to determine the prevalence of HBP among transport bus drivers had indeed observed a prevalence of 16% [19]. The 40 and over age group was the most affected. The prevalence in this age group was 23.95%. These results tend to agree with Chobanian et al. (2003). According to these authors, HBP affects all age groups and becomes expensive from the age of 40 [20].
Furthermore, our result observed concerning the prevalence of HBP differs from that of Priya & Sathya, (2015). In a cross-sectional study, they indicated a prevalence of 35% [21]. This can be explained through the age group with which these authors have worked. Indeed, in their work, the authors had set criteria for including drivers who were at least 50 years old. This also means that these drivers had professional seniority compared to our study population and therefore were likely to be hypertensive compared to our study population.
In the present study, the age group most represented in the sample of drivers identified were those in the 31 - 40 age group (45.63%). This age group is like that of the study by Heckel (2013) in Ghana [2]. Drivers’ educational backgrounds varied and consisted of elementary, secondary, and higher education. The dominant educational profile in this study was that of secondary school. Furthermore, 83.82% of drivers had a high school education level. This observation is like that of Heckel (2013) [2].
In bivariate analysis, the results show the association between age, the longevity of professional service, number of hours of driving, and obesity. In terms of age, the 41 - 50 years and 51 - 60 years age groups were more at risk than their counterparts in the 20 - 30 and 31 - 40 age groups. This result is further supported by the fact that BMI is related to age. Indeed, the more the age increases the more the individual is likely to become obese. The same is true for professional seniority. Our results show that longevity of professional service is associated with obesity in bivariate analysis. The bivariate analysis results also show an association between longevity of professional service, the number of hours of driving per day, and obesity. Drivers who drove 4 to 6 hours were more exposed than their colleagues who made trips of 6 to 8 hours of driving. This could be explained by the fact that drivers doing 4 to 6 hours of driving exercise mainly on the Yaoundé-Douala axis and can make an average of two trips per day. Those who spend more time driving are more sedentary compared to drivers who make 6-to-8-hour trips for an average of one trip per day. Heckel, (2013) in his study also obtained similar results. Indeed, it has been observed that the more time a driver spends driving the more likely he is to be obese [2].
According to the results of the bivariate analysis, age group, work tenure, and time spent traveling was significantly associated with obesity and HBP. But in the explanatory multivariate analysis, only longevity of professional service showed statistical significance. That is to say that there are intermediate variables in the relationship between age; the time spent on the journey and the two dependent variables (Obesity and HBP). Therefore, the only socio-professional characteristic that interests us at this level is the longevity of professional service, which is statistically significant for both obesity and HBP.
However, the difference between drivers with professional seniority of 10 - 14 years and 5 - 9 years is significant at the 5% level. The difference observed between the various other categories is significant at the 1% level. The longer the years of driving, the greater the risk of developing obesity, which can be explained by the accumulation during these years of body fat because of inactivity. Indeed, it is the same observation that emerges from the study of Ragland et al. 1997 in San Francisco. In their study, the authors found that the prevalence of obesity increased with years of driving [22]. The same conclusion emerges from the study by Heckel (2013) [2].
The HBP is 3.64 (95% CI 1.22 - 10.85); 5.08 (95% CI 1.18 - 21.92) and 9.42 (95% CI 1.87 - 47.44) times higher respectively in drivers with a duration of experience which goes back respectively to 10 - 14 years, 15 - 19 years, 20 years and over than among counterparts whose professional seniority is less than 5 years. The difference observed between the various categories is significant. This implies, as in the case of obesity, that prolonged employment in a transportation company as a driver may be associated with HBP. A similar profile was observed by Ragland, et al., 1997), these authors conducted a study on the relationship between work tenure and HBP among drivers in the city of San Francisco, Brazil [22]. The data collected inform us that drivers with professional seniority of 20 years and more were more hypertensive than other age groups. This observation aligns with what was observed in our study.
Regarding the various variables related to eating habits, only snacking was associated with both obesity and HBP. Other variables related to eating habits—the number of meals per day, adding flavor or salt to meals, and where the meals were eaten were associated only with obesity. Analysis of the logistic regression table shows an 80% (RR = 0.20%; 95% CI 0.09 - 0.43) risk reduction of obesity in drivers who do not have the habit of snacking while traveling compared to those who snack. For blood pressure, the risk of HBP is lower when drivers do not snack while traveling (OR = 0.43; 95% CI 0.21 - 0.90). Heckel (2013) observed in his study that snacking by drivers was common behavior and was associated with obesity [2]. This observation is consistent with the conclusions of Gill & Wijk, (2004); Escoto, et al. (2010) in Sweden and the USA respectively who claim that these foods are mostly high in calories and salt, which can lead to obesity or HBP [23] [24]. By referring to the HBM (Health Belief Model) we understand that these drivers do not have enough knowledge about the fact that snacking between meals, coupled with the sedentary nature of their professional activity, exposes them to weight gain. The answer to the question “do you know that the nature of your profession exposes you to excessive weight gain?” further enabled us to understand this lack of knowledge expressed by the HBM about the actions that drivers can take to prevent excessive weight gain. According to our results, only 21.4% answered yes. Thus, these drivers do not perceive their professional activity and snacking as a threat to excessive weight gain.
The study showed that obesity is associated with the number of meals eaten per day, instead of eating those meals and adding salt or flavorings to the meals. When a driver eats at least 3 meals per day, the risk of being obese is 5.75 times (95% CI 3.15 - 10.48) higher compared to those who consume 1 to 2 meals per day. Within the context of the place of consumption, the risk of being obese decreased by 95% CI (0.01 - 0.36) when drivers regularly consume meals at home than those who regularly consume meals in restaurants. When it comes to adding salt or flavoring to meals, drivers often adopting this type of eating habits have 1.01 times (0.55 - 1.84) higher risk of being obese than those that do not add salt or flavor to meals. These results are explained and agree with the studies of Heckel, (2013) in Ghana [2], of Grimes, Bolhuis, He, & Nowson, (2016) in Australia [25] and Fouda, et al., (2012) in Cameroon [13]. Indeed, according to the authors, foods from fast-food restaurants and restaurants are generally high in saturated fat and salt. In addition, some of these drivers despite the sedentary nature of their professional activity consume three or more meals a day. In this sense, due to irregular hours of work, the last meal is usually eaten very late in the night resulting in obesity. In addition, Grimes, et al. (2016) demonstrated in their study on the relationship between dietary sodium intake and overweight/obesity in children and adults that there was a link between excessive salt intake and the occurrence of obesity [25].
Different ways of living could influence the onset of obesity and HBP. In this study, the results of the multivariate analysis showed us a statistical significance between the practice of physical activity, walking, the consumption of alcoholic beverages, the consumption of cigarettes, and the occurrence of obesity and/or HBP. We note that only the practice of sports activity and the fact of making trips for at least 10 minutes on foot or by bicycle influences both the occurrence of obesity and HBP. Alcohol and cigarette consumption specifically influence the onset of the risk of obesity
In Cameroon Sobngwi et al. (2002) carried out a study on the relationship between the practice of physical activity and obesity, HBP, and diabetes in urban and rural areas in Cameroon [11]. They showed that physical inactivity was significantly associated with HBP and obesity in men in both urban and rural areas. Bita et al., (2013] in a cross-sectional study on the epidemiology of HBP in the workplace in Douala, Cameroon, noted the non-practice of physical and sports activities as a risk factor of HBP in these occupational groups [26]. This observation further confirms our results, which show that when a driver is unable to make trips of at least 10 minutes on foot or at cycling, he is 3.84 times more likely to be obese than those who can do so. Indeed, the more physical exercise carried out by the driver, the less they run the risk of being obese (RR = 0, 46; CI 0.24 - 0.88) compared to those who do not. For HBP, drivers who exercise run a 62% (95% CI 0.18 - 0.82) less risk of being hypertensive compared to their counterparts who do not. On the other hand, the risk of being hypertensive is 1.96 (95% CI 1.05 - 3.67) higher among drivers who are unable to walk or cycle at least 10 minutes compared to their counterparts who can.
Physical inactivity is a characteristic of drivers. Indeed, the prevalence of this behavior in our study is 58%, which is like the study by Sui et al. (2012) who detected that 56% of the 3397 drivers surveyed were physically inactive [27]. The Heckel study shows similar results; 64.7% of drivers had a low level of physical activity, which was positively associated with obesity and HBP.
In addition, Forrest et al. (2001), in a cross-sectional study conducted among 799 adults in Benin-City in Nigeria, also showed that the time of physical activity, particularly that devoted to walking and transporting by bicycle for work was inversely correlated with body mass index [28]. From these observations and by referring to the theory of HBM, we find that professional drivers do not measure the risk for the occurrence of pathologies such as obesity and HBP related to the sedentary nature of their activity. They do not perceive this threat to their health therefore do not adopt measures to reduce or limit this vulnerability during their free time or when they go to the place of services, hence this high prevalence of physical inactivity.
In this study, we did not assess the level of alcoholic beverage consumption, we collected information on whether alcoholic beverages were consumed to analyze their links with obesity and HBP. Thus, drivers who consumed alcohol were twice as likely (95% CI 0.83 - 4.83) to be hypertensive than those who did not. In terms of obesity, drivers who do not consume alcoholic beverages compared to those who do, are 64% (95% CI 0.13 - 1.00) less likely to be at risk of obesity. Similar results were found in studies by Heckel (2013), in a group of bus drivers in Ghana and Fouda, et al., (2012), in a group of workers in Douala [2] [13]. In Ghana, alcohol use among drivers was associated with obesity [13]. The study by Nunez, et al. (2009) also confirms this observation. Indeed, the authors carried out a study on alcohol consumption and the incidence of HBP in a Mediterranean cohort. The risk of HBP was 1.28 (95% CI 1.06 - 2) times in people who drank alcohol at least 5 times per week compared to those who abstained [29]. Our results with respect to this variable show that the risk of obesity is less sustained (RR = 0.95; 95% CI 0.51 - 1.77) in drivers who smoke cigarettes than in those who do not consume it. In a study by Dare, Mackay, & Pell, (2015) examining the relationship between cigarette smoking and obesity, the authors observed that overall, smokers were less likely to be obese than those who had never smoked (adjusted OR 0.83 95% CI 0.81 - 0.86) [30].
The risk of HBP is 4.04 times higher (95% CI 2.20 - 7.41) in drivers with a very high body mass index (obesity) than on average (normal). This result is similar to that of Heckel (2013), Erhiano, et al., (2015) (Fouda, et al., 2012); (Satheesh & Veena, 2013); (Kingue, et al., 2015) respectively in Ghana, Nigeria, Cameroon, India, and Cameroon [2] [10] [13] [14] [19].
5. Conclusion
Obesity and HBP are risk factors for non-communicable diseases, especially cardiovascular disease, thus constituting a global public health problem. The study aimed to determine the risk factors for obesity and HBP among professional drivers of intercity buses stationed in Yaoundé. Analysis of the data documented the prevalence of obesity and HBP as 27.18% and 17.80% respectively. Likewise, the study highlights socio-professional factors such as professional seniority; the age and number of hours of travel to reach the destination; factors related to eating habits and lifestyle; as factors that may increase the risk of obesity and/or HBP. Obesity is associated with the number of meals per day; the place of consumption of meals; snacking; adding salt to meals; Alcohol consumption; cigarette; the practice of sporting activity; walking or cycling for at least 10 minutes. HBP is associated with snacking; Alcohol consumption; walking or cycling for at least 10 minutes; and obesity. The results of this study should help improve the health of drivers and thus prevent the onset of chronic diseases. In addition, public health actions aimed at health promotion, prevention, and early detection of HBP and obesity must target the population of drivers being a population at risk for the occurrence of cardiovascular diseases.
Acknowledgements
The authors thank the transport companies who volunteered to participate in the study.
Annex: Questionnaires
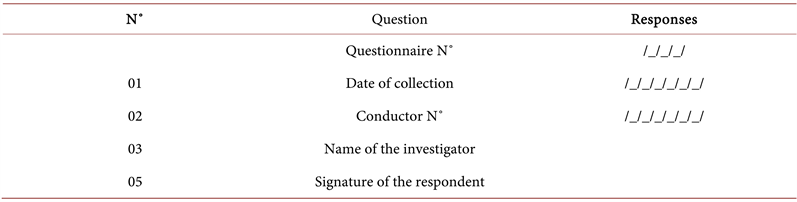
Module N˚0: General information
Module N˚1: Socio-professional characteristics (Driving history)


Module N˚2: Eating habits
Module N˚3: Lyfe style
Module N˚4: Anthropometric measurements