Image Acquisition and Parameter Calculations for Optimization of the Automatic Identification of Terpenes in a Combined Laser Thin Film Extract ()
1. Introduction
In African countries and particularly in Ivory Coast, traditional medicine has become the only source of affordable and accessible care, especially for the poorest patients [1]. This medicine mainly uses therapies made from the leaves of plants. A study by Kadja et al. showed that these leaves contain thousands of secondary metabolites including terpenes responsible for improving men’s health. This is why, as part of the scientific development of this medicine and in order to provide it with assistance, researchers in the field of natural substances are directing their research towards the identification of secondary metabolites, in particular terpenes contained in the leaves of plants using a thin layer method [2]. However, this identification is done manually in a slow and laborious way [3].
The challenge facing experts in the identification of thin-film compounds is to make it faster through several methods including the one based on the frontal ratio of thin-film compounds [3]. However, the work of Datté et al., 2008 presented two different terpenes but with the same frontal relationship. One of the terpenes corresponds to limonenes and the other to pinenes. This work shows that it is not reliable to recognize compounds only from frontal ratios.
In order to overcome these shortcomings, it is therefore necessary to resort to other methods based on digital image processing.
Image processing is a feature of signal processing, the objective of which is the transformation of digital images, with the aim of improving their quality and/or extracting information from them. In the field of digital image processing, segmentation plays a major role. It consists in extracting image primitives, either of contour type or of region type [4]. These primitives are used to perform pattern recognition, matching, compression, etc. Classification segmentation consists of partitioning a set of vector attribute pixels into k disjoint classes. Each class groups pixels with characteristics as similar as possible [5]. Indeed, the pixels of a region having an average value per channel in RGB greater than a certain value (threshold) T1 and less than a second value T2 are classified as object recognition pixels which can be used for the identification of the secondary metabolite.
The approach to the automatic identification of secondary metabolites (terpenes) that we propose in this article, based on segmentation by digital image regions incorporating the terpenes to be identified, is an extension of the automatic identification of secondary metabolites. It is based on image acquisition, sampling and quantization of images using Dirac’s two-dimensional comb.
Parameters such as the average pixel color on each channel, color entropy on each channel, standard deviation, equivalent distance, etc. different regions are calculated. The values obtained are stored and constitute a database. From this database, an algorithm is developed and executed on Matlab version 2016 software [6], thus enabling the identification to be carried out automatically and quickly.
For the understanding of this work, the document is organized as follows: in Section 1, we present photochemical screening and image acquisition integrating terpenes, scanning, filtering these images and calculating parameters, then in Section 2 we present the results of the different parameters calculated on the channels, finally in Section 3, a theoretical and experimental validation of our approach is presented. We conclude with some prospects for future work.
2. Materials and Methods
2.1. Material
2.1.1. Chemical Reagents and Apparatus
All chemicals used are of analytical grade. The solvents and reagents used were purchased commercially from Polychimie (Ivory Coast). For the separation of secondary metabolites on a thin layer, we made use of chromatoplates (thin layers) in silica gel 60 F254 on an aluminum support.
The different devices used for our analysis are as follows:
• A RETSCH brand electric grinder, type SM 100;
• A Sartorius brand scale (Germany);
• A Burchi RII rotary evaporator;
• A magnetic stirrer;
• A UV-Visible spectrophotometer;
• A camera;
• Spatial resolution: 2448 × 3264 (8 M pixels);
• Tonal resolution: 24 bit (color);
• Color space: RGB;
• Camera model: Infinix;
• Focal: F/2;
• Exposure time: 1/13 seconds;
• ISO sensitivity: ISO-864;
• Focal length: 4 mm;
• Image format: JPG image;
• UV lamp (366 nm, 254 nm).
2.1.2. Plant Material
The plant organs, mainly composed of leaves, were all harvested from the forest relic at Nangui Abrogoua University in Côte d’Ivoire (Figure 1).
The plant species were identified in accordance with the herbaria available at the Center National de Floristique (CNF).
2.2. Methods
2.2.1. Selective Extraction of Secondary Metabolites
The hydromethanolic extracts of the different leaves were treated with 3 × 20 ml of hexane, chloroform, ethyl acetate and n-butanol, respectively. The different organic fractions were concentrated under reduced pressure on a rotary evaporator and then stored in the refrigerator. Thus, for each crude extract, selective extracts are obtained distributed as follows: hexanes, chloroforms, ethyl acetates and n-butanolics which were used for the phytochemical screening.
2.2.2. Photochemical Screening, Image Acquisition and Digitization
The photochemical screening was carried out according to the analytical procedures described in the works of [7] and [8].
Drops of each selective extract are applied using a capillary on the points (01 cm from each other) of the baseline drawn 1 cm from the bottom of the thin layers (silicage 60 F254).
The deposits are left to dry for a moment before introducing the thin layers into the chromatography tank containing the migration solvent. After migration and drying with a hair dryer, the chrotograms are revealed with reagents specific to the desired phytochemical groups, then visualized in the visible light and then under a UV lamp at 366 nm (Figure 2). The different developing systems used are:
• Hexane/AcOEt (20:4; v/v) for the hexane fractions;
• CHCl3/AcOEt/hexane (10:10:5; v/v/v) for the chloroform fractions;
• AcOEt/CH3OH/H2O/CHCl3 (18:2.4:2.1:6; v/v/v/v) for the ethyl acetate fractions.
We used, to improve the image quality, the relation [9]:
(1)
• Sxyλ is the capture of the image transmitted by the sample on the plate;
• Rxyλ is the capture of the image of the empty plate; so-called reference measurement;
• Bxyλ is the capture of the image by obstructing the passage of light: a measure known as background noise.
![]()
Figure 1. (a) Ageratum conyzoides Linn, (b) Leaves of Morinda lucida (L.), (c) Leaves of alchornea.
![]()
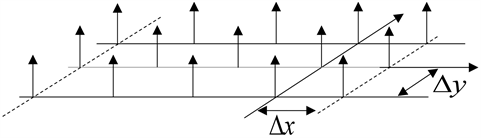
Figure 2. Schematic drawing of thin layer image acquisition.
Scanning is performed using Dirac’s two-dimensional comb-
and the relation of intesity is given the relation [9]:
(2)
: Intensity associated with the pixel (m, n) and quantized over a number of bits q;
: Step sampling in the direction X;
: Step sampling in the direction Y;
: Dirac comb 2D.
2.2.3. Improvement of Segmented Regions and Filtering
f is the image to filter (or enhance) and g the spatial filter, we have the relation [10] [11]:
(3)
G is the filter transfer function. Since the digital image is essentially discrete (pixels and grayscale), we have presented the filter in the discrete case. On each digital image, we did not do a global convolution but a local transformation based on the neighborhood of a point (x, y) (Figure 3).
Image enhancement was also achieved through the median filter. In Figure 4 we present the original image and the improved image.
3. Results and Discussions
3.1. Acquisition of Images on the Thin Film
For each extract, we obtained digital images on the thin layers. Figure 5 shows some of the images obtained.
3.2. Parameter Calculations
Figures 6-8 illustrate the segmentations of the different spots of the images used. Finally, we have created a database with the values of the parameters of each task (region). The spots corresponding to terpenes previously are identified by the manual identification technique based on the developers.
We segmented each spot of the images in Figure 5, we then calculated the average color, standard deviation, color entropy using the algorithms encoded in the Matlab 2016 version run under Microsoft Windows 10 pro on a PC based on Intel i3.
![]()
Figure 3. Local convolution of the digital image.
![]()
Figure 4. (a) Original image (b) improved image.
![]()
Figure 5. (a) Chromatogram under UV at 366 nm, (b) UV chromatogram at 366 nm of hexan extracts.
• Average pixel color
Each spot on the thin film is a digital grayscale image and an array of values. Each cell of this array, which stores a value, is a pixel. By noting n the number of lines and p the number of columns in the image, we thus manipulate an array of n × p pixels. Figure 6, left, shows a visualization of a square table with n = p = 240, which represents 240 × 240 = 57,600 pixels. For an image, we can therefore calculate the average color Ie of pixels characterizing this image.
Algorithm (a) below calculates the average pixel color of the spots (Figure 7).
![]()
Figure 7. (a), (b) Segmentation of spots under UV 366 nm corresponding to families of molecules (a’), (b’) Segmented spots of molecule families.
![]() (a)
(a)![]() (b)
(b)![]() (c)
(c)
Figure 8. (a) Average color as a function of the molecules of the fractions; (b) Standard deviation as a function of the molecules of the fractions; (c) Color entropy as a function of the molecules of the fractions.
b=imshow (im1);
im2=rgb2gray (im1);
h=imfreehand; (a)
bw=createMask (h, b);
figure,imshow (bw);
ht=regionprops (bw, im2, 'MeanIntensity');
at=ht.MeanIntensity.
• Standard deviation (std)
The standard deviation is given by the relation [12]:
(4)
Algorithm (b) below calculates the standard deviation of the spots (Figure 7).
b=imshow (im3);
im2=rgb2gray (im3);
h=imfreehand;
bw=createMask (h,b);
figure,imshow (bw); (b)
ht=regionprops (bw, im2, 'PixelValues');
ap=ht.PixelValues;
s=std (double(ap)).
• Entropy
The entropy is given by the relation [13]:
(5)
Algorithm (c) below calculates the average pixel color of the spots (Figure 7).
b=imshow (im4);
im2=rgb2gray ( im4);
h=imfreehand;
bw=createMask (h, b);
figure,imshow (bw); (c)
ht=regionprops (bw, im2, 'PixelValues');
ap=ht.PixelValues;
E=entropy (ap).
3.3. Parameter Values
For a stain on the thin layer, we identify the corresponding terpene by the traditional method using developers and for this stain parameters are calculated constituting a database and corresponding to this terpene. The parameter values for the terpenes are given in Tables 1-4.
In order to show whether the properties of a molecule (terpene) are the same for the different fractions, we have represented the values of the properties according to the molecules. Figures 8(a)-(c) represent the average pixel color of the terpenes of the four fractions, the standard deviation of the four fractions, and the color entropy of the molecules of the four fractions, respectively.
![]()
Table 1. Parameter values of the terpenes of the hexane fraction.
![]()
Table 2. Parameter values of the terpenes of the chloroform fraction.
![]()
Table 3. Parameter values of the terpenes of the ethyl acetate fraction.
![]()
Table 4. Parameter values of the terpenes of the n-butanol fraction.
From the different values of the parameters of the four (04) fractions, that is to say the hexane, chloroform, ethyl acetate and n-butanol fractions shown in Tables 1-4 we have obtained curves. Figure 8(a) corresponds to the representation of the average color of the spots resulting from these four fractions as a function of the molecules. This figure allows us to affirm that the value of the mean color does not depend on the fraction, the curves of the fractions being almost superimposed. Figure 8(b) corresponds to the representation of the standard deviation of the spots resulting from these four fractions showing the similarity between the values of the standard deviation, the curves being almost coincident. The same observation is made in Figure 8(c) corresponding to the representation of entropy as a function of molecules. Figures 8(a)-(c) allow us to show that the identification of the molecules corresponding to the spots does not depend on the fraction.
The different representations show a quasi-superposition of the different curves of the hexane fraction, chloroform fraction, ethyl acetate fraction and n-butanol fraction. The gap between the different curves is reduced compared to the gap between the curves when we isolate the spots by considering the actual contours of the spots.
The results allow us to conclude that if the isolation is done closer to the center of the spots, the values of the properties are practically identical for the different fractions. Thus the spots incorporating the terpenes will have the same parameter values if we isolate the spots closer to the center of it.
3.4. Development of the Identification Program
For the different fractions, the parameters have the same values, so this allows us to develop the identification program below (Figure 9).
We verified the presence of terpenes, in particular linalool, in the hexane fraction of the leaves of Solenostemon monostachyus.
The manual thin-layer identification protocol being the same, we segmented the different spots on the thin layer (Figure 10). We then calculated the various parameters including color entropy (Entropy), standard deviation (std) and average pixel color (MeanIntensity). We obtained the results shown in Table 4.
These values correspond to terpenes in the database.
The distance used to recognize objects in the image is the Euclidean distance, defined for two vectors
and
de
by the relation [14]:
(6)
which has values in
,
or
and are called respectively real, rational or discrete distances. The normalized value of the Euclidean distance is given by the relation [14]:
![]()
Figure 9. Molecular identification program.
![]()
Figure 10. (a): Segmentation of the first task, (b) second task, (c) third task, (d) fourth task, (e) fifth task; (a’): First segmented spot, (b’) second segmented spot, (c’) third segmented spot, (d’) fourth segmented spot, (e ’) fifth segmented spot.
(7)
allowing decisions to be made from the coordinates of vectors in a database.
The values of the average color of the pixels, the standard deviation of each component, the entropy per color component of the four fractions of the compounds are given in Table 5.
Table 5 confirms the presence of pinenes, limonenes, linalool, terpenes, in the leaves of Solenostemon monostachyus. For example we have the values of the average color (atR = 91.20; atG = 114.5; atB = 213.21), of standard deviation (sR = 1.58; sG = 3.52; sB = 2.62), of entropy (HR = 2.51; HG = 2.14; HB = 2.47) which correspond to the values of the parameters of Linalool. Values (atR = 74.14; atG = 87.21; atB = 75.89), of entropy (HR = 6.08; HG = 4.12; HB = 4.80). These values identify the Pipenes in the leaves of Solenostemonn monostachyus. These terpenes have already been identified by the traditional method with the same plant in the work of [15]. These results thus show the reliability and robustness of our identification approach and its simplicity in its implementation.
3.5. Discussion
The automated identification of thin-layer terpenes that we performed on digital images allowed us to identify a few molecules present in a hexane, chloroform, ethyl acetate and n-butanol extract. However, values of the average color (atR = 87.01; atG = 41.05; atB = 54.01) do not match the values for terpenes in the database. This could be explained on the one hand by the noise due to stray lights during the acquisition of the images, on the other hand to the limit of our database which does not contain enough molecules, it will therefore be necessary to enrich this database to take into account several molecules (terpenes).
![]()
Table 5. Values of the leaf segmentation parameters of Solenostemon monostachyus.
4. Conclusions
We have presented a new technique for identifying terpenes on a thin film based on image segmentation and the calculation of segmentation parameters such as color entropy, standard deviation and average pixel color. Our method shows quite satisfactory results were compared with the results of the manual technique made from the developers and the UV lamp 366 nm and 254 nm. The results of this comparison showed a similarity between the terpenes obtained. This shows the reliability and robustness of our technique.
In our next work, it will be a question of designing an electronic device coupled to a computer allowing to automatically calculating the color entropy, the average color of the pixels and the standard deviation of each spot in order to identify the terpenes.