Analysis of Vegetation Index of Protected Forests in Akwa Ibom State, Nigeria between 2000 and 2021 ()

1. Introduction
The Earth’s terrestrial ecosystems rely heavily on vegetation for water, energy exchange, and the biogeochemical cycles of the planet’s land surfaces [1] [2] [3]. A wide range of ecological processes, from the local to the regional to the global scales, are profoundly influenced by vegetation [4] [5] [6] [7] [8]. The NDVI (normalized difference vegetation index) is sensitive to phenology [9] and is often used as the best indicator of vegetation growth and coverage change [10]. The NDVI has also been widely used in the study of vegetation changes at different scales [11] [12].
Nigeria is blessed with several biodiversity hotspots with Akwa Ibom State as one of the states in the Niger Delta with such potential [13] [14] [15] [16]. More simply, a biodiversity hotspot can be defined as a region with very large concentrations of plant species that are natives in the area but with increasing rates of habitat loss [17]. Coastal areas are indispensable biodiversity areas that are very useful internationally [9]. These regions are known to have delicate environments with profitable fauna and flora species used for sustenance, medicine, fuel, development and other different uses [2].
Protected forests or areas are geographical regions where human activities are severely limited by legislation in order to improve biodiversity conservation [18]. [19] defined it in terms of her functional roles and provision of services, which include support (ecosystem life-cycle maintenance, forest stability through seed disposal mechanisms), regulatory (climate regulation by promoting carbon sink and storage of other greenhouse gases, erosion and soil fertility regulation), cultural (agricultural heritage, archaeological and religious heritage), and provisioning services in terms of food supply, agro-forestry, and fuel. The protection of biodiversity, long-term protection of our natural resources for the sake of food security, health, tourism, academic research, and the provision of ecological services and cultural values are some of the goals outlined in [20].
It is suspected that the establishment of institutions like the Oil Minerals Areas Producing Commission (OMPADEC) of 1992 by the Federal Government of Nigeria, Niger Delta Development Commission (NDDC) which was created in 2000 by the act of Parliament and the Ministry of Niger Delta Affairs of 2008 leading to massive constructions of roads, housing schemes, canalization, dredging, land reclamation and shoreline protection, has caused great and severe damage to the natural environment and protected forest areas of the state than imagined. Also worthy of note is the fact that several activities like hunting and wood gathering as well as that of oil multinationals have impacted the protected forest areas in one way or the other.
Thus, monitoring and assessment of these protected forest areas are important for better forest management and conservation. The vegetation index is one of the most useful and used indexes to quickly identify vegetated areas with the use of multispectral remote sensing data [21]. NDVI has higher sensitivity corresponding with crown density change than other vegetation indexes [10]. Therefore, with the aid of Geographic Information System (GIS) and Remote Sensing technologies using the NDVI function of relevant software for vegetation assessment has proven useful in recent times. The studies by [9] and [22] on land use and land cover change in Akwa Ibom State have also provided guidance on the methods of data collection, data processing and analyses that will lead to vegetation assessment in relation to land use. Forest cover can be estimated using the Normalised Difference Vegetation Index (NDVI) from satellite data. Therefore, the study focused on the assessment of protected forest areas in Akwa Ibom State using the vegetation index of three-time series MODIS imageries between the year 2000 and the year 2021. Thus, are there changes in the vegetation index of protected forest cover areas between the year 2000 and the year 2021? What are the change estimates in vegetation index and associated impacts?
2. Materials and Methods
2.1. Description of the Study Area
The study was carried out in Akwa Ibom State, Nigeria. The study area is found in the latitudes between 4˚32'N, 5˚33'N and Longitudes between 7˚25'E, 8˚25'E (Figure 1). The study area is situated in the equatorial tropical region and as a result the climate is typically that of the humid tropics with rainfall in all months of the year [23]. The study area enjoys two distinct seasons, the wet and the dry, with the longer duration in favour of the wet season which last for about ten to eleven months [24]. The rainfall pattern exhibits double maxima, with the little dry season in August [23] [24]. The mean annual rainfall is about 3000 mm [25]. Temperature is relatively stable with day temperatures fluctuating between 27˚C and 33˚C, while night temperatures seldom fall below 15˚C [23]. Relative humidity except for the short period of dry season remains at an average of 70% to 80% throughout the year [23] [26]. Cloud Cover phenomenon is prevalent within SCFR and the entire Niger Delta region, especially during the rainy season [23] because of its nearness to the equator with an elevated level of Particulate Matters and black soot due to anthropogenic activities [27]. The Forest Reserve is noted with its mangrove swamp forests, freshwater swamp forests, rainforest, and sandy coastal ridge barriers [23]. It’s also endowed with abundant Oil and Gas reserves that have attracted many Marginal Field Operators like the Universal Energy Resources Limited, the Frontier Oil Ltd. and Network E & P into the area [23] [28].
2.2. Data Acquisition and Analytical Procedure
The Terra & Aqua products combination of Moderate Resolution Imaging
![]()
Figure 1. The study area (Akwa Ibom State).
Spectra-radiometer (MODIS) imagery datasets for the year 2000, 2017 and that of 2021 free from cloud cover were acquired from https://earthexplorer.usgs.gov website to enhance the evaluation of Vegetation Health of the Study Area using the Normalized Difference Vegetation Index (NDVI) mapping. The MODIS data aboard the Terra & Aqua satellite was considered for the study because of the cloud and snow cover free algorithm of the satellite to enhance accuracy and better quality of vegetation mapping as against the usage of alone product that may not achieve the accurate mapping results [29] [30]. The temporal resolution for the three time series MODIS images was 16 days with high spectral resolution which is very important for vegetation mapping while the spatial resolution was 250 m. The NDVI function programmed into the GIS or Remote Sensing software has a non-linear function that varies between −1 and +1 values defined by the ratio of NIR − R and NIR + R where NIR stands for the Near Infrared band while R represents the Red band captured from the invisible and the visible region of the electromagnetic spectrum respectively [31]. The higher the NDVI values of any vegetation, the healthier the vegetation status of the land cover and the lesser the NDVI values, the poorer the vegetation quality of the land cover whereas the negative values shows that the area is not vegetated at all such as the barren land, built-up areas and those covered by snow or cloud [32].
All the satellite datasets were acquired within the second week of December 2000, first week of January 2017 and second week of December 2021 (all time periods were dry season) to ensure land cover uniformity and classification since the health status of vegetation is always very sensitive to seasonal changes. A site visit to all the identified protected forests areas using the Global Positioning System (GPS) to acquire relevant co-ordinates that enhanced effective ground truthing were carried out for the study. The time period spent for site visits and geo-rectification of protected forest areas in Akwa Ibom State were between two-three months. A total of 22 protected forest areas, some with extensions which cut across different communities and managed either by Government as reserves or by community within the 31 LGAs (Table 1 & Plates 1-3), were identified in Akwa Ibom State.
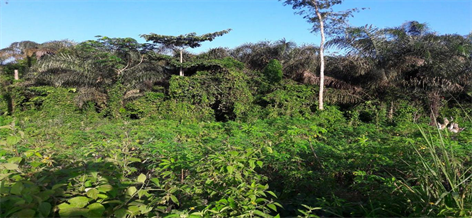
Plate 1. Stubb creek forest reserve encroached by farming operation in Esit Eket.
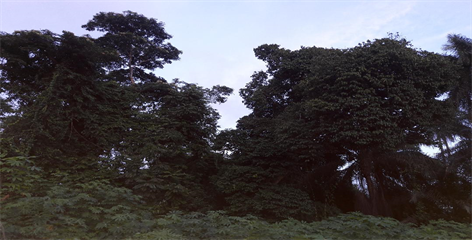
Plate 2. Usaka Annang community protected forest, Obot Akara LGA.

Plate 3. Community protected forest, Uya-Oron, UrueOffong/Oruko LGA.
![]()
Table 1. Protected forest areas in Akwa Ibom State.
*SC: Stubbs Creek; FE: Forest Extension which extends to another LGA.
2.3. Data Analysis for Vegetation Health Status Evaluation
This involves the importation of acquired MODIS imageries into the ArcGIS 10.5 software stored in a large capacity computer memory to process the imageries in order to evaluate the health status of the identified forests in Akwa Ibom State during the study period.
The imported dataset of the acquired imageries with associated bounding co-ordinates were imported into the ArcGIS 10.5 environment and geo-referenced to the World Geodetic System (WGS 84), Mina datum and the Universal Transverse Mercator (UTM 32) zone where protected forests are situated. This was to ensure that the land cover classification and analysis using the satellite imageries was in line with real life co-ordinates. The image datasets were later subjected to necessary geometric and radiometric corrections using appropriate functions of the ArcGIS 10.5 software to ensure proper orientation and screening of pixel co-ordinates as well as check spectral reflectance anomalies to enhance accurate land cover classification.
Thereafter, the field coordinates saved with the Microsoft Excel was imported into ArcGIS 10.5 environment and overlaid it on the processed 2000, 2017 and 2021 MODIS images with the imported Akwa Ibom State shapefile to guide in the identification and delineation of boundaries of the respective Local Government Areas. The NDVI values of forests in each LGA for the three time series imageries were extracted using the Spatial Researchers Tool and navigate it to the Zonal statistical functions of the software to show the minimum, maximum, mean and standard deviation of the NDVI values for the determination of the vegetation health of the forests.
3. Results of the Analysis
The original mean NDVI values generated from the processed maps in Figures 2-4 labelled maximum (High) values and minimum (low) values and depicted with green and red colors respectively were multiplied by 0.0001 as a factor to scale the NDVI value to range from −1 to +1 [14] as shown in Tables 2-4.
3.1. Vegetation Health in Protected Forests for the Year 2000
The vegetation index computed for protected forests in the year 2000 is displayed on Table 2 and Figure 2. The vegetation index range of the protected forests was between −1999 and +9958 with a lowest minimum value showing red pigment of 0.0363 and a highest maximum value with green pigment of 0.9891. Vegetation index of each protected forests varied considerably as highest and lowest mean values were 0.6996 and 0.4694.
3.2. Vegetation Health in Protected Forests for the Year 2017
The vegetation index computed for protected forests in the year 2017 is displayed on Table 3 and Figure 3. The vegetation index range of the protected forests was between −259 and +6076 with a lowest minimum value of 0.3669 and a
![]()
Table 2. NDVI for protected forest in the year 2000.
ID: identification number; Min: Minimum; Max: Maximum; STD: Standard deviation.
![]()
Table 3. NDVI for protected forest in the year 2017.
![]()
Table 4. NDVI for protected forest in the year 2021.
highest maximum value of 0.5563. The vegetation index of each protected forests also varied considerably in the year 2017. The highest and lowest mean values were 0.5310 and 0.4217.
3.3. Vegetation Health in Protected Forests for the Year 2021
The vegetation index computed for protected forests in 2021 is displayed on Table 4 and Figure 4. The vegetation index range of the protected forests for the year 2021 had the lowest minimum value of 0.2503 and a highest maximum value of 0.4631. The study also discovered that the vegetation health index of each identified protected forests varied considerably in 2021. The NDVI analysis recorded highest mean value of 0.4183 and a lowest mean value of 0.2953.
3.4. General Vegetation Health of Protected Forests in 2000, 2017 and 2021
The general analysis of vegetation health of protected forests for the year 2000,
![]()
Figure 2. Vegetation health of protected forests in Akwa Ibom State in the year 2000.
2017 and 2021 is revealed in Table 5 below. It is shown that the vegetation health in 2000 (Table 2) above ranged from 0.155 and 0.878 with mean value of 0.616. In 2017 (Table 3), the vegetation health ranged from 0.415 to 0.513 with a mean value of 0.464; while in 2021 (Table 4) the vegetation health ranged from 0.302 to 0.394 with a mean value of 0.348. This analysis showed that vegetation health in the protected forest areas in Akwa Ibom State had consistently depreciated or degraded over time during the study period. It was thereafter revealed (Table 6) that vegetation health in the protected forests varied (F = 246.064; p ≤ 0.05) among the year considered (2000, 2017 and 2021). The vegetation index analysis therefore showed that the vegetation in the Protected Forest areas were highest in 2000.
![]()
Figure 3. Vegetation health of protected forests in Akwa Ibom State in the year 2017.
![]()
Table 5. General vegetation health of protected forests in Akwa Ibom State from 2000 to 2021.
Degree of freedom (df) between the three forest vegetation groups; 2000, 2017 & 2021 = 2 derived from (n − 1); df within groups of 28 locations per group = 81. Significant vegetation changes at p = 0.05 as 0.000 was lower than 0.05 probability.
![]()
Figure 4. Vegetation health of protected forests in Akwa Ibom State in the year 2021.
![]()
Table 6. Analysis of variance computed for variation in protected forests between 2000 and 2021.
4. Discussion
The study employed the descriptive statistics in the of form minimum value, maximum value, mean value, and standard deviations on Tables 2-5 were used to explain the results of the vegetation health in relation to the different sizes of protected forest areas in Akwa Ibom State. Inferential statistics of ANOVA analysis was employed to determine the variation in vegetation health of protected forests between 2000 and 2021. Findings showed that there was a reduction in the vegetation health and the size of protected forests areas in Akwa Ibom State between 2000 and 2021. This may be attributed to the rate of increase in deforestation in recent times because of human activities in line with the view of [33] who reported that the sizable area of Stubbs Creek Forest reserve has been degraded because of the anthropogenic activities as well as increased in shoreline erosion in the area as reported by [34]. This reduction in the size of the protected forests as displayed on Table 5 is an indication that some human activities such as farming, construction, oil production and tank farm expansion have impacted on forests areas in Akwa Ibom State overtime [13] [15]. Similarly, according to the Convention on Biological Diversity (2001), people living around forests are in the habit of practicing uncontrolled forest hunting and gathering. Majority of rural communities have used forests resources as sources of income only considering immediate gains and benefits without future sustainable benefits.
Similarly, the observed reduction in the vegetation health as displayed on Figures 2-4 is an indication and reflection in size reduction of the identified protected forests which means that they are currently facing depletion. This undoubtedly will pose severe consequences on environmental sustainability which has been the thrust for the establishment of such forest reserve by the Government/community. The reductions in sizes also mean reduction in ecosystem services provided by these forests covers overtime. Forest reserves provides both tangible and intangible benefits to sustain the environmental balance. The tangible products include wood, leaves, barks, fruits, and seeds while the intangible benefits include soil protection, platform for carbon sink to reduce ozone layer depletion, prediction of global warming & climate change, wildlife management, and water catchment protection [35]. The consequent actions of the oil and gas industries are equally considerable in the loss of vegetation health of protected forest areas in Akwa Ibom State. The activities of the oil and gas industries which can generate and releases hazardous effluents into the environment with related consequences have grave consequences on the vegetation health and status of protected forests in Akwa Ibom State.
5. Conclusion and Recommendation
The thrilling fact revealed by the application of the Normalized Difference Vegetation Index (NDVI) mapping model for the study is that it has provided insight into the status of protected forests in Akwa Ibom State. It has revealed the drastic level of reduction in the size of the forest reserve with the corresponding level of deterioration of their vegetation health, curbing down carbon sink and possibly heightened climate change occurrence. It is also an indication that the goals of establishing such forest reserves by the Government of Akwa Ibom State include: the provision of a platform for carbon sink as contained in vision 2030 Sustainable Development Goal’s objectives of the United Nations, biodiversity enhancer and growth, tourism for economic empowerment and pollution-free environment, which has been defeated. Based on the findings, the study recommended that uncoordinated and expansive hunting and gathering within the protected forests should be checkmated; the activities of the oil and gas industries should be controlled and monitored; stricter laws and guidelines should be put forward to ensure the overall protection of the protected forest areas in Akwa Ibom State; controlled urbanization and land-use model for the 31 LGAs in Akwa Ibom State should be enacted in order to ensure effective land use planning; creation of enlightenment programs directed at educating rural people on the sustainable use of forests resources is paramount to ensuring the management and conservation of the protected forests in Akwa Ibom State.