Vulnerability Assessment to COVID Pandemic in Urban Settlement: A Case Study from India ()
1. Introduction
The COVID-19 pandemic has created devastation in every sphere of human life worldwide. It has led to standing still of the economy (Fong et al., 2020) and social being, and has aggravated life, health, and livelihood vulnerabilities. COVID-19 has pushed humanity into an existential crisis, mainly because it caught us off guard, hindering our ability to fight a global threat of an unprecedented scale. The SARS-COV-2 virus has its burst in one of the prominent urban centres of Wuhan China (Ogen, 2020) from where it has spread across the globe, penetrating indiscriminately through the cities of global north and south. But this pandemic has greater urban orientation, UN-Habitat has also underlined the urban-centric character of this infectious disease (UN-Habitat, 2020). It says, more than 1460 cities are affected by the pandemic in 210 countries and where above 95% of the total cases are located in urban areas. Thus COVID-19 pandemic has had an unprecedented disruptive impact, especially on urban systems. The expansion of the global urban population over the past few decades have increased exposure to infectious diseases and posed new challenges to the control of outbreaks (Acuto, 2020). COVID-19 has exhibited how quickly infectious diseases can spread and expose the vulnerability of every community. Today, urban areas around the world have faced the brunt of the COVID-19 pandemic due to wide-spread international connectivity, the movement of people and goods, and commercial and recreational activities in constricted spaces. Above all denser settlements have proved to be most vulnerable, perhaps due to the lack of social distancing.
Besides in a recent report by the Indian Council of Medical Research, the apex medical body in India, the risk is 1.09 times higher in urban areas and 1.89 times higher in urban slum-like conditions vis-à-vis the rural areas (Swarajya, 2020). The city neighbourhoods that are deprived of civic, hygienic and sanitation services are seemingly more susceptible to the transmission and consequently the more vulnerable. Besides, the faster pace of urbanization in India has led to housing shortfalls and severe stress due to the pan-city of water, electricity and open space. However, the cities across both the north and south divide have felt the diseases induced impact equally. For instance, a global city like New York has been one of the major hotspots of COVID-19, crossed 3.5 million positive cases and has recorded more than 30,000 deaths till 10th June 2020 (The New York Times, 2020). On the other hand, the large metropolis of South Asia, Mumbai, has 51,100 positive cases with 1760 deaths as of June 2020 and has exceeded that of pandemics epicentre, Wuhan (Gupta & Chitnis, 2020). The overall status of the COVID Pandemic in India is such that out of 5000-odd cities, only 30 cities have registered 79% of the total cases (PTI, 2020).
Vulnerability is defined by the United Nations (UN) as “the conditions determined by physical, social, economic and environmental factors or processes that increase the susceptibility of an individual, a community, assets or systems to the impact of hazards”. In the past, the vulnerability was considered a composite factor that has only two dimensions: exposure to risk and susceptibility (Béné, 2009; Chambers, 1989). More recently, (Birkmann et al., 2013) considered fragility and lack of resilience. The degree of vulnerability of a specific community is a human value judgement that strongly influences management decisions (Mclaughlin et al., 2002). In addition, the concept of social vulnerability to environmental hazards involves demographic and socio-economic factors that affect community resilience (Zebardast, 2013), and this is considered a hot topic in current disaster research (Shen et al., 2018). Natural vulnerability factors are related to the indicators of the built-environment. Social vulnerability is a measure of both the sensitivity of a population to natural hazards and its ability to respond to and recover from the impacts of hazards (Cutter & Finch, 2008). Vulnerability to natural hazards is as much based on social inequalities as it is on environmental processes. Both manifest themselves differently on the landscape suggesting a need for a place-based approach to understanding their relationship (Pelling, 2003; Bankoff et al., 2004; GeoHazards International, 2005). The social and economic dimensions are only two dimensions of vulnerability to multiple stress and shocks. These shocks include disasters due to the fragility and susceptibility of human well-being damaged by disruption to individuals’ (physical and mental health) collective social systems (e.g., education, services, health) and their characteristics. Social vulnerability refers to the inability of people, organizations and societies to cope with negative impacts from different stressors to which they are exposed (Eidsvig et al., 2014; Kuhlicke et al., 2011; Qasim et al., 2018). Social vulnerability additionally identifies sensitive populations that are less prepared to respond, cope with and recover from a disaster (Zebardast, 2013), such as low-income populations, women, pregnant women, children under 5 years of age, elderly above 65 years of age (Bereitschaft, 2017a; Zhou et al., 2014), and physically and/or, mentally challenged individuals (Contreras & Kienberger, 2012). Other vulnerable population groups are people with linguistic, cultural and spatial barriers (Eidsvig et al., 2014), such as migrants (Yuan et al., 2019), rural population, people without post-secondary education (Bereitschaft, 2017a; Cutter et al., 2003; Eidsvig et al., 2014), high-density population and public transport captives (Bereitschaft, 2017b).
The concept of social vulnerability is complex and dynamic, changing over time and space and is therefore not easily captured by a single variable (Cutter & Finch, 2008; Zebardast, 2013). To include urban vulnerability assessment into a spatial plan requires strategic, technical, substantial and procedural integration (Hizbaron et al., 2012).
Vulnerability indicators are complex measures of a part of what constitutes a community. Scientific literature has identified groups of social and economic indicators, which when combined with physical land data are useful for vulnerability assessments of communities (King, 2001). The use of these indicators has primarily been applied to the assessment of adaptive capacity and vulnerability (Chen, 2016). According to (Bizimana, 2015) “Vulnerability to natural hazards refers to the conditions determined by physical, social, economic, and environmental factors that increase the susceptibility of a community to hazards”. Vulnerability assessment using a composite index can provide an understanding of real-world situations. The vulnerability index has highlighted environmental and socio-economic backward areas. These areas will suffer more critical problems against of COVID-19 pandemic for their socio-environmental problem. These areas should be given more priority based on the unprivileged population group (Sarkar & Chouhan, 2021).
According to (Jonathan, 2017), India’s urbanization is characterized by an unusually large number of highly populated cities. The high density of population increased the chances of contact with diseased persons (Ruiqi et al., 2018) and consequently, the large metropolitan cities have been the major hotspots of the COVID-19 pandemic.
There is increasing evidence that COVID-19 is an urban crisis. Large metropolitan cities are the COVID hotspots but the threat to small and medium towns was equally high. These second and third tier cities in
India
have been unequal partners in
India
’s urbanization with historically poor investment in infrastructure, planning and governance. Poor water supply, public sanitation, education and healthcare infrastructures combined with local governance deficit make them hotspots of infectious diseases. So based on the above considerations
Aligarh
city was selected for the study and the city is no exception to the realities of the COVID pandemic. The expansion as well as densification of the city, with a large share of the unskilled workforce from different areas, slum population, inadequate water, poor sanitation and housing conditions provokes the vulnerability of COVID-19 spread in Aligarh city (Figure 1). Aligarh is a medium size and densely populated city of North India, which lies between the alluvial plains of river Ganga and Yamuna. Aligarh is the district head quarter which is one of the major cities located in the western part of the state of Uttar Pradesh on the Delhi-Kolkata railway link and historical grand Trunk road. The city is divided into 60 wards, which spread over two distinct parts, i.e., the old city and the (newer) civil lines (Figure 2 and Table 1).
2. Materials and Methods
This study employs secondary data which were taken from different sources like Census of India, Office of Registrar of India, 2011; Urban Development Statistics, Government of India (GOI), 2011-2012; District Level Household and Facility Survey, 2012, Ministry of Health and Family Welfare, GOI; Sample Registration System, Office of Registrar of India, 2013; National Sample Survey Organisation (66th Round, 2009-10 and 68th Round, 2012), Ministry of Labour and Employment, GOI, 2011-2012; Economic Survey, GOI, 2014-2015; Sample Registration System (SRS) Bulletin, Ministry of Home Affairs, 2013; Ministry of Road Transport and Highways, 2012; Open Government Data (OGD) Platform; Department of Statistics and Information Management, Central Water Commission, 2011; Planning Commission, GOI, 2012; Directorate of Economics and Statistics, 2013-2014, Department of Agriculture, Cooperation and Family Welfare, 2015-2016.
![]()
Table 1. Aligarh city: details of municipal wards, 2021.
3. Primary Survey and Data Collection
To understand the vulnerability of Aligarh city in the COVID-19 period, the survey produced a comprehensive dataset about natural vulnerability, built-up vulnerability, social vulnerability and economic vulnerability. As this study focuses to present a comparative analysis of ward wise vulnerability in Aligarh city for pre and post COVID-19 period, thus we largely designed proxy variables to collect data for the same indicators from primary survey. This has helped in measuring and comparing different type’s vulnerabilities in Aligarh city (Box 1).
In this paper, we represented to provide a tool for ward-wise planning and response to the COVID-19 pandemic in
Aligarh
city. We enumerated a set of indices to rank each ward of Aligarh city under five domains-socioeconomic, demographic, hygiene, health system and epidemiological, which make them vulnerable to a natural disaster in general, as well as the COVID-19 epidemic (Box 2). To assess the vulnerability we have used available data from the Census 2011, National sample survey, Aligarh Master Plan, etc.
Vulnerability is often understood as susceptibility to harm, that results from an interaction between the resources available to individuals communities and the life challenges they face. As such, most pre-existing vulnerabilities have been exacerbated by the COVID-19 pandemic.
To develop strategies against vulnerability needs knowledge regarding the social, economic and political factors that trigger the vulnerability and factors helps to build up adaptive capacity.
The present research examines the following four domains, natural environment, built-up environment, social condition and economic which are important in the context of the COVID-19 epidemic vulnerability assessment in Aligarh city, particularly for effective management and mitigation of COVID-19 among Aligarh city residents.
![]()
Figure 2. Municipal wards of Aligarh city.
Box 1. Driving forces for vulnerability status in Aligarh city.
4. Discussion
Vulnerability in urban settlement is related to urban life which is closely associated with components of natural and man-made environment. Environment is the conditions, circumstances and influence under which the system exists. This is influenced, affected or governed by physical, social, cultural, economic and biological components.
The spatial analysis of vulnerability index in different wards of Aligarh city showed distinct pattern which was the outcome of variation in different components of environmental indicators grouped in four main categories of natural, built-up, socio-cultural and economic environment (Box 2).
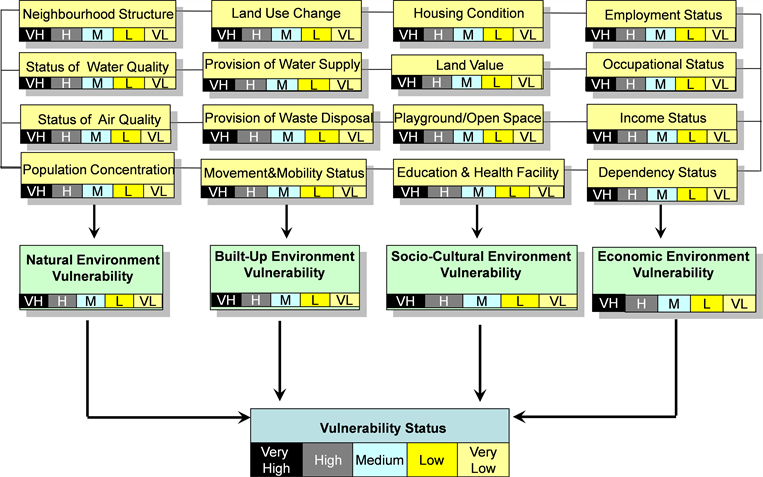
Box 2. Flow chart for evaluating city vulnerability status.
![]()
Table 2. Aligarh city: natural environment vulnerability indicators.
![]()
Figure 3. Aligarh city. Ward-wise natural environment vulnerability status.
1) Natural Environment Vulnerability: Natural environment is one of the important factors in COVID-19 transmission and thus constitute an important domain of vulnerability. Human well-being is linked to the natural environment in myriad ways. To measure this natural environment vulnerability, four indicators are assessed (Table 2 and Figure 3). It includes:
(i) Neighbourhood Structure (ii) Water Quality Status
(iii) Air Quality Status (iv) Concentration of Population.
Neighbourhoods are composed of people who enter, by birth or by chosen residence into common life. The average score for neighbourhood structure in Aligarh city is 0.460. However, it has shown varying patterns. The lower scores are mainly recorded from the wards located in the northern parts of the city like Brahmanpuri, Lekhraj Nagar and ADA Colony due to higher impervious surface, better ventilation and higher share of clean energy consumption. On the contrary, central and southern wards like Nunair Gate recorded higher vulnerability score along with Durga Puri and Bhujpura, etc. There were as many as thirty wards recorded higher vulnerability score than the city average. This clearly indicates the need for proper urban growth utilising the development plans as neighbourhoods located within traditionally poor and ill managed areas of a city impacts its natural surroundings adversely.
Water quality status was measured using source of water supply, storage of water and proportion of population with access to adequate and safe drinking water in the wards. However, it is well documented that growing urban centres leads to the formation of slums, industries with no proper disposal facilities for their effluents and inadequate sewerage systems results in deterioration of water quality. The average score of water quality in
Aligarh
city is 0.416. The wards located in congested areas and without proper sanitation outlets are found to be more vulnerable to COVID-19. This is seen largely in the old part of the city congregated in the south and south western wards. These are Nagla Pala, Sancheri Peth and Badam Nagar. More than half of the total wards reported their water quality scores poorer than the City average.
Air quality status has also become a prominent indicator to measure natural environment vulnerability in the city. With growing cities, increased volume of motorized traffic and air pollution are inevitable. The average air quality score of
Aligarh
city is 0.412. Lower vulnerability scores are recorded from Brahmanpuri, Shivpuri and Begpur, etc. mainly due to lesser concentration of SOx, NOx and particulate matter and presence of relatively cleaner air. However, the wards which showed poorer air quality scores belong to western and south western wards like Bhujpura, Nai Basti and Usman Para, mainly due to the greater presence of household level industrial activities. Overall half of the total wards of the
Aligarh
city especially in the older part had poor air quality.
Cities generate more than 80 per cent of global GDP and their importance for the economy is concentrated on the economies of scale they provide resulting from specialization at the levels of the industry and service sectors as well as facilitating a better matching process between workforce skills and work requirements (UN-Habitat, 2016). Such areas also witnesses higher concentration of population. The city average for population concentration is 0.398. Maximum concentration is seen in the southern and central part of the city which is a hub of various economic activities and is also relatively older than its northern counterpart. The wards which recorded higher population concentration and greater vulnerability to COVID were Jamalpur followed by ADA Colony and Gandhi Nagar mainly due to higher household density, congregation of varying economic activities and percentage of green spaces in these wards is lesser in relation to their population size.
The overall natural environment vulnerability index reveals that wards located in the southern, south western and central part of the city have greater vulnerability to COVID-19. Their scores for all the four indicators, i.e., neighbourhood structure, water quality, air quality and population concentration depict stressed and gloomy situation. The average score for natural environment vulnerability is 0.466. There are a total of 36 wards that are lying below this composite average indicating higher risk to COVID-19.
2) Built-Up Environment Vulnerability: Built-up environment is also an important factor in COVID-19 transmission and thus constitute an important domain of vulnerability. It refers to the vulnerability of man-made surroundings. In this paper, we have tried to assess built-up environment vulnerability using four indicators (Table 3 and Figure 4). These were:
(i) Land use change (ii) Provision of water supply
(iii) Provision of waste disposal (iv) Movement and mobility
The visible outcome of land use change in cities is the spatial expansion of built-up areas (which implies a significant alteration of land use and land cover features), accompanied by changes in the urban spatial structure and the urban form. The average vulnerability score for land use change in
Aligarh
city is 0.369. It is recorded highest from the ward Bhujpura, Nunair gate, Nagla Pala and Khaidora due to higher land conversion, resulting in increased urban density. There were 29 wards with their scores less than the city average, indicating greater land conversions and also greater vulnerability.
Easy and adequate access of water supply and sanitation facilities also determine built-up environment vulnerability in cities. Higher scores for water supply and accessibility was recorded from Durga Puri (0.048), Sancheri Peth (0.078) and Nagla Pala (0.029) due to water scarcity issues experienced by the residents of these wards and also due to poor water supply capacity and coverage, posing greater vulnerability.
Provisions for waste disposal also help in measuring the magnitude of city vulnerability. The average score for waste disposal in the city is 0.396. It is reported lowest from the University area, Lekhraj Nagar and Firdaus Nagar mainly because of availability of proper landfills, waste collection system and effective segregation of waste.
Status of efficient roads and mobility help in meeting society’s need to move freely, gain access, communicate trade and establish relationships. Its average score in
Aligarh
city is 0.40. It is recorded highest from the areas of Nunair gate, Usmanpara, Bhujpura and Khaidora, etc. These higher scores are the result of dense urban roads, easy access to mobility services and intermodal connectivity there, but leading to greater and unrestricted movement, creating greater vulnerability.
![]()
Table 3. Aligarh city: built environment vulnerability indicators.
![]()
Figure 4. Aligarh city. Ward-wise built environment vulnerability status.
The overall built-up environment vulnerability index shows that eastern, northern and north western wards are less vulnerable while southern and centrally located wards are more prone to COVID-19 due to their poor scores for land use, water supply, waste disposal and status of roads and mobility. Its average score is 0.441.
3) Social Environment Vulnerability: Social vulnerability is related to the moral susceptibility of certain social groups or society to potential risks or losses caused by extremes events like COVID-19. The social environment or sociocultural milieu refers to the immediate physical and social setting in which people live (Table 4 and Figure 5). For measuring social environment vulnerability, we selected:
(i) Housing condition (ii) Land value
(iii) Playground/Open spaces (iv) Education and Health facility
Housing is a major element of people's material living standards. It is a composite of various elements like type of houses, material used, availability of toilet, bathroom and kitchen facility within the premises, availability of assets, etc. The average score of housing condition in Aligarh city is 0.400. It is recorded lowest
![]()
Table 4. Aligarh city: social cultural environment vulnerability indicators.
![]()
Figure 5. Aligarh city. Ward-wise socio-cultural environment vulnerability status.
from the ADA Colony, Awas Vikas, Sudamapuri, Zohrabag, etc. Whereas, Jwalapuri, Kala mahal and nunair gate had higher vulnerability due to congested and poor housing condition.
Land value is the amount of money that a piece of land, along with the property contained on it, is priced at. The average land value in the city is 0.410. It is recorded highest from the ward Manikchowk, Jamalpur, Nagla Pala, Nunair Gate mainly due to land scarcity, population pressure, land valuation, markets and land availability.
Access to open spaces and playgrounds also exhibits richness of social environment. However, the area under this land use is continuously declining. Its average score from
Aligarh
city is 0.403. The wards which recorded poorer scores for open spaces are Jamalpur, Kala Mahal and Nunair Gate because of decreasing open space, green space and vegetative cover from these wards. There are 29 wards which reported their scores lesser than the city average.
Education and health facilities form the basic building block of social environment. Its average score in
Aligarh
city is 0.411. The wards which performed better for this indicator are Avas Vikas followed by Brahmanpuri and University area mainly due to easy and effective access to education and health facilities including both private and government schools and colleges, community health centres,
![]()
Table 5. Aligarh city: economic environment vulnerability indicators.
![]()
Figure 6. Aligarh city. Ward-wise economic environment vulnerability status.
medical colleges and also specialised medical institutes. These wards are located in the north.
The overall social vulnerability index reveals that northern and north eastern wards are found to be better placed in terms of social vulnerability. However, the situation of central and south western wards is worrisome.
4) Economic Environment Vulnerability: The term economic environment refers to all the external economic factors that influence human life. The economic outcome of the COVID-19 pandemic might be far reaching and will be felt long after it is over. Epidemic induced economic shock will be felt mostly by the poorest section of society; hence it is important to consider the economic condition of a population when creating a vulnerability index (Table 5 and Figure 6). We have tried to measure economic environment vulnerability using four indicators. These are:
(i) Employment Status (ii) Occupation Status
(iii) Income Status (iv) Dependency Status
Working population refers to the economically active population, employed in any specific occupation. Its average score in
Aligarh
city is 0.503. The highest score is recorded from Durgapuri, Naglapala, Jaigunj, Badamnagar as these wards reported large proportion of population engaged in lower order economic activity and majority of them belongs to main workers (working for more than 6 months), but working in household chemical and hardware industries. They are located in southern and central part of the city.
Type of work is also an important indicator for measuring economic environment vulnerability. Majority of the wards are found to be engaged in manufacturing and household industries. Its average score is 0.505 and overall, the city showed reasonable employment opportunities. There are 32 wards having their scores lower than the city average. The lower vulnerability score is recorded from Brahmanpuri, Avas Vikas and Durga Puri as most of the economically active population from these wards is engaged in service sector.
Income status determines resilience of any community to cope with extreme situations. In
Aligarh
city, its average score is 0.523. Broadly, we have three income groups. These are high, medium and low. The ward which recorded lower scores are Gandhi Nagar, Kishore Nagar, Lekhraj Nagar, etc. due to higher income group population.
Dependent population is defined as that part of the population that does not work and relies on others for the goods and services they consume. Societies having higher proportion of dependent population are considered more vulnerable to COVID-19 as the earnings would be shared by non earners dependents. Its average score is 0.508. Higher vulnerability scores are recorded from the Sancheri Peth, Badam Nagar, and Bhujpura (0.093) due to higher percentage of dependent population.
The overall economic environment vulnerability index shows that central and southern wards mainly ADA Colony, Kishore Nagar, Lekhraj Nagar and Gandhi Nagar had better scores while the wards from west and east part of the city are found to be more vulnerable.
5) Ward-Wise Composite Vulnerability: The composite vulnerability score for Aligarh city is 0.469. There were 10 wards which have reported low vulnerability and relatively secure on selected vulnerability indicators. Prominent among them were University area, Lekhraj nagar, Sudamapuri, Gandhinagar and AwasVikas wards. While Durgapuri, Naglapala were under high vulnerability category. Another 22 wards lie close to city average and remained moderately vulnerable.
Ward-wise overall Vulnerability reveals that for Natural Vulnerability central and southern wards are more vulnerable to COVID-19 While for Built-up, central and eastern wards need attention (Table 6 and Figure 7). For Social and Economic Vulnerability, western and south western wards are lagging behind the city average. This indicates that overall half of city wards have basic living status and are vulnerable to COVID-19 pandemic. This need urgent intervention and remedial measures.
![]()
Table 6. Aligarh city: ward-wise composite vulnerability status.
![]()
Figure 7. Aligarh city. Ward-wise composite COVID vulnerability status.
5. Conclusion
The present study indicates that the vulnerability index is the outcome of the interaction between physical, built-up, social, and economic environment. These environmental conditions are interrelated and each has some bearing on others also. The spatial evaluation of vulnerability condition in the municipal wards of Aligarh city displays substantial variations. Ward-wise overall vulnerability reveals that for Natural Vulnerability central and southern wards are more vulnerable to COVID-19, while for built-up, central and eastern wards need attention. For social and economic vulnerability, western and south-western wards are lagging behind the city average (Figure 8).
![]()
Figure 8. Domains of human vulnerability (man environment relationship).
The vulnerability index can provide an understanding of real-world situations. On the other hand, the vulnerability index reported in this study is intended to spatially identify vulnerable wards in Aligarh city according to four different domains of vulnerability and these wards will suffer more critical problems against of COVID-19 pandemic for their natural and man-made problems. The analysis showed that wards with a high concentration of population had high COVID-19 vulnerable areas with lower status of the land, water and air quality as well as poor provisions of water supply, waste disposal and mobility. These wards also showed dense and mixed land use and poor neighbourhood structure. While the wards with a lower concentration of population had just opposite conditions. This suggests that an obviously higher concentration of population is exerting extra stress on these environmental parameters and resulting in high vulnerability. Vulnerability indices also help the community prepare for mitigating, responding to, and recovering from the pandemic.