1. Introduction
Leverage is a measurement which shows how much the firm assets are financed by debts which is measured by total debts divided by total assets. Financial leverage is a proportion of an organization by using borrowed money from the externalities. It is the capacity of an organization in which a company uses fixed income securities such as debt and equity. High leverage indicates that the debts use more than equity, if the debts used more than equity it will lead to increase the financial cost as a result. In case of high Finance cost earning per share is affected negatively.
High financial leverage means high interest payment as result of decrease earning per share (Ali, 2014). Several preceding have been done; some show direct relationship among financial performance and financial leverage while some others show inverse association among financial leverage and the firms’ financial performance. The researcher would sort to know the impact of ownership structure and leverage on firm performance.
Finance is a basic need of all business for working capital and capital expenditures. Some firms use debt while some others use equity financing to serve this purpose. Various firms select debt while others select equity financing. And to use together in a firm financial structure it depends upon the organization structure, size and policies that how to take decision. In simple words capital structure is the mixture of debts and equity financing, debts included both short term and long term debts on the other hand equity financing included common equity and preferred equity.
The above study clearly identified that most of the companies usually will like fixed repayments for a specific period, for fixed repayments companies use debts in the capital structure which will affect the company’s performance. To avoid the fixed repayments the company used equity financing for generating fund due to equity financing companies, to give ownership to the equity holders. Now the question arise is that, the there is any relationship with stake ownership on firm performance.
Trading volume and total market capitalization have developed significantly accordance with Shanghai and Shenzhen of China due to the opening of two exchanges. They have divided shares into two categories domestic and foreign share by shareholders residency. Domestic shares are mostly held by individuals and further domestic shares are divided into four categories state shares, legal person share, employees share and the last one is the tradable shares. In mostly public trade corporations are the largest or of majority shareholders.
On the permission of china securities regulatory commission, state shares would be converted to domestic institutions and not tradable in open market. The legal person shares are just like state shares which are not allowed to trade in open market and on the approval of china securities regulatory commission can be transferred to domestic institutions mostly held by non-financial institutions stock companies.
Next one is the employees’ shares are those shares which are held by workers and managers of the listed company in a significant concession. Employee’s shares represent the shareholding employee’s rights which are registered under the labor union of the corporations. After the holding period which is 6 to 12 months CSRC give permission to shareholders who have the employee’s shares to sell in open market. Ownership structure is the distribution of ownership among the entity’s owners (shareholders) (Jiang, 2004).
In the equity market of Pakistan Ali Shah et al. (2009) conducted a research to know the impact of ownership structure and corporation governance on capital structures. Sample size consists of 58 non-financial firms which are listed of Pakistan stock exchange for the period of 2002 to 2005. The empirical result shows that the managerial ownership have a inverse relationship with debt-to-equity ratio, further their result shows that the corporate financing behavior has no effect on non-executive directors on board and CEO or chair duality. They recommended that ownership structure, are too much crucial to determining the capital structure.
Ezeoha and Okafor (2010) reported that ownership structure is the proportion of shares claimed by managers are called managerial ownership, if the shares held by other institutions like non financial institutions is called institutional shareholding means institutional ownership. And the proportion of shares owned by government’s is called State ownerships, and those shares which is owned by foreign investors are called foreign ownership while the proportion of shares held by spouses or other family members are called family ownership and so on.
Ownership structure consisted of institutional ownership (block holders), Managerial ownership (insider ownership), Individual ownership, Ownership concentration, State ownership (governmental ownership) and family owned ownership. Institutional investors mean if the shares purchased or held by others institutions like mutual fund insurance companies or other financial institutions like commercial banks etc. Managerial ownership means that the shares purchased by insider owner means that shares held by the manager’s chief executive and board of directors.
Individual ownership means that the shares held by the individuals mean person with less than five percent of the outstanding shares. Ownership concentration means that the shares held more than five percent of the outstanding shares. Block holders are those who held more than ten percent of the outstanding shares. State ownership means that the outstanding shares held by the government. Foreign ownership means that the shares held by the other country investors. Family owned ownership means that if the outstanding shares held by spouses and minors children, wife or other family members.
The main theme of this study is to know the impact of leverage and ownership structure on firm performance of non-financial firms listed on Pakistan Stock Exchange. Ownership structure consisted of institutional ownership (block holders), Managerial ownership (insider ownership), Individual ownership, Ownership concentration, State ownership (governmental ownership) and family owned ownership. Previous researchers have conducted research on ownership structure and its influence on firm performance. But this research would sort to know the impact of leverage and ownership structure on firm performance.
Ownership structure is the tools of corporate governance that examines the productiveness and to make sure that the wellbeing of shareholders to be considered and achieve the organizational goals. This study will be beneficial for investors to know the determinants of ownership structure, and also beneficial for organizations to minimize the agency problem. This study investigates the impact of leverage and ownership structure on firm performance in presence of Pakistan Stock Exchange by applying statistical tools. The main themes of this study are to find out that there is a link between leverage and ownership structure on firm’s performance. This study answers the following questions. What is the effect of leverage on firm performance?
What is the effect of managerial ownership on firm performance? What is the effect of institutional ownership on firm performance? What is the effect of the family ownership on firm performance? These questions answered by the Literature. The core aim of our study is to determine the correlation of firm performance with managerial, institutional, and family owned ownership. Pakistan economy is a rising economy having different cultural, standard of living, belief, qualities, etc for this our conclusion will be varied as contrasted to developed economies that have great investors’ protections.
1.1. Problem Statement
In the absence of corporate governance, there was agency problem among managers and shareholders. Asadi and Pahlevan (2016) have revealed that the main theme of the ownership structure is agency problem. Ownership structure is the distribution of ownership among the companies’ shareholder, and it is the ability and incentives to control the management which will minimize the agency problem.
Several past studies concerning the function of ownership structure on firm performance from established and developed countries with great investor protection, and thus it has been just a target by researchers in developing countries to investigate the availability of a probable link among ownership structure and firm performance (AL-Najjar, 2015). This study has to investigate the effect of leverage and ownership structure on the firm performance in the existence of different types of ownership structures (managerial, institutional, family owned ownership) in all firms listed on Pakistan stock exchange.
1.2. Aims and Objectives
1) To investigate the effect of leverage on Firm performance.
2) To examine the influence of various ownership structures (managerial, institutional, and family owned ownership) on the firm performance.
1.3. Research Questions
This study helped to answer the following questions which are given below.
1) What is the effect of leverage on firm performance?
2) What is the effect of managerial ownership on firm performance?
3) What is the effect of institutional ownership on firm performance?
4) What is the effect of the family ownership on firm performance?
1.4. Significance of the Study
This study determined the impact of leverage and ownership structure on firm performance. Ownership structure is the tools of corporate governance that examines the productiveness and to make sure that the wellbeing of shareholders to be considered and achieve the organizational goals. This study will help investors to take investment decisions. And also help the firms to reduce agency problem.
2. Literature Review
Literature review is the second chapter of the thesis which consisted of preceding work which is done by others researchers. This chapter also consisted of conceptual frameworks which explain dependent and independent variables.
2.1. Overview of the Literature
This section covers in brief discussion and divided into 6 sections. This section starts with the ownership structure and firm performance, followed by managerial ownership and firm performance in section 2.1. This is followed by family ownership and firm performance in section 2.2 and then after it in section 2.3, there is institutional ownership and firm performance. Leverage and firm performance is in section 2.4 and again followed by conceptual framework in section 2.5. In the last, there are hypotheses in section 2.6.
2.2. Ownership Structure
Ownership structure is the allocation of ownership among the entity’s owners (share holders). It is simply defined that ownership is the distribution of equity in entity’s owners with regards of votes and capital, which included financial and non-financial institutions, individuals and directors.
The association of ownership structure and firm’s performance has much important in the literatures of the corporate governance. Now the questions arise that ownership structure means managerial ownership, institutional ownership and family owned businesses affect firm’s performance or not? This literature tries to answer these questions.
In the equity market of Pakistan Ali Shah et al. (2009) conducted a research to know the influence of ownership structure and corporations governance on capital structures. The sample size consists of 58 Non-Financial firms listed of Pakistan Stock Exchange for the period of 2002 to 2005. The empirical result shows that the managerial ownership have a inverse relationship with debt-to-equity ratio, further their result shows that the business financing behavior has no effect on non executive directors of board or chair duality. They recommended that ownership structure, are too much crucial to determining the capital structure.
2.3. Ownership Structure and Firm Performance
Ownership structure is the allocation of ownership among the entity’s owners (shareholders) (Jiang, 2004). According Asadi and Pahlevan (2016), the key theme of the ownership structure is agency problem. Agency problem is the conflict among the interest of the stockholders and managers may lead to agency problem. Ownership structure is the distribution of ownership among the companies’ shareholders and it is the ability and incentives to control the management which will minimize the agency problem.
Usually shareholders invest in different companies to reduce the risk through diversification. In fact, they invest in the hope of future benefits of their stock portfolio, not in the hope of a better potential of a specific company. In addition, Single shareholders do not have the ability to make the effective decisions, because they do not have the necessary expertise and the ability to control the management.
Ownership structure is characterized by Jensen and Meckling (1976) they revealed that ownership structure is the allocation of equity, votes and capital is also the identity of shareholder’s ownership. Structure of the organization is too much significance inferable from it as an inside instrument of the corporate governance. Firm build ownership with different patterns of ownership structure based on the vision of the company. Investors are not only determinants of market value but there are some other factors for instance, dividends policies, financial structures, its governance, and shareholding structure adding value as well.
Different pattern of ownership such as foreign ownership, state ownership, individual ownership; institutional ownership managerial ownership and family owned ownership also have influences on firm performance maybe positive or negative.
Jensen and Meckling (1976) studied that the agency problems have two types. First type is agency cost of equity which caused by the clash between shareholders and managers, and the second type of the agency cost of debt which is based by the argument among debt holders and equity holders.
Agency theory assumes that agency conflict has two type’s i-e agent (management) and the principal (owners). The proper utilization of company’s scarce resources and authority are handed over to the agent because of selected fee schedule by the principal. Although there maybe incompatibility among the principal’s interest and agent’s interest and their incentives may be diverse with each other, so there should be a proper performance appraisal of agents (Namazi, 2013).
Moreover the agency theory is the conflict between the managers and the outsider investors and it arises as managers are not involved in the company operations. Agency conflict is not only possible among the managers and outsiders’ investors but can also arise among the shareholders and shareholders as well especially in developing countries (Dharwadkar et al., 2000).
According to Jensen and Meckling (1976) ownership structure is the contribution of capital that involves the inside investors (managers) and outside investors (debt holders and equity holders). Ezeoha and Okafor (2010) reported that ownership structure is the proportion of shares claimed by managers are called managerial ownership, if the shares held by other institutions like non financial intuitions are called institutional ownership. And the proportion of shares held by government is called state ownership, and those shares held by foreign investors are called foreign ownership while the proportion of shares held by spouses or other family members are called family ownership and so on.
Ahmed and Hadi conducted a research on the impact of ownership structure on firm financial performance in the MENA region. The sample size of this study consist of nine MENA countries included (Egypt, Bahrain, Qatar, Kuwait, Tunisia, UAE, Morocco, Oman, and jordan) for the year 2014. They measured the performance on proxies by return on assets, return on equity and Tobin-Q, their results show that the block holders, insider equity holders and state ownership plays an important roles in the performance of the firm so, the results suggest that insider ownership has negative effects on the firms’s performance, which is measured by ROA, ROE and Tobin-Q, and on other hand, block holders ownership effect the financial performance positively. Finally, that the state ownership has a positive impact on MENA region companies.
According to Morch et al. (2000) studied the relationship among ownership structure and firm performance. They identified that the value of the firm increased due to increased managerial ownership their empirical result also shows positive link among firm value and block holder’s ownership. But Demsetz and Villalonga (2001) reported that there is no any evidence to prove any relationship among ownership structure and firm performance.
Ali, Shah and Jan (2015) identified that there is a significant relationship with ownership structure and firm performance while insignificant with accounting based measures further more leverage has no moderating effect with the performance and ownership structure. Hill and Snell (1988) reported that the ownership structure has direct connection with the firm performance, as measured by profitability. This is the strategic decision of the concentrated firms to increase the firms’ value. There is a mix result available on the capital structure on the firm performance.
2.4. Managerial Ownership and Firm Performance
The percentage of the company’s shares held by the management is called managerial ownership, which can be measured by the proportion of common shares held by the management who is actively concerned in the company’s decision making (Saleh, Zahirdin, & Octaviani, 2017). According to Brailsford, Oliver and Pua (2002), capital structure decision is not only influence by firm uniqueness or related factors, but also the visions, aims and requirements, which are affected by firm managerial ownership structure. But improvement in the performance of firm can bring forth the managerial ownership.
On the other hand, the effect of managerial shareholding on the performance of firm is based on diverse with the level of outsider share holders. The firm performance can be hampered with low or high degree of ownership but firm performance is better at middle level. It is because of managers own costs at the time of low ownership and management entrenchment at high degree of share holdings.
Stock ownership reduced the agency conflict that is good news for top management or CEO (Jensen & Meckling, 1976) throughout stock ownership reduce unnecessary consumption by the CEO or top management and maximize the firm value. But bad thing is that which the CEO have more stock ownership in the holding stock which delay the company internal and external discipline, which is the possibility to minimize the firm’s values (Jensen & Ruback, 1983) since the CEO are much interested to be entrenched his position due to large companies in 1980, have used stock and stock option to balance top management and CEO.
Griffith (1999) stated that different market discipline measures cannot be imposed on those managers who have low scale of managerial ownership, so they will try to enhance/maximize shareholders wealth. Firm performance cannot be enhanced with the increment of managerial ownership based on the similar equations (Loderer & Martin, 1997).
Shah and Hussain (2012) studied in Pakistan to know the relationship of ownership structure on firm performance. The Data was collected in Pakistan stock exchange during the period of 2008 to 2010 which is non financial firms. Ownership structure consists of managerial ownership and ownership concentration which independent variables while firm performance is measured by Tobin-Q which is market based measured. Panel data technique has applied to find out the link between the variables. The empirical result suggests that managerial ownership has an inverse link with firm performance while ownership concentration has insignificant association with firm’s performance. Leverage has used as control variable which is negative related to firm performance.
2.5. Family Ownership and Firm Performance
Ahmad et al. (2014) defined the family business that the people invest in the world to have their own business. In family business the Board of directors, Chief Executive Officers and managers are hired from the families. There are many factors such as economic conditions of the country, political conditions of the country etc, depend upon the performance of family owned business.
Anderson and Reeb (2003) observed the US family owned businesses and revealed that family owned businesses in US have better and much profitable and valuable as compared to those firms whose control and operation is not in hand of family members means non-families owned businesses. Maury (2006) discover that non-financials firm’s around thirteen EUROPEAN states and explored that the profitability of family owned firms have sixteen percent greater profitability as well as seven percent greater value then non family owned businesses.
There is maximum firms’ value because every members of family is to use the firm’s resources efficient and effectively to get the firm objectives. On family owned ownership every individual can invest in a risky project which is must for maximizing the firms’ value. In Fact more risk more return. According to Maury (2006), management of the families can minimize the firm valuation by using financial ratios of the family business.
2.6. Institutional Ownership and Firm Performance
The proportion of the company’s shares owned by other organizations or businesses which can be measured by the proportion of common stocks possessed by the external organizations or institutions is called institutional ownership. The institutions or organizations included financial organizations such as bank, insurance, companies, and investment corporations. Non financial organizations or others types of organizations (Saleh, Zahirdin, & Octaviani, 2017).
Elyasiani and Jia (2010) and Barzegar and Babu (2008) also investigated that there is positive link between the firms profitability and block holder ownership. Barzegar and Babu also show the positive link with the return on assets and return on equity and block holder ownership. Block holder investors have attracted more beneficial information as compared to dispersed owners, which process information to reduce the information asymmetry.
Information asymmetry means lack of quality in information mean that there is a difference between investors and the manager’s information. As a result these block holders investors have the abilities of the effective monitoring as compared to the minimum informed investors (Davis & Steil, 2001). Chung and Zhang (2011) asserted that the block holders investors have much fund to invest and display positively fiduciary responsibilities, so they are able to see their firms performance well with efficiency and they closely monitor to reduced the free provision which is the possibility of outlet and much expensive.
Yu (2003) conducted a research on the affect of state ownership on firm performance on listed companies of china from 2003-2010 through usage of panel data. He revealed that firm performance can be affected in the form of u-shape due to governmental ownership. At the initial stage, firm performance declined due to governmental ownership, so after being concentrated, it will boost up the firm performance. More concentrated governmental ownership will assist the firms to exploit the government support and political communications.
2.7. Leverage and Firm Performance
Leverage is the ratio that measures how much the firm total assets are financed by debts which will be calculated by total liabilities divided by total assets, simply leverage shows that how the firm assets are invest by debts (Mwangi et al., 2014). A maximum leverage ratio indicates that the debts are used more than equity by firm.
Mostly two parities will concerned about the firm performance because of leverage; the first one is called equity holders and second one is called debts holders. Equity (shares) holders are those who are the real owners of the firm and they have residual claim on firm assets usually they carry the highest risk in the business. Equity holders receive dividends and also increase the value of their stock.
Next one is the debt holders, they receive fixed interest rate, after the completion of debts period and they will receive their own principal amount as well. They keep the firm assets as a security in case of loss or insolvent, so they have the first claim on the firm assets (Harris & Raviv, 1991). When the firm have low level of debts that firm are much effective due to low chance of bankruptcy and financial distress if the firm assets are finance in debts more than equity that effect income related with franchise value hypothesis.
High leverage indicates that the debts use more than equity, if the debts used more than equity it will lead to increase the financial cost as a result. In case of high Finance cost earning per share is affected negatively. High financial leverage means high interest payment as result of decrease earning per share (Ali, 2014).
Firm performance is effecting by different factors and variables which capital structure, ownership structure political situations etc, but the researcher want to know that leverage and ownership structure effect the firm performance or not. There are many empirical results of different studies explain the relationship some shows positive, some shows negative while some others show that the is no relationship between leverage and firm performance. The study of Pathak (2011) investigated that the level of debts has negative relationship with firm performance.
Martin-Reyna et al. (2015) conducted study to examine the relationship among ownership structure and firm performance. The data was collected Mexico public firms board of directors, family owned firm, and managerial ownership has used as a independent variables while firm performance is used as dependent variable. Firm performance has measured by Tobin’s Q which is market based measured. There empirical result shows that there is a positive relationship among family owned firms and firm performance. The result further conform that if low level of debts used in his capital structure that would lead to increase the firm performance.
Some researchers have found positive effect on financial leverage on firm performance because debts can be used as disciplining tools for management to monitor the managers. Such positive relationship among leverage and firm performance is expecting from the agency cost theory but it is not always valid that the firm used too much debt in his capital structure. High level of debts has some limitations like high interest payment, chance of bankruptcy etc, would lead to influence negatively the firm performance.
Finance theories suggest different perspectives on the connection among leverage and firm performance while also give the pragmatic results which have divided into three perspectives; positive; negative and insignificant impact of leverage on profitability.
Mahmoudi (2014); Doğan (2013); Tsuji (2013) define that there is negative correlation between leverage and Profitability. While Khalid et al. (2014), Singapurwoko and El-Wahid (2011) find out a significant positive link among leverage and profits, while Siahaan (2014) found positive insignificant link for large firms and Velnampy and Anojan (2014) found no significant relationship.
2.8. Conceptual Framework
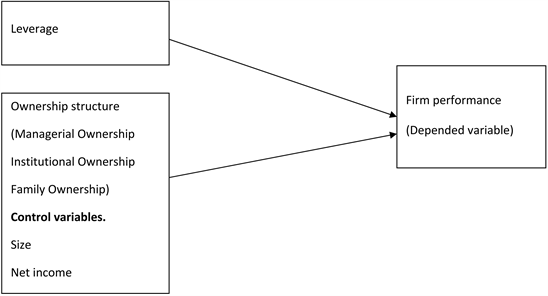
In this section, the conceptual framework and methodology of the study are discussed. Leverage and ownership structure is an independent while firm performance is a dependent variable. Ownership structure included managerial, institutional, and family owned ownership. The researcher used accounting based measure which return on assets and return on equity. The control variable includes firm size and net income of the selected firms.
Independent variables
3. Research Methodology
Research methodology is the third chapter of the study, which included the research study type, the sample size, and also shows the different sources from which the data is collected. The research methodology is also discussed in this chapter. This chapter also shows our research variables and regression models.
3.1. Type of Study
In this study we used secondary data because this study was quantitative in nature’ therefore we have tested hypotheses by deductive approach. A deductive approach we developed hypothesis or hypotheses from the existing theory and designed the research strategy to test hypothesis.
3.2. Population and Sample
The population was consisted of non financial firms listed in Pakistan stock exchange and we have selected 70 non-financial firms randomly. Those non-financial firms we selected for our study whose data were available from the period (2010 to 2016).
3.3. Sampling Technique
Random sampling technique has used for this study. Random sampling is one of the best types of probability sampling. In random sampling that every individual have equal chance to be selected of those firms that are selected for this study.
3.4. Data and Data Collection Method
The data will be collected from the following website because the secondary data is used.
1) State bank of Pakistan official website (balance sheet analysis).
2) Open doors for all .com.
3.5. Data Analysis Technique
Panel data were used in this study, because the panel data is useful in both time series and cross sectional data. The major benefit of this is to enhance the degree of freedom and minimized the co-linearity between the variables (Shah & Khan, 2007).
Panel data analysis techniques have three type i.e. common effect model, fixed effect model and random effect model.
Now the question arise that how to use the precise model for the data so, it is sorted out by F-statistics. This is given below.
F-statistics: this statistics help us to use the precise model for the data set. This statistic helps us to decide the right model among the common effect model and fixed effect model. If we select null hypothesis it means common effect should be used. The result of this test is so simple to take decision. If the value F-test occur more than two it means that fixed effect model should be applied that will lead to reject the null hypothesis and acceptance the alternative hypothesis.
F-statistics formula is given below.
= Coefficient of determination of fixed effect model.
= Coefficient of determination of common effect model.
N = no. of cross sectional unit.
T = represent the time period.
K = no. of independent variable.
If the F-test gives favor in the fixed effect model then the next is to random effect model.
Housman Statistics:
Housman statistics which is basically used to select the appropriate model among fixed effect and common effect model.
The regression model in general is:
ROA = α + β1lev + β2Mo + β3Io + β4Fo + β5income+ β6size + ?sub>t,
ROE = α + β1lev + β2Mo + β3Io + β4Fo + β5income+ β6size + ?sub>t.
ROA, ROE, = Proxy for Firm Performance,
Lev = leverage of selected firms,
Mo = Managerial ownership of the firms selected,
Io = institutional ownership of the firms,
Fo = family owned ownership of the firms,
Income = net income of the selected firms,
Size = size of the selected firms.
3.6. Variables
In this study dependent and independent variables have been used. And in which dependent variable is firm performance. Independent variables consisted of managerial ownership, institutional ownership, leverage and family owned ownership.
Independent Variables
The independent variables consisted of leverage, managerial ownership, institutional ownership, and family ownership.
Dependent variable: firm performance is used as dependent variable
Firm Performance
Firm Performance is also called financial performance. It is a measure to prove that how efficient and effective a firm makes revenue or accomplish its goals or objectives (Maditinos, Sevic, & Theriou, 2006). Mainly there are two types of measurement to measure the firm performance which is accounting based measures and the other is market based measures. Accounting based measurement is a measurement that measure firm profitability like ROA, ROE.
Second market based measurement is measurement that measures the firm’s market value like Tobin’s Q, price to book value ratio (Hoskisson, Johnson, & Moesel, 1994).
In this study we will measure the firm performance on only accounting based measurement.
ROA
The ROA is equal to the net income divided by the total assets (Ali et al., 2015).
ROE
The ROE is equal to the net income/total equity (Asadi & Pahlevan, 2016).
Leverage
Leverage is a ratio that shows how much the firm total assets are financed by debts. It identifies that firm who depends on debts financing. Some financial economic assumption shows direct link among leverage and profitability, for example agency cost theory predict that the debt will control management and minimize the agency costs as well.
Leverage is measured by:
Leverage = Total debt/Total assets (Ross et al., 2003).
Size of the firm:
Size = log of the total assets.
Net income = Net income of the selected firms.
4. Results and Discussions
Results
The core objective of the study was to find out the influence of leverage and ownership structure on firm performance. The determinants of ownership structure is managerial ownership, institutional ownership and family owned ownership, while leverage is also used as independent variable which is calculated by total debts/total assets.
In this study firm performance was used as dependent variable which can be measured by accounting based measurement and market based measurement and in this study researcher used only accounting based measurement. In accounting based measurement the researcher measured the performance by both return on assets and the return on equity. The ROA is calculated by net income/total assets while the ROE is calculated by net income/total equity. The control variables in this study were net income and firm’s size. The firm size was calculated by the log of the total assets.
The data was consisted of 70 nonfinancial firms listed in Pakistan stock exchange. The data was based on different sectors which included chemical sectors, textile, sugar mills, etc and that data was collected from the annual reports which were downloaded from the open door for all.com and the official website of selected companies. For easy understanding the data was presented in table by showing the result. Different statistical tools including descriptive statistics, correlations, Housman test and simple regressions were used to test the relationships among the different variables which were included in this study.
Based on Table 1, it shows descriptive statistics of the study in which ROA represents Return on asset, MO represents Managerial ownership; IO represents Institutional ownership, FO for Family ownership while LEV represents Leverage. In this table the independent variables (MO, IO, FO, LEV) while the dependent variable is ROA.
Interpretations of the above Table
Table 1 indicates the minimum and maximum range, statistical mean, and standard deviation of the variables. The minimum value of ROA is −1653.983 as maximum value which is 72.45524 in 481 observations. The standard deviation value is 76.75237; median is 3.315909 while the mean is 0.661886 of ROA.
The minimum value of MO is 0.00000 while maximum 88.47000 out of 481 observations. The standard deviation is 23.25722; median is 12.09000 while the mean is 21.06917 of MO.
The minimum value of IO is 0.000300 while maximum 159.3500 out of 481 observations. The standard deviation is 30.79440; median is 27.89000 while the mean is 35.64612 of IO.
The minimum value of FO is 0 while maximum 55.85000 out of 481 observations. The standard deviation is 7.903402; median is 0.000000 while the mean is 3.222013 of FO
The minimum value of LEV is 0.080792 while maximum 4206.069 out of 481 observations. The standard deviation is 198.68; median is 53.39939 while the mean is 73.75811 of LEV.
![]()
Table 1. Descriptive statistics of the ROA.
The correlation Table 2 shows the correlation among dependent variable and independent variables in which indicate positive and negative correlation.
To investigate the association between variables, the scholar has used multiple correlation models to determine whether the variables are linked with one another or not. The correlation models identify relationship among variables as strongly positively or strongly negative or the variables are weak positive and negatively connected.
There is negative correlation between MO and ROA as MO value is (−0.049238) as shown by Table 2. There is positive correlation among IO and ROA as its value clearly indicates i.e. (0.074619). There is a negative correlation between FO and return on assets as shown in Table 2 (−0.054818). Leverage has negative relationship with ROA because leverage value is −0.943367 while there is a positive correlation between size of the firm, income and ROA whose values are (0.186787) and (0.074934) respectively (Karadeniz et al., 2009).
Table 3 indicates that the Housman test is actually used to select that which model is appropriate for the data so, the significance level of busman test is (P = 0.0185 < 0.05) it means that we selected fixed effect model ROA (Saleh, Zahirdin, & Octaviani, 2017).
Table 4 represents the fixed effect model shows the relationship among the variables which we selected for the study. The coefficient value of MO is –0.144128 which show a negative association with dependent variable.
The coefficient value of MO is, –0.144128, that represents negative link, while the P value is, 0.0924. Based on this result, there is a negative link between managerial ownership and firm performance. In other words performance is decrease 14%, if a one percent increased in MO.
The coefficient value of IO is, –0.021351, that represents negative link, while the P value is, 0.0424. Based on this result, there is a negative link between institutional ownership and firm performance. In other words performance is decreased 4%, if a one percent increasing in IO.
The coefficient value of FO is, –0.121351, that represents negative link, while the P value of FO is, 0.00. Based on this result, there is a negative link between families owned ownership and firm performance. In other words performance is decreased 12%, if a one percent increasing in FO.
The coefficient value of Lev is, –0.385420, that represents negative link, while the P value of Lev is, 0.00. Based on this result, there is a negative but strongly significant link between leverage and firm performance. In other words performance is decreased 38%, if a one percent increasing in Lev.
The coefficient value of size of the firm is, 17.75165 that represents positive link, while the P value of firm size is, 0.00. Based on this result, there is a positive but strongly significant link between firm size and firm performance.
The coefficient value of the net income is, 0.000000000897 that represents positive link, while the P value of firm size is, 2.072636. Based on this result, there is a positive but strongly significant link between firm size and firm performance ROA (Saleh, Zahirdin, & Octaviani, 2017).
Based on the above table, Table 5 shows descriptive statistics of the study in which ROE represents Return on equity, MO represents Managerial ownership; IO represents Institutional ownership, FO for Family ownership while LEV represents Leverage. In this table the independent variables (MO, IO, FO, LEV) ROA (Saleh, Zahirdin, & Octaviani, 2017).
Interpretations of the above table
Table 5 indicates the Minimum and maximum range, statistical mean, and standard deviation of the variables. The minimum value of ROE is –274.8570 while maximum 273.8384 out of 481 observations. The standard deviation is 34.42246; median is 9.150587 while the mean is 8.361572 of ROE.
The minimum value of MO is 0.00000 while maximum 88.47000 out of 481 observations. The standard deviation is 23.25722; median is 12.09000 while the mean is 21.06917 of MO.
![]()
Table 5. Descriptive statistics for ROE.
The minimum value of IO is 0.000300 while maximum 159.3500 out of 481 observations. The standard deviation is 30.79440; median is 27.89000 while the mean is 35.64612 of IO.
The minimum value of FO is 0 while maximum 55.85000 out of 481 observations. The standard deviation is 7.903402; median is 0.000000 while the mean is 3.222013 of FO.
The minimum value of LEV is 0.080792 while maximum 4206.069 out of 481 observations. The standard deviation is 198.68; median is 53.39939 while the mean is 73.75811 of LEV (Demsetz & Lehn, 1985).
The correlation Table 6 shows the correlation among dependent variable and independent variables in which indicate positive and negative correlation.
To investigate the association between variables, the scholar has used multiple correlation models to determine whether the variables are linked with one another or not. The correlation models identify relationship among variables as strongly positive or strongly negative or the variables are weak positive and negatively connected.
There is negative correlation between MO and ROE as MO value is (–0.014275) as shown by Table 2. There is positive correlation among IO and ROE as its value clearly indicates i.e. (–0.040387), While negative link between FO and ROE as shown in Table 2 (–0.030888). Leverage has negative relationship with ROE because leverage value is –0.943367 while there is a positive link between size of the firm, income and ROE whose values are (0.059212) and (–0.072260) respectively (Chakraborty, 2010; Booth et al., 2001).
Table 7 shows the Housman test which used to select that which model is appropriate for the data so, the significance level of Housman test is (P = 0.0112 < 0.05) it means that we selected fixed effect model.
Table 8 represents the fixed effect model shows the relationship among the variables which we selected for the study. The coefficient value of MO is which show a negative association with dependent variable (Ebaid, 2009; Jang & Tang, 2007).
![]()
Table 8. Fixed effect model of ROE.
The coefficient value of MO is, –0.031141, that represents negative link, while the P value is, 0.0396. Based on this result, there is a negative link between managerial ownership and firm performance. In other words performance is decrease –0.031141, if a one percent increases in MO.
The coefficient value of IO is, –0.005633, that represents negative link, while the P value is, 0.0583. Based on this result, there is a negative link between institutional ownership and firm performance. In other words performance is decrease –0.005633, if a one percent increases in IO.
The coefficient value of FO is, 0.121520 that represents positive link, while the P value is, 0.7217. Based on this result, there is a positive link between families owned ownership and firm performance. In other words performance is increased, 0.121520, if a one percent increases in FO.
The coefficient value of LEV is, –0.012408 that represents negative link, while the P value is, 0.1471. Based on this result, there is a positive link between leverage and firm performance. In other words performance is decreased, –0.012408, if a one percent increases in LEV.
The coefficient value of the firms’ net income is, 0.00000000226 that represents positive link, while the P value of firm size is, 0.0002. Based on this result, there is a positive but strongly significant link between net incomes and firm performance.
The coefficient value of the firms’ net income is, 22.730028 that represents positive link, while the P value of firm size is, 0. Based on this result, there is a positive but strongly significant link between firm size and firm performance.
5. Conclusion
The research has conducted to investigate the influence of leverage and ownership structure on firm performance. Panel data, was used in this study which had the benefits of both time series or cross sectional data. The data was collected from period 2010 to 2016 which consists of 7 years.
Data of 70 non financial firms of Pakistan Stock Exchange was collected. Panel data techniques were used for analysis. Performance which was measured by ROA means return on asset and ROE means return on equity while the proxies of ownership structure were managerial ownership, institutional ownership and family owned ownership.
The result shows that the leverage has negative but strongly significant relationship with performance. Previous researchers also show negative association with leverage and firm performance (Mahmoudi, 2014; Doğan, 2013; Tsuji, 2013). There are negative relationship with ownership structure and firm performance. In case of high leverage indicates that the debts use more than equity, if the debts used more than equity it will lead to increase the financial cost as a result.
In case of high Finance cost earning per share is affected negatively. High financial leverage means high interest payment as result of decrease earning per share. There are three variables to capture the ownership structure, these variables were managerial ownership, institutional ownership and family owned ownership.
The result shows that there is negative but statistically weak significant relationship with managerial ownership and ROA. In case of high managerial ownership means if the managers have large portion of the outstanding shares it would lead to managerial entrenchment and the possibility to expropriate the wealth of the minor shareholders. The study of Cho (1998) also shows negative relationship. Institutional ownership has also negative relationship with ROA.
In case of high level of institutional ownership firm performance is decreased because the institutional investors used their relation with the manager in decision making processes which is the cause of agency conflict. The study of Berrone et al. (2007) also shows negative effect of institutional ownership on firm performance. Similarly, family ownerships have also negative relationship with firm performance listed in Pakistan stock exchange.
Lauterbach and Vaninsky (1999) also show negative relationship. They revealed that the family owned firm earned less income and inefficient as compared to those firms which are managed by professional managers. Because that the family owned businesses are managed by the owners as a result they perform badly. Firm’s size and net income of the firm were used as control variables which have positive significant influence on firm performance with both ROA, ROE. Managerial ownership affects negatively firm performance in ROE which is in Table 8.
The result of ROE shows that Institutional ownership has negative while family owned ownership shows positive relationship with firm performance.
5.1. Limitation of the Study
There are 559 nonfinancial firms listed on Pakistan stock exchange but in this study sample size consisted of 70 nonfinancial firms and time period 7 years. Researcher took small period of time and minimum firms due to the shortage of time. 7 years data shows significant and negative effects.
Secondly, there are two types of measurements to measure the performance, which were accounting based measured and market based measured. In this study the researcher measured the performance only on accounting based.
Thirdly, if we look the pattern of share holding which is different type of shareholders that affect the performance but in this study researcher took three types of ownerships which were managerial ownership, institutional ownership and firm performance.
Fourthly this study in conducted in Pakistan so the researcher took data from the Pakistan Stock Exchange which is developing country but some researcher conduct study in different developed countries. Pakistan economy is a rising economy having different culture different corporate governance so that way our result is different as compared to other results.
5.2. Recommendations for Future Study
Based on the limitations of this study, there are several recommendations for future Researches,
Firstly, this study had examined the relationship of independent variables which were leverage, ownership structure (managerial ownership, institutional ownership and family owned firms) and the control variables were size of the firms and net income of the selected firms with dependent variable (firm performance).
Therefore, future research should consider testing on others valid independent variables in affecting firm performance such as individual ownership, state ownership, and foreign ownership
In this performance was only measured on return on assets and return on equity. For future, researchers can also try on other measurement which is market based measured means Tobin-Q also can be used as it may result in different findings.
In this manuscript four authors have contributed and their contribution are as following.
In this manuscript all authors have contributed and their contribution are as following.
(JA): The Principle and Corresponding author carried out the writing of introduction, literatures, methodology and conclusion parts, as well as design, organized, drafted and alignment the Manuscript. In additions to this, I also revised the whole manuscript twice including “Results and discussion part” and carried out all correspondence with journal editor etc. (YT) second Principle Author carried out statistical analysis and helps us in writing the results and discussion parts. (MA), the second Author revises the whole Manuscript twice including result and discussion part
(FU) Corresponding author carried out the Collecting and sorting of data.
All authors read and approved the final manuscript.
Acknowledgements
We are thankful to the anonymous reviewers and journal editor for their useful comments and suggestions.