Rise of Urban Water Table as a Cause of Flooding: Improving Knowledge in the City of Niamey (Niger Republic) ()
1. Introduction
Climate change and meteorological events, storms, hurricanes, thunderstorms, cold or heat waves carry potential risks whose impacts can affect many areas: ecological, demographic, health, economic, social and political [1]. The current context of climate change in the Sahel region is manifested by an exacerbation of natural hazards such as droughts and floods. [2] reports that between 1970 and 2000 the urban centers of Niger experienced 75 floods, including 14 in the city of Niamey alone. At the institutional level, following the flood of 1998 and more recently that of 2012, the issue of flooding is taken care of by several structures which are supported by several local and international partners. It should be noted that these are rain and/or river floods. Silent floods (due to the rise of the water table) are rarely taken into account during the study work whereas in the city of Niamey there are sectors (along the Gounti Yéna valley) where the populations are witnessing the phenomenon of unexplained permanent flooding.
As everywhere in the Sahel, rainfall is characterized by very high spatio-temporal variability. In semi-arid environments, recharge processes are heterogeneous and variable in space and time [3] [4]. This heterogeneity is linked to the high variability of hydrological parameters (rainfall, runoff and infiltration) which increases with aridity [5]. The city of Niamey belongs to the Sahelo-Sudanian zone characterized by rainfall of between 400 and 700 mm and spread over 3 to 4 months with a maximum in August [6]. Rainfall is characterized by great variability in space and time, from year to year and between dry and wet periods.
With the unplanned growth of African cities, controlling the quality of the environment is becoming a major public health issue [7]. In semi-arid environments, the recharge of aquifers can be profoundly modified by the anthropization of the natural environment [8]. However, for several years it has become apparent that human activities have a negative impact on the quality and quantity of the groundwater resource.
The modification of the vegetation cover disrupts the distribution of water on the surface and in the soil. On the slopes and lowlands of southwestern Niger, the replacement of the natural savannah by millet crops had a triple action favoring runoff, the concentration of runoff in the lowlands and then the recharge of water table which is multiplied by ten [5] [9]. In addition, there are local variabilities related to topography, soil types, vegetation, geology and land use [10] [11]. Like most sub-Saharan cities, Niamey has experienced rapid population growth (annual intercensal of over 4%) and rapid urban expansion.
In the Gounti Yéna valley, floods cause the collapse of wells or the submersion of tracks and tree roots, causing on the one hand the rupture of the social fabric and on the other hand the suffocation of trees. Without noting the appearance of other water-borne and vector-borne diseases following the stagnation of these waters. The economic impacts are enormous; there are significant direct losses and indirect losses that are difficult even to assess; regular expenses on a daily, weekly, monthly and/or quarterly basis. [12] recommends the development of precision flood risk models. The main objective of this study is to improve knowledge of floods due to the rise of the water table in Niamey. More specifically, it involves carrying out geological, geophysical and hydrogeological investigations in order to determine the main causes that led to these floods.
2. Consistency of the Research
2.1. Study Zone
The city of Niamey is built on a topographic plateau rising north-east from the bank of the Niger River [13]. The water demands of the inhabitants of the capital are mostly served by the catchment of the Niger River. In the northern zone of the basin, where drinking water distribution network of the SEEN has not yet been reached, there is development of the catchment of a water table whose depth varies between 30 and 50 meters through boreholes and wells made by “mechanics”.
In addition to its role in stormwater drainage, the Gounti Yéna also collects wastewater from the Boukoki, Deizeybon, Katako, CEG Bagdad, Recasement, and services such as ONAREM, Museum, large market, El Naser buildings, SONARA, BOA, …etc. and discharges them between the convention center and the Gaweye Hotel, an outlet area.
Our study focuses on the Gounti Yéna watershed (~62 km2) which is a tributary of the Niger River (Figure 1). The Gounti Yéna valley crosses 3 municipal districts out of the 5 in the city of Niamey. It was subdivided between 1990 and 1991, after two (2) decades of intense drought (1970s, 1980s) which affected the Sahel. The water table was sterile in the city of Niamey [14], thus favouring constructions including in the bed of the valley. Currently, only the upstream part is still semi-rural but is in the fast track of subdivision.
2.2. Demography of the City of Niamey
In 150 years the population of the earth has grown from 1 to 6 billion inhabitants [1]. The increase in the urban population of various African cities is one of the major factors aggravating the flooding of these cities. This increase has two main causes: the natural increase in population and the migration from rural centers to urban areas.
The population of Niamey was 1730 inhabitants in 1931. From 1950, the city again experienced significant demographic growth exceeding 12% [15]. The population of this city can be estimated today at nearly 1.3 million inhabitants and will reach the threshold of a megalopolis by 2080. The number of migrants
![]()
Figure 1. Location of the study area and the piezometric measurement points.
would reach 20% to 50% of the total population [15]. The rural exodus persists in Niamey despite a downward trend (36.5% of migrants in 2001 against 23% in 2012).
2.3. Projection of the Population of the City of Niamey
Three hypotheses (high, medium and low) are proposed concerning the evolution of the population: 1) The high hypothesis refers to a scenario of strong economic recession, of increased vulnerability of Niger to climate change leading to a significant rural exodus. For which the rate would be set at 5%; according to this hypothesis, the population of Niamey will be around 10,560,022 (mega-city) inhabitants in 2060; 2) The middle assumption, based on projections from previous censuses, is that of moderate growth in migration and a decrease in the average size of households. Growth rates vary from 3.9% to 3.3%. Here, Niamey will be around 10,067,123 inhabitants in 2080; and 3) The low hypothesis corresponds to a gradual decrease in the average growth rate from 3.9% to 2%, reflecting the decline in migration rates. In this hypothesis, urban growth is reduced to the natural and internal growth rate of the city, which seems absurd given the current development of the city of Niamey.
2.4. Geological Setting of the Study Area
The city of Niamey is located on the edge of the large basin of Iullemeden. The latter is bounded by the crystalline massifs of Liptako-Gomma, Adrar des Iforas, Hoggar, Air, Damagaram-Mounio and Nigeria. It is made up of alternating marine and continental deposits set up during the various transgressive and regressive episodes that mark out its geological history [16].
The geological formations encountered at Gounti Yéna can be grouped according to the geology of the city of Niamey into three groups, namely from the base to the top:
Ö The Precambrian basement (Meta-Liptako) is the deepest geological formation. Basement rocks are mainly exposed in the bed of the Niger River where they are locally covered with alluvial deposits 1 to 7 m thick and at the level of the cornices [17]. The main basement formations encountered are greenstone belts and also granitoids [18].
Ö In second position we find the Continental terminal: these are formations constituting the last series, purely continental as its name suggests. Greigert, 1978 defined three sets within the Continental Terminal arranged from base to top as follows: 1) the “Ader Doutchi siderolithic series (CT1); 2) the “clay-sandy lignite series” (CT2) then finally 3) the “Middle Niger clay sandstone series” (CT3) which outcrops in the SW part of the basin, where the study area, Niamey is located. In Niamey, only the upper part of CT, the CT3 (the “series of clayey sandstones of Middle Niger”) is observable [19].
Ö Alluviums are shallow formations of loosely compacted sand comprising valley bottom colluvium, lateritic ferruginous crusts, recent dunes and terraces of Quaternary to present age, which rest on the Continental Terminal and/or the base most often. In the Niamey region, the flanks of the Niger River valley form a series of entablatures arranged in well-individualized tiers [20].
2.5. Hydrogeological Framework of the Study Area
The geological formations mentioned above characterize different aquifers: the basement aquifer captured by deep boreholes, the Continental Terminal (CT) aquifer and the alluvial aquifer captured by shallow wells and sumps. The piezometric levels measured in 2018 confirm an underground flow which occurs mainly from the NNW towards the South [21] towards the river and a drainage towards the Gounti Yéna which is superimposed on this main flow axis.
2.6. Material and Methods
Geological investigation
For a better geological and hydrogeological study in the study area, the examination of existing water points through borehole research missions between 1984, 1985 and 1986 was carried out. Before the field mission, the analysis of the various lithological sections was carried out. The various geological sections established are based on the correlation of the structures of the various logs whose location has been re-located. The topo of these different sections is taken from the 30-meter DEM. A GARMIN-type GPS and a survey of the population made it possible to accurately find the positions of the various boreholes.
Piezometric measurements
Static level measurements were carried out during two piezometric campaigns organized during 2020. The piezometric level was obtained by subtracting, for each water point, the static level and the coping from the altitude of the water point concerned in order to establish low water, high water piezometric maps in 2020 at the scale of the Gounti Yéna basin. We determine the hydraulic gradient on the piezometric map using the following formula:
I = (H1 − H2)/L = H/L
I hydraulic gradient, H = difference in the piezometric level expressed in (m), L = real distance separating two isopied curves in (m).
The piezometric measurement water points are public or private wells (located in the household and gardens) and piezometers for the purpose of this work. For monitoring at a finer scale, data have been measured and collected since 2018 on a monthly basis during the dry season and weekly basis during the rainy season. These are the water points located in the flooded area and on both sides (East-West-North-South) of the flooded areas. All the measurements were carried out with a piezometric luminous and sonorous probe characterized by a length of 50 meters.
Geophysical measurements
Near-surface geophysical techniques can be useful for the reconstruction of anthropic and/or natural buried structures in urban context [22]. To better understand the internal structure of flooded and nearby flooded places, geophysical work was carried out. All the geophysical work is summarized in Table 1. The TDEM holes and the ERT profiles were carried out to identify the clayey levels and vertical electrical soundings to complement the TDEM holes especially in the cartography of the clayey level at the scale of the basin. The objective of the RMP surveys was to characterize the aquifer levels. In our urban study area, the location of sites and measurement devices were constrained by electromagnetic noise conditions and the density of housing (lack of free space) then the RMP
![]()
Table 1. Summary of geophysical methods and their characteristics.
was only carried out upstream of the basin in the not too urbanized area and the TDEM in the urban centre with a 25 × 25 loop and in the semi-urban area a 50 × 50 loop. The interpretation of these field data was first carried out separately for each method, then jointly, using the available tools (Table 1).
Prospecting by vertical electrical soundings (SEV) is based on the injection of an electric current I between two electrodes A and B and the measurement of a potential difference ΔV between two other electrodes of potential M and N. For the Schlumberger method, the AB separation should be approximately 8 times the MN separation. An AB/MN ratio between 4 and 20 is generally tolerated. At the start of the reading the spacings AB and MN are small, as the reading progresses the electrodes A and B are symmetrically away from the centre O, without displacement of the electrodes M and N. There is displacement of the latter only when the ratio AB/MN becomes too large (i.e. greater than 20), the MN spacing must then be increased by symmetrically displacing the potential electrodes. When this situation occurs, two or more readings are taken for the same AB gaps, one for each of the MN gaps. The progressive spacing of the electrodes allows a deeper and deeper investigation into the soil. The meter readings (placed in O) represent the dV/I ratio. These readings are then multiplied by the appropriate K factor and the apparent resistivities thus obtained are plotted on a log-log graph with the AB/2 separation on the abscissa and the apparent resistivity values on the ordinate [23].
By means of TDEM prospecting we were able to reconstruct the structural setting of the area [24]. It was also possible to outline the geological setting. The method of TDEM is based on rocks resistivity measurements, which is appropriate for groundwater research. Resistivity is a key parameter because it depends on parameters such as clay content, total porosity (i.e. water content), groundwater electrical conductivity, and, for unsaturated soils, percentage of water filling the pores [25]. This method is also named the TEM (transient electromagnetic) method.
[26] define the principle of the ERT as follow: when a continuous electric current of intensity I (in mA) is generated between two current electrodes A and B—where A is the injection electrode (positive), and B is the reception electrode (negative)—placed at the surface of a ground, which is theoretically considered as homogeneous and isotropic, a semispherical electrical field is created (half-space), and its volume is function of the distance between A and B. The more the two electrodes are spaced the more the spatial extent of electrical field is. If we add at this two current electrodes two potential’s electrodes, M and N, allowing the measurement of the difference of potential ∆V (in mV) due to the joint action of A and B, the resulting quadrupole allows measuring the ground apparent resistivity ρ (in Ωm).
MRS is the field-scale implementation of the nuclear magnetic resonance (NMR) method that is used for laboratory measurements and well logging in the oil industry [27]. According to [28], the loop of MRS acts as a transmitter of an electromagnetic field and then, after the transmitting is terminated, as a receiver of the response from groundwater. Both the transmitting field and the receiving signal oscillate with the Larmor frequency w0, which is the resonance frequency for protons in the earth’s magnetic field and that inversion of MRS measurements gives access to the water content in the subsurface.
For 1D VES, 2D electrical imaging, TDEM sounding and MRS, detailed descriptions of the used methods can be found in the references: e.g. [29] [30].
3. Results and Discussions
3.1. Different Types of Flooding in the City of Niamey
1) Fluvial floods
The causes of flooding in different African cities are almost everywhere the same. These have always been caused by climate change, accentuated by the effects of demography, the uncontrolled expansion of cities, the lack of pipes (water drainage network), deforestation, etc.
Niger dug its bed between Gotheye and the W valley, through the sedimentary cover of the Continental terminal, which was completely eroded there over a width of several kilometers [14]. While the 1990s were declared international decades of natural disaster prevention, the city of Niamey recorded a series of floods in 1992, 1998 (black year of natural disasters) followed later in the 2000s by those of 2000, 2010, 2012, 2013, 2017 and more recently in 2020. [31] believe that the floods recorded in 2010, 2012 and 2013 are due to the phenomenon of silting up of the river bed which greatly reduced the depth of the river bed. river (natural factors and anthropogenic forcing of floods in the Sahelian zone in the Niger basin).
If the crest of the river in the city of Niamey reached a coast of 618.1 cm for a maximum flow of 2492 m3/s recorded on August 21, 2012, in September 2020 this scale was outright exceeded, it was necessary to add a scale of order 700 cm.
Numerous studies link these floods, the morphology of the river basin, heavy rainfall, the expansion of towns and the deforested nature of the various watersheds, thus increasing runoff and sediment input into the said river. Nouakchott, Bamako, Ouagadougou, Cotonou, Lomé, Abidjan, Dakar, Lagos, Niamey…are West African cities in which urbanization has led to the occupation of potentially floodable areas [32].
Several measuring stations have been measuring the level of the Niger river in Niamey since 1928. Thus, from 1944 onwards, this is regularly monitored and this makes it possible to distinguish with more precision two periods of rise in the level of the river: between August and September on the one hand and on the other hand between December and January.
Depending on the threshold reached by the level of the river during these two rises, a flood called fluvial flooding occurs in one or two stages: a first stage during the rainy season during the so-called local or red flood and a second time at the time of the Guinean or black flood. According to [33] the first flood, of Sahelian origin, occurring during the rainy season and is linked to flows linked to the monsoon rains, generally of high intensity (35% of the rains fall with an intensity greater than 60 mm/h) and the second period corresponds to the arrival of the flows generated by the same monsoon in the upstream basin, and which took several months to cross the 2000 kilometers to be covered from Guinea, and especially the Inner Niger Delta, a vast expanse of 120,000 km of lakes and marshes in which the river loses on average half of its flow each year. They also believe that urbanization alone can increase the risk of flooding resulting in soil waterproofing in urban areas and urbanization of flood-prone areas. Or the combination of the latter with accelerated hydrological and sedimentary processes ranging from silting up rivers to the spread of exoreism. These floods impact the districts of Municipality 5 bordering the river such as Lamordé, Nogaré, Karadjé and the University sector.
2) Pluvial flooding
Most cities Africa are mostly affected by flooding, especially during the rainy season, mainly due to a lack of or a failure of a drainage system.
In Niger, precipitation is unevenly distributed in space and time: for example, in Niamey in 2014, the communal district I recorded a rainfall of around 531.4 mm in 34 days and in 2017, 710.5 mm in 26 days (Table 2). Also, Municipality I, which shares almost the same geographical territory with Municipality II, had received 513.5 mm of rain in 2016 against 439 mm for Municipality II with the same number of rainy days (Table 2).
About 90% of annual precipitation falls between late June and September [34]. [17] states that in recent years, rainfall has rarely exceeded 600 mm/year. Another more palpable example is that of the annual rainfall accumulations recorded in 2019 and 2020, which are respectively 356 and 716.2 mm (Figure 2). This clearly reflects the aspect of uneven distribution of rainfall.
3) Groundwater flooding
The supply of this water table depends directly on rainfall conditions. The generalized drought that hit West Africa during the 1970s and 1980s was the most important climatic event at the regional level [35] even though [36] believe that despite the drought observed since 1968 in most of the West African Sahel, runoff and river flows have increased in the same region; the latter can have close relations with the water table in a well-defined geographical area. So it is obvious that the runoff increases when the watersheds are cleared. According to [14],
![]()
Table 2. Total annual rainfall in Niamey municipalities from 2014 to 2017.
![]()
Figure 2. Distribution of rainfall over time in Niamey (AMMA-CATCH_IRD station).
wells used to be pushed to a depth of 40 m crossing the argillaceous fringe of the granites and without encountering a water table in 1961 in the city of Niamey. However, today this fringe has humidified and has become an aquifer. There are also a rise of 40 and 20 meters on two wells that Plote followed in 1961 respectively located to the north-west of the general referral hospital of the city of Niamey and to the OPVN of Niamey.
If for [19] in some of the flooded neighbourhoods, it is the fragility of the materials used for the constructions that creates a vulnerability of the issues facing excess water, in the city of Niamey, the inhabitants most often affected by the silent floods are well-off people with all the solid constructions.
In Africa, underground water in urban areas is subject to multiple constraints due to strong demographic growth and the inadequacy or even the absence of a sanitation network [15] most often leading to the phenomenon of flooding.
3.2. Impacts of Flooding Due to the Rise of the Water Table
The impacts of these floods are social, environmental, health and/or economic.
In addition to the flooded areas along the Gounti Yéna valley, it is observed another phenomenon linked to the sanitation problem that can be seen from two angles: The first phenomenon relates to the permanent stagnation of water (twelve months out of twelve): this fact pushes the inhabitants of the area in addition to pouring grey water also dump household garbage (Photo 1) thinking they can manage to clog the water bodies. Another portion of this population (16%), who do not have septic tanks, indulge in open defecation around the various bodies of water already surrounded by urban waste. This complex then constitutes a favourable place for the development and propagation of water-borne and vector-borne diseases such as malaria, conjunctivitis, cholera, bilharzia and diarrheal diseases.
The second aspect concerns the septic tank-groundwater interconnection (Photo 2). In the Gounti Yéna valley, there are residents who empty their pits on a daily basis depending on their position in relation to the affected area. This emptying is done either manually or with a motor pump. It should also be noted that those whose emptying time varies between one week and three months can pay for the emptying service. This is 5.6 km2 of area directly impacted by this scourge and an affected population estimated at 283,750 inhabitants.
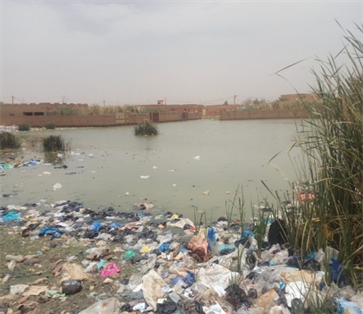
Photo 1. Contaminated water body.
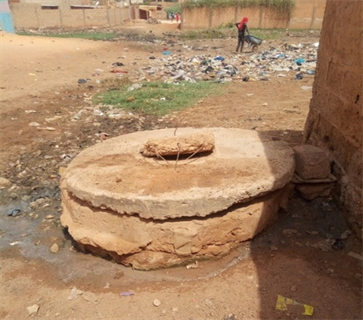
Photo 2. Pit communicating with the water table.
3.3. Piezometry of Gounti Yéna
The piezometric map of the Ct3 water table established by Leduc, June 1996 and that of Boeck, 1961 present some characteristics similar to those of the maps established recently (2020) which are: a general flow being towards the south, a feeding zone important in the north-west, a feeding area of lesser importance in the north-east. In addition, the relationships between the different aquifers in the city of Niamey are widely discussed by [16]. More specifically at the level of the Gounti Yéna basin, the piezometric map established in low water 2020 (Figure 3) shows:
A piezometric coast is established between 188 and 222 m for the year 2020 with the location of the lowest loads at the outlet. The maximum loads (220 - 224 m) are found at the level of the piezometric domes in the districts of karsamba and tchangarey upstream of the basin. A watershed line on the plateau (in the districts mentioned above) is observed with the direction SSW towards the kori of Ouallam towards goudel gorou and SSE towards the kori of Boubon; this shows that these two koris therefore influence underground flows and appear as axes of water table drainage in addition to the Niger River. In the north, towards the districts of Karsamba and Tchangarey, the isopièzes diverge in the direction
![]()
Figure 3. “Low water 2020” piezometric map of the Gounti Yéna watershed.
of Goudel gorou and the kori of Boubon, while they narrow in the north towards the Niger river. We can assume that the permeability of the aquifer is increasing towards the Ouallam kori and/or that the flow section is increasing [17], it should also be noted that this is a relatively flat area with lower hydraulic gradients. In fact, hydraulic gradients of 0.7‰ towards the Ouallam kori, 2.38‰ towards the Boubon kori and 3‰ across the basin towards the Niger river are obtained in May 2020. The increase in the section d. The flow is confirmed by the borehole cuts and geological cuts made to the east of Niamey. The fact that the water table exhibits variable hydraulic gradients, especially from one period to another, shows that it has a non-uniform flow. The underground flow is from north to south towards the river (point located between the Gaweye hotel and the congress palace: the outlet), similar to the general flow direction of the whole of the water table of CT3. From the middle of the basin, a drainage axis is superimposed on the main axis (210 m) of flow of the Gounti Yéna indicating that this watercourse drains the water table from the downstream flooded sector. The groundwater supply and therefore recharge is easily perceptible in the plateau area upstream of the basin through the piezometric domes.
High water period: The water table reaches its maximum level between September and October, thus, a map was established in this period (Figure 4), this
![]()
Figure 4. “High water 2020” piezometric map of the Gounti Yéna watershed.
one keeps almost the same pace as that established in low water (Figure 3) with regard to the forms of the iso pizes. For the high water period, the different piezometric coasts are between 230 and 192 for the year 2020 with maximum loads still on the karsamba plateau (230) and minimum ones at the level of the Niger River (192). We always maintain the same observations as those of the low water period: that is to say the direction of the flows, the watershed line. Indeed, for this time, the flows are towards the Ouallam kori with a hydraulic gradient of 3.5‰, 5.5‰ towards the Boubon kori and finally 3.3‰ towards the Niger river for the 2020 high water period.
3.4. Geological Investigation
This study will be based essentially on the information collected on the various boreholes of the BRGM 1985-1986 mission. The data relate to the various formations encountered, their thicknesses, their correlations, and their depths. As well as the piezometric levels of the period of said mission and those of today. Two cross sections of N-S and E-W directions will be presented in this part (Figure 5).
The formations encountered in the city of Niamey are mainly composed of: alterite, argillaceous arena, kaolinite or kaolin clay, basement and altered basement. Kaolinite being a very impermeable rock formation, it is not encountered in all
![]()
Figure 5. Representation of geological transects.
the boreholes or is very rarely encountered but [37] then [18] described the transition between the sound basement and the Continental Terminal by alterites formed mostly kaolinite. In the city of Niamey, the altered base constitutes all the formations that do not belong to Ct3 and the sound base and it is only in certain places that the deposit of the formations of the Continental terminal 3 gives rise to an alteration in nature. Deep kaolinic acid is from the underlying crystal formations. It should be noted that there is no natural limit between these different formations.
The alteration of the base can appear in the form of two types of horizons, the first of which is most often easily distinguished. These are argillaceous or sandy-argillaceous alterites, developed on the surface over several tens of meters at the top. This horizon presents a significant interstice porosity (greater than 5% in certain granites) and a relatively low permeability. It provides a capacitive function of storing groundwater within the aquifer when it is saturated. Close to the surface, this zone can react to variations in climatic conditions and to surface inputs, natural and/or anthropogenic and lower down, the fissured horizon, whose thickness can reach several tens of meters, is made of hard rock, affected by the presence of cracks. This horizon is located between the impermeable sound rock and the surface alterites [17], on the other hand, more permeable than the alteritic level.a
The Precambrian formations are covered by the deposits of the Continental terminal. The crystalline basement is generally more or less deeply altered in contact with the clay-sandy formations of the Continental Terminal (moi-pliocene). This overlap shows the same composition on both banks of the river. The basement is made up of fractured, cracked and/or weathered rocks and sound rocks. In the absence of cracks, fractures and weathering, sound rock is downright impermeable so fluxes at depth become zero. The alterations can result from a very incomplete alteration of the basement. Apart from the granites, the basement consists mainly of green rocks, schists and quartzites which are frequently inter-stratified [14]. Under the covering of the Continental terminal, very strongly weathered fringes form and this product has a high impermeability characteristic. Sections in the wells show that under the oolites there is a thick series of practically impermeable clay [14]. Indeed, the various sections established by the BRGM show that in certain places the oolites are interposed in clayey levels (Figure 6).
[38] believe that the depth of alteration of the basement reaches fifteen meters in the city of Niamey, it can however be worth three times this value in certain places and there are also places where this fringe does not exist. It frequently happens in dark wells in basement soils that we notice the more or less total absence of the weathering fringe, as is the case in the figure below of Bangou Bi and Bangou Kirey ponds. This occurs, for example, in the subsoil of thalwegs where the fluvial alluvium rests directly on the healthy granite rock after the soft arenas have been eroded [14] or on the green rocks. The basis of Ct3 is in all the studied sectors of a clayey nature (Figure 7).
![]()
Figure 6. Cross-section of the P1 N-S geological transect of the Gounti Yéna basin.
![]()
Figure 7. Cross-section of the P2 E-W geological transect of the Gounti Yéna basin.
3.5. Geophysics
The distribution of the different profiles is shown in Figure 8. Three sites are
![]()
Figure 8. Representation of geophysical transects.
distinguished according to the longitudinal section and the two transverse sections of the basin through the TDEM soundings (Figure 8).
The result shows three types of terrain. They correspond to: 1) moderately conductive soils in the flooded area (20 - 40 ohm-m) and resistant upstream of the basin (40 - 320 ohm-m); 2) very conductive soils (3 - 9 ohm-m) and 3) very resistant soils (2000 ohm-m). The thicknesses of these terrains vary from place to place and the second court adopts the pocket structure in some places (Figure 9).
The overall estimated transmissivities are in the range of 10−2 to 10−5 m2/s [39]. In addition, all the values of the transmissivities measured in wells to the east of the city of Niamey by Favreau, 2000 in the square degree are of the order of 10−4 m2/s, these values are in accordance with our measurements obtained by RMP (Figure 9) upstream of the basin showing transmissivities varying from 3 × 10⁻5 to 2.10−4 m2/s, an aquifer level in the 1st field identified by the TDEM with low water contents (from 3% to 6%) and permeability varying from 2 × 10⁻⁶ to 1 × 10⁻⁴ m/s.
Figure 10 shows the cross section passing through the downstream flooded zone. The proximity to the surface of the clayey soil (in blue-Figure 10) is noticed at the level of the flooded zone (−10 m) in addition in this same zone
![]()
Figure 9. Cross-section of the P3 S-N geophysical transect of the Gounti Yéna basin along the main axis.
![]()
Figure 10. Cross-section of the P4 SW-NE geophysical transect of the Gounti Yéna basin passing through the downstream flooded zone.
the resistivities of the former are relatively low (of the order of 30 ohm-m) compared to on either side of the pool (more than 200 ohm-m). This difference in value characterizes the flooded area in addition to the topographic hollow (Dar_Es_Salam in Figure 10).
The Electrical Resistivity Tomography (ERT) panel produced at point SD1 (Dar_Es_Salam Survey 1 in French Sondage Dar_Es_Salam 1) in Figure 10 shows the clayey level at a maximum of 12 meters deep (Figure 11). The depth of investigation of this technique did not reach the base.
Moreover, it should be noted that where the water table is flush with the resistivities of the 1st field are low (10 - 40 Ω·m). The possibility of water infiltration is therefore limited in a shallow and poorly permeable aquifer at the edge of the sedimentary basin, which increases the risks of the water table outcropping. The areas in topographic depressions and in the most clayey soils are the most vulnerable to flooding by rising water tables (Figure 12). In this depression, the clayey level, 2nd field is located within 10 meters while it is located to the SW at 23 meters and to the NE at 28 meters (Figure 12).
The ERT panel on the point named CEG 25 in Figure 12, gives coherent and complementary results with the TDEM: Its depth of investigation has not reached the 3rd level either but gives a more precise image of the surface heterogeneities especially because it is a non-flooded sector, then one determines clayey pockets located at 5 meters before reaching the clayey level proper at 23.5 meters approximately (Figure 13).
Figure 14 shows the correlation profile of geological data with geophysical data in order to characterize the different types of terrain according to the resistivity values.
![]()
Figure 11. ERT panel produced at point SD1 in Figure 10.
![]()
Figure 12. Cross-section of the P5 SW-NE geophysical transect of the Gounti Yéna basin passing through the upstream flooded zone.
![]()
Figure 13. ERT panel produced at point CEG 25 in Figure 12.
![]()
Figure 14. Représentation du transect de corrélation géologie-géophysique.
The comparison of these results with the geology (Figure 15) shows that the 1st level identified by TDEM corresponds to more or less clayey sands of the Continental Terminal, the 2nd level to clays belonging either to the base of the CT formation, either the deterioration of the base; the 3rd level is the plinth.
4. Conclusion
The city of Niamey is currently affected by three types of flooding including slow (river), brutal (rain) floods and silent floods (due to the rise of the water table). These floods are exacerbated by heavy rains, significant population growth and
![]()
Figure 15. Geology-geolophysical correlation of a transect of the Gounti Yéna basin.
subsequent occupation of areas potentially exposed to the risk of flooding. Floods due to the rise of the water table remain today neglected and most often very poorly interpreted, while the impacts of the latter are of a health, environmental and economic nature, exposing the inhabitants of the Gounti Yéna valley to enormous risks that can go as far as loss of human life. The TDEM results made it possible to distinguish three different soil levels over the entire basin: the first soil of decreasing thickness from upstream to downstream with resistivities varying from 10 to 350 Ω·m; a second very conductive level (2−9 Ω·m) and thickness ranging from 7 to 20 m; and finally a very resistant ground of the order of 2000 Ω·m at depths varying from 10 m (downstream) to 88 m (upstream). The risks of flooding by rising water tables are linked to the presence of a clayey level which limits the flow at depth, towards the base, of water from a phreatic aquifer which is at the same time not very transmissive (3 × 10⁻⁵ to 2 × 10⁻³ m2/s) and not very capacitive (3% to 8% for all the surveys). The information collected will help to guide the decision makers to properly manage the risk of the groundwater flooding even at the scale of the city of Niamey.
Abbreviations
TDEM: Time Domain Electromagnetic, VES: Vertical Electrical Sounding, MRS: Magnetic Resonance Sounding, GY: Gounti Yéna, ERT: Electrical Resistivity Tomography.