Factors Constraining Quality Service Provision in the BRT Project in Dar es Salaam, Tanzania ()
1. Back Ground of the Study
Public transportation systems provide the most efficient means of moving large number of people in populated urban centres, ensure the wellbeing of its users, thus playing a vital role in the productivity of cities to determine individual livelihoods and national economies (Henry & Litman, 2006). This suggests that improvement of urban public transport is critical given the current rapid urbanisation worldwide that requires among other things affordable and good quality public transport services, short of which leads to economic, social, and physical isolation, especially among low-income communities in the city outskirts with inadequate access to public transport (Nkurunziza et al., 2012).
Owing to the importance of public urban transport, cities all over the world have been engaged in the development and improvement of public transport systems to facilitate easy commuting of the population from one place to the other. Big cities like London, Berlin, New York City, Vancouver, Montreal, Paris, Copenhagen, Madrid and Barcelona have developed well-organized system of electric train systems. These are fast and reliable systems used all over these cities (Nkurunziza et al., 2012). Further, the Bus Rapid Transit (BRT) has also been used to facilitate easy flow of public transport since 1970s. By 2015, around 167 cases of BRT implementation have been recorded worldwide including cities from low-income countries and Curitiba, Brazil being a case in point. In Africa, BRT has gained its root and seven cities all over the continent have implemented the project. The first system was opened in 2008 in Lagos (Nigeria) followed by six other systems in Johannesburg (South Africa), Cape Town (South Africa), George (South Africa), Dar es Salaam (Tanzania), Marrakech (Morocco) and Accra (Ghana). A review on the first bus rapid transit system in South Africa by Adewumi and Allopi (2013) noted that the BRT system is commuter friendly and cost-effective over a long distance, compared with other public transport systems because it operates at a flat rate (Adewumi & Allopi, 2013).
In Tanzania, BRT project was inaugurated in Dar es Salaam city in May 2016 to provide affordable transport system that could alleviate road congestions and frequent vehicle accidents. BRT was expected to improve the carrying capacity and reliability relative to conventional bus system. The system was expected to take care of the Dar es Salaam’s over growing population amounting to nearly 5 million that calls for extra improvement in the urban transport network (Kumar & Barret, 2008; NBS 2013).
The Government of Tanzania initiated construction of BRT infrastructure for the first phase in April 2012 and was completed in December 2015 (Tanzania Invest, 2012) and was constructed by the Austrian construction company Strabag International GmbH at a total cost of ?34 million funded by the African Development Bank, World Bank and the Government of Tanzania (Tanzania Invest, 2012). The project was planned to be executed in six phases as indicated in Table 1. The first phase of the project has a total length of 21.1 kilometres with dedicated bus lanes on three trunk routes with a total of 29 stations. Currently, the route is serviced by a fleet of 140 Chinese built Golden Dragon buses, providing express and local service for 18 hours daily from 05:00 am to 11:00 pm (Tanzania Invest, 2012). The BRT system includes roadways that are dedicated to buses, and gives priority to buses at intersections where buses may interact with other traffic; alongside design features to reduce delays caused by passengers boarding or
![]()
Table 1. Dar es Salaam BRT system phase location and length.
Source: World Bank Group, 2013.
leaving buses, or purchasing fares (African Development Bank, 2015). The BRT is run as a joint venture project between the government and the private sector. While Dar es Salaam Rapid Transport Agency (DART) is responsible for construction and maintaining of BRT infrastructures, and represents the government, Usafiri Dar es salaam Rapid Transit (UDART) on the other hand, is a private company that operates transportation services. The BRT system, operates on specially-designated infrastructure and was planned to replace the inefficient and unpredictable Daladala (usual public transport buses) characterized by lack professionalism and safety, lack of reliability, long travel times, overloading of passengers, poor sitting and standing conditions, etc. (JICA, 2008; Kanyama, 2016).
Studies conducted in Brazil indicate that apart from long term operational challenges, facing the BRT in the country, Ferranti, Andres, Denoon-Stevens, Melgaço, Oberling and Quinn (2020), the country has taken serious measures of providing high quality and satisfying services as well as better land uses along the BRT lines (mixing between commercial and residential buildings (Rodriguez & Erik Vergel-Tovar, 2018). Since the BRT inauguration in Tanzania, the system has only been operating its phase one that runs along Morogoro and Kawawa Roads as well as Msimbazi Street with a total of 140 buses. Several studies (Damayanto et al., 2018; Odufuwa, 2009; UN-HABITAT, 2010; Henry & Litman, 2006; Kombe, Kyessi, Lupala, & Mgonja, 2003; Mekuriaw, 2012; Nhudu, 2013; Nkurunziza et al., 2012) have praised the way the system has been able to phase out challenges experienced in public transportation back then. While the introduction of BRT system in Dar es Salam was widely expected to alleviate the challenges facing public transport and improve the quality of service provided in the sector, for the period the system has been running, poor service delivery by the system has been witnessed as confirmed by a number of scholars (Mapunda, 2021; Njau, 2020; Chengula & Kombe, 2017; Nkurunziza et al., 2012). Poor ticketing process, overloading of passengers, long waiting time, accidents, poor discipline by transport operators, less conducive environment at bus stops and terminals, pickpocketing to mention just a few have been cited to contribute to unsatisfactory quality of services provided by the system. The situation creates more questions than answers. How comes a system that was introduced to solve public transport related problems turns into being a problem to users? The above situation calls for a study to unveil realities as to what leads to the current situation in the BRT service provision. Hence this study mainly examines constraints to satisfactory quality service provision in the context of BRT by adopting the five dimensions used in the SERVQUAL model as propounded by (Parasuraman et al., 1988). These dimensions were used because they are important predictors of service satisfaction as used by Izogo and Ogba (2015).
2. Theoretical Framework
This work is guided by the SERVQUAL Model. This model identifies five dimensions of service quality that include reliability, assurance, responsiveness, tangibles and empathy. This means that constraints to quality of transport service can be examined against these aspects of reliability, assurance, responsiveness, tangibility and empathy (Parasuraman et al., 1988). Accordingly, reliability of service is defined as a correct technical functioning and the accuracy of a service (Parasuraman et al., 1988). A reliable service is a service that delivers what is expected, when it is expected. Reliability of a service is a measure of the degree of confidence that customers feel in using the service as well as the ability of the service to deliver as promised. This is an important element of service quality, which determines the level of passengers’ satisfaction. Provision of reliable service enables service providers to retain passengers for a long period. Under this dimension researchers focused on aspects that deterred the ability of BRT to deliver the service as promised based on the availability of the service itself on time. With regards to assurance, it has been defined as employees’ courtesy and knowledge, and their capacity to transfer confidence and trust to customers. Assurance means keeping customers informed in their native language and listening to them, regardless of their educational level, age, and nationality. Parasuraman et al. (1988) state that assurance indicates the attitudes of the employees and their behaviour, and the staff’s ability to provide friendly, confidential, courteous, and competent services. Responsiveness on the other side involves telling customers exactly when things will be done, giving them undivided attention, promoting services, and responding in accordance with their requests (Parasuraman et al., 1991). Tangibles, these are considered to be physical facilities (equipment, personnel, and communications materials). It is the physical image of the service that customers will use to assess quality (Parasuraman et al., 1991). These physical facilities are tools, and machines used in order to provide the service, as well as representations of the services, such as statements, cards (debit and credit), speed, and efficiency of service. Several factors are included in tangibles such as; external and internal appearance of bus stops, under this determinant, researchers observed bus stops conditions and infrastructures, number of seats in the buses and communications infrastructures. Finally, empathy means caring, paying personal attention, and providing services to customers (Zeithaml et al., 2000). It is a feeling of the customers that they are given priority by the organization providing services. The core of empathy is conveying the feeling that the customer is unique and special. In the context of safety, the researcher will focus on the extent to which the operators such as drivers and the conductors respond to the customers as well as the friendliness and attractiveness of the infrastructures and facilities. Based on the above discretion, this study examines constraints to customer service quality in the context of BRT based on the five components of customer service quality highlighted in the SERVQUAL Model (Parasuraman et al., 1988).
The mode has been considered fit to be applied in this study in the sense that it measures the level of satisfaction and can as well be used to determine constraints to providing the required services. The model has been used before by different scholars in studying about service quality and customer satisfaction. A study by Mbise (2015a, 2015b) used the model to determine the level of service satisfaction in higher learning institutions, and students perceived quality of services in business schools in Tanzania respectively. Moreover, Mashenene (2019) used the same model to determine the effects of service quality on students’ satisfaction in Tanzania. Mapunda (2021) used the same model to study about Customers’ Satisfaction on Bus Rapid Transit Services in Tanzania, the study only focused on how the BRT fulfils customers’ satisfaction by using the SERVQUAL dimensions. This being the fact, the model was considered fit for the study and helped researchers to go an extra mile by looking at what constrains BRT from providing services that satisfy their customers.
3. Research Methodology
The study employed a mixed methods approach to capture both qualitative and quantitative because a single dataset is not sufficient to explain the phenomena (Creswell & Plano Clark, 2011). The study used the concurrent embedded design in which the quantitative dataset was embedded on the qualitative ones (QUAL + quant) (Creswell & Plano Clark, 2011). In this design, data were collected at the same time but were joined during the results interpretation stage. Researchers worked with the sample of 100 respondents as suggested by (Nirathron, 2006), obtained by non-random sampling techniques. The sample included BRT commuters who were obtained conveniently and officials sampled purposively. This is because it was difficult for researchers to sample commuters by randomization due to the fact that respondents were only available while waiting for their busses and could easily leave as soon as they get their busses. Others, during the pilot study, could withdraw from the study as soon as they saw busses they were waiting for. Hence researchers considered convenient sampling as the appropriate sampling technique. By the use of questionnaire, interviews and Focus Group Discussions conducted with BRT commuters and BRT officials, enabled the researcher to collect the required data. Specifically interviews facilitated collection of qualitative data because of its ability to produce detailed information from the perspective of the respondent without many restrictions. Interviews conducted were guided by the interview guide, while researchers were moderators and recorded the proceedings of the sessions. For consistence, researchers ensured that all respondents were asked a similar set of questions, which only called for more probes in case insufficient information was given by the respondent(s). Interview sessions lasted up to 45 minutes for each session conducted.
The questionnaire was administered to commuters who were obtained from BRT stations. In the tool, questions regarding socio-demographic characteristics of the respondents, nature of constraints experienced by the commuters and frequencies of experiencing them were captured. A set of interview questions were administered to BRT commuters, UDART and DART officials. These aimed at unveiling what causes lags in the provision of satisfactory servicers to BRT commuters. Further, observations and documentary reviews were also applied to supplement the data. Through all these methods, information regarding constraints to customer service in the quality of the BRT were collected. Analysis of qualitative data was undertaken thematically. Under this, researchers upon recording data they transcribed them verbatim and had various sessions of reading through data with the intention of familiarizing with them. Two researchers jointly provided preliminary codes to transcribed data from which patterns of possible themes were searched. Researchers were then compelled to review their themes, assign specific names and contextual definitions to themes which were later used as findings of the study. Summarized quotations and simple extracts from this data set were reported in the findings section. To make meaning out of collected data, researchers employed MAXQDA 10 to code and determine the repeating contents. Quantitative data were obtained from questionnaire were analyzed using the mixed function of the MAXQDA 10. This was used to manipulate data in numerical forms from which frequencies, and percentages were recorded.
4. Findings and Discussions
4.1. Factors Constraining Tangibility of BRT Service Quality
First, factors impeding realisation of tangibility aspect of customer service quality was examined. As defined earlier tangibility emanates from tangibles meaning the physical facilities notably equipment, personnel, and communications materials. It is the physical image of the service that customers use to assess quality (Parasuraman et al., 1991). These physical facilities are tools, and machines used in order to provide the service, as well as representations of the services, such as statements, cards (debit and credit), speed, and efficiency of service.
Accordingly, one of the factors responsible for constraining tangibility aspect was a small number of operating BRT buses as evidenced by (90%). The same aspect was proved by the researcher’s observation who could see a number customer complaining as a result of waiting for too long at the bus stops due to extremely small number of buses compared to the number of customers who were waiting for the buses.
Shortage of busses is also justified by the existing literature which states that, the first phase of the project was supposed to have 305 buses in operation but only 140 buses were put in place (The Citizen, 2018). Moreover, some of the buses, around 140 of them were not working after breaking down due to floods that led to the severe engine damages (The Citizen, 2018). Despite the fact that the operator had planned to buy more 95 busses, however, until data for this study were collected, no new busses had been bought as anticipated.
Another factor that constrained tangibility is related to ineffective ticketing process as ascertained by 78% of respondents who claimed that procedures for obtaining tickets were too cumbersome adding that this contributed to the delays in boarding the fleets as well as arriving to their destinations. This was further evidenced by the presence of long queues of passengers especially during peak hours. Researcher also observed that the devised ticketing verification systems were not in use as deemed appropriate. Although this was a problem to BRT users, it also had economic impacts as it was not easy to accurately validate all tickets and account for the daily collections as this opens a room for corruption and use of fake tickets. Moreover, the process brings about unnecessary queuing of passengers, yet if the system was in full operation it would be convenient to board in busses.
Constraints related to complications in ticketing process are also supported by one of the daily newspaper in Tanzania which purports that for “more than five months’ ticket and card scanning systems are not working, usage of this system was providing accurate revenue collection, following manual issuing of tickets revenue has declined from 20 to 25 million up to 10 million per day” (Wetu, 2018). On a similar note, research on the Bus rapid transit projects involving the South African government and small operators (as SMMEs) (Kgaugelo, 2016) noted uses of smart card for acquiring the BRT service was problematic and that the same should be improved in order to enhance the service.
Moreover, communication infrastructures were also mentioned by 53% as an element constraining tangibility of UDART service quality. The researcher directly observed that communication infrastructure within the buses such as radios, televisions screens, as well as speakers in some stations were not in place or in good order. This response is supported by a local daily newspaper which noted that “in some cases buses no longer announce bus stops something that cause disturbances to customers more especially to blind people and those with other disabilities” (Mwananchi, 2019).
Another factor that constrained tangibility of the BRT service quality relates to routes with no BRT infrastructure as attested by 45% of respondents. Accordingly, it was revealed that there were no dedicated BRT lanes in some routes, a fact that the researcher observed. The BRT from Fire to Muhimbili Bus Stops as well as Mbezi to Kimara bus stops were running on normal trunk lanes thus missing the aspect of rapid transit as they are in these routes faced with traffic congestion. In support of these findings, the existing literature further complements that BRT system roadways is confronted with the challenge of traffic; that contributes to delays of passengers (African Development Bank, 2015). This is not proper because, the proposed BRT is designed to operate on special infrastructure and was planned to replace the deficiencies and unpredictable services of local commuter buses commonly known as Daladala which used to be characterized by lack professionalism and safety, lack of reliability, long travel times, overloading of passengers, poor sitting and standing conditions, etc. (JICA, 2008; Kanyama, 2016).
Another constraint to tangibility stated by the respondents was the absence of toilet services in most of the bus terminals as evidenced by 39% of respondents. This state of affairs was also witnessed by the researcher. Apart from the Kivukoni and Gerezani terminals, the rest have no such amenities. It was also reported that passengers up on paying for fare they were required to pay more charges if they intended to use rest rooms in stations where they are available. This was considered double payment and exclusively exploitative.
Another factor identified as constraining the tangibility of BRT service quality had to do with the interference of the BRT infrastructures and lanes in particular with other road users as evidenced by 37%. These findings further corroborate well with those obtained through the in-depth interviews where it was increasingly revealed that other road users such as cyclists, government vehicles were also using the BRT lanes something that caused frequent accidents and traffic jams (Photo 1).
Summary of factors constraining tangibility of BRT service is presented in the following Table 2.
4.2. Factors Constraining Responsiveness of BRT Service Quality
Researchers examined factors constraining responsiveness of BRT service quality. Responsiveness involves telling customers exactly when things will be done,

Photo 1. Motorcycle Accident as a result of interfering with the BRT bus routes: Source: Millardayo-TV 2018.
![]()
Table 2. Factors constraining tangibility of UDART service quality.
giving them undivided attention, promoting services, and responding in accordance with their requests (Parasuraman et al., 1988, 1991; Zeithaml et al., 2000). Accordingly, findings showed that one of the factor’s constraining responsiveness was overloading of the buses as cited by around 75% of respondents. It was reported that falling down and acquiring injuries in the process of scrambling for buses was common. One of the respondents during an interview revealed that;
Some passengers fall down,others get severe injuries,clothes get torn and our shoes got lost but none of BRT workers cares!To them this is normal (Female Worker-commuter (30), Dar es Salaam).
The above findings are also supported by some of the reviewed secondary literature. For example, a Local Newspaper reported that overloading of passengers is among the critical customer care challenges for the DART services (Wetu, 2018). This problem emanates from the fact that the DART project started with only 140 buses serving only 50,000 passengers but due to increasing demand the same number of busses serves about 150,000 to 200,000 passengers (Wetu, 2018). It suggests a solution for overloading taken by SUMATRA as extending operating hours from 0500 hrs to 0400 hrs (Wetu, 2018). From the above statements, it is vividly shown that the overloading of passengers constraining the quality of service provided by DART.
Poor communication strategies used by DART were mentioned by 25% of respondents, insisting that there were no timely updates, on change of routes and stops. They added that there were no instruction boards in bus stops as well as alerts for reminding and preparing customers for next stops. Indeed the researcher observed that automatic bus routes display bars were not working to show the bus routes. These findings are further supported by the existing literature, which states that communication infrastructure of the rapid transit buses is not functional enough, an aspect that jeopardises quality and image of the service (Mapunda, 2021).
Another factor that contributed to less responsiveness was unsatisfactory customer care and communications skills by the transport operators as evidenced by around 58% of the respondents. The existing literature (Chengula & Kombe, 2017; Njau, 2020; Mapunda, 2021) also supports the fact that lack of customer care and communication skills by the transport service operators severely impede customer service quality of the urban commuter transport. A summary of these factors and their responses is presented in Table 3.
4.3. Factors Constraining Reliability of BRT Service Quality
The study examined constraints to reliability of DART service quality. In this context reliability of service is defined as a correct technical functioning and the accuracy of a service (Parasuraman et al., 1988, 1991; Zeithaml et al., 2000). A reliable service is a service that delivers what is expected, when it is expected. Reliability of a service is a measure of the degree of confidence that customers feel in using the service as well as the ability of the service to deliver as promised. This is an important element of service quality, which determines the level of passengers’ satisfaction. Provision of reliable service enables service providers to retain passengers for a long period. Accordingly, one of the factors that constrained reliability was long waiting time as attested by around 87% of the respondents who justified that there were frequent delays to their regular destinations due to long waiting time. Due to the fact that the service is used by students and workers, it causes to delay to their colleges, schools and working places. One of the respondents here under:
Arriving at the College late is quite normal here.Sometimes we even end up missing some classes and tests due to waiting for buses for too long hours (Male Student-commuter (19),Dar es Salaam).
Existing literature supports these findings by emphasising that BRT has failed to keep time for passengers, even though one of the reasons for establishing this service was to keep time an aspect that would distinguish it from other inefficient public urban transport systems. This means maintaining international service standards, environmentally friendly services such as operating on exclusive lanes, less travelling time while ensuring safe, reliable, efficient transport would guarantee user satisfaction (African Development Bank, 2015).
Another constraint to reliability mentioned by the respondents was seasonal floods in the BRT terminals and stops like the Jangwani area as attested by 63% of the respondents. These kinds of floods severely devastate the BRT routes from Kimara and Morocco to Gerezani and Kivukoniand as a result, BRT services get
![]()
Table 3. Summary factors constraining responsiveness of DART Quality service.
Source field data 2021.
suspended even without prior notice.
It is now becoming a common phenomenon to stop BRT transport service during rainy season. Sometime this happens even without prior notice. Sometimes you just wake up in the morning and hear that the DART road at the Jangwani Valley has been closed. Therefore you have to change timetable or the rout immediately (Female commuter 29, DIT terminal Dar es Salaam 2021).
Existing literature also strongly cite the presence of seasonal floods mainly due to climate change and variability because transport inconveniences in cities as witnessed at BRT bus terminals and stops of Mkwajuni and Jangwani in Dar es Salaam Tanzania thus severely compromising the reliability of Urban Transport more specifically in those places (Kirumirah & Munishi, 2020). Similar to these findings are those of Krüger et al. (2021) who noted that floods are among the common challenges jeopardising the free flow of BTR services (Photo 2).
A third factor constraining reliability was cited as presence of unstable express routes as a tested by 42% of respondents. In the process of improving its services DART management established non stop “express” routets where by buses would be stopping only at prescided bus terminals. However, respondents elaborated that the presence of these routes are not well organised since busses are sometimes rushing with no pussengers for just a reason that it is express. Rearchers also observed that some of the buses which are dedicated for express services are not even labeled an aspect that added to the customers confusion.
A fourth factor constraining reliability of DART service quality was mentioned to be “customer behaviours” as attested by 40% of the respondents. The study revealed that some difficult customers would practice habits such as disobeying instructions, shouting and threatening DART staff as well as destruction of DART infrastructure. This aspect was further captured in the focus group discussion where some members would declare some customers shouted to the service providers in a less civilised manner. Further observation portrayed customers’ behaviour and interest to stand near doors which is a “no standing area”. This behaviour hindered entrance of other passengers as well as creating unnecessary overcrowding even when there was enough space inside the bus (Table 4).
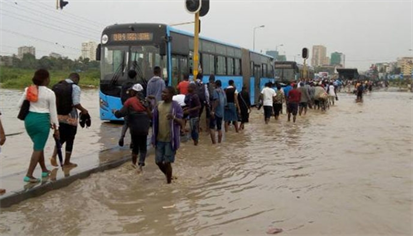
Photo 2. Floods at Jangwani area, Source: (EATV 17th 2020).
![]()
Table 4. Summary factors constraining reliability of DART service quality.
Source: Field data 2021.
4.4. Factors Constraining Assurance of BRT Service Quality
Factors constraining assurance of DART service quality were also examined n this work. Assurance has been defined as employees’ courtesy and knowledge, and their capacity to transfer confidence and trust to customers. Assurance means keeping customers informed in their native language and listening to them, regardless of their educational level, age, and nationality. A number of scholars (Parasuraman et al., 1988, 1991; Zeithaml et al., 2000) state that assurance indicates the attitudes of the employees and their behaviour, and the staff’s ability to provide friendly, confidential, courteous, and competent services.
Accordingly one of the factors constraining the realisation of assurance was theft and pickpocketing behaviour in the context of the BRT operations or rather services as mentioned by 77% of respondents. Some commuters emphasized that some of their items such as mobile phones and wallets went missing while using the service. Moreover there was an issuer of fear for contracting diseases was yet another constraint to assurance mentioned by the respondents as attested by around 63% of respondents. The respondents emphasised that they were afraid of COVID 19 pandemic while using the DART services. This is very much attributed to overloading and congestion inside the buses. Again, under assurance was attested by 23% of respondents who mentioned that UDART staff lack knowledge on customer care this is evidenced by recommendations of respondents that DART should train their staff on how to serve customers on how to deliver quality services.
Data echo those in the existing literature by different scholars (Chengula & Kombe, 2017; Njau, 2020; Mapunda, 2021) that lack of customer care and communication skills by the transport service operators severely impedes assurance as a key customer service quality in the context of urban commuter transport. Specifically, some DART staff have been noticed to perform their duties while on their phones or listening to music (Damayanto et al., 2018) (Table 5).
4.5. Factors Constraining Empathy of BRT Service Quality
This work also looked into actors constraining empathy of UDART service quality. Empathy means caring, paying personal attention, and providing services to customers (Zeithaml et al., 2000). It is a feeling of the customers that they are given priority by the organization providing services. The core of empathy is
![]()
Table 5. Summary factors constraining assurance of DART service quality.
Source: field data 2021.
![]()
Table 6. Summary factors constraining Empathy of DART service quality.
Source: field data 2021.
conveying the feeling that the customer is unique and special.
Accordingly one of the constraints to empathy in the context of BRT services was absence of first aid services as attested by 87% of respondents. Simply passengers could not access first aid service whenever confronted with some health related challengers. This include even when they got injured in the process of scrambling for the DART Bus services.
Another aspect that constrained empathy was the poor customer care services that emanated from the lack of customer care and communications skills by the BRT operators as evidenced by 63% of respondents. The respondents stated that the BRT staff used bad languages that included shouting at the customers as well as threatening them as one of the customers puts it here under:
This is complacently mad. I have mentioned it several times that some, UDART Staff are so unwelcoming more especially the ticket sellers. Even when you ask for an assistance politely, they will still not answer you in a civilised manner (Male Commuter Dar es Salaam 2021) (Table 6).
In a nut shell the foregoing section has presented findings on the factors constraining quality of service of the DART in Dar es Salaam Tanzania, by focusing on the five dimensions of service quality notably reliability, assurance, responsiveness, tangibles and empathy. Summary of these findings, conclusion as well as recommendations for addressing the above noted constraints as well as improving the existing transport services are detailed in the subsequent sections.
5. Conclusion and Recommendations
Conclusively, this study has examined factors constraining quality of service of DART by focusing on the customer satisfaction criteria based on SERVIQUAL model notably tangibility, responsiveness, reliability, assurance and empathy.
In the first place, this study established that constraint to tangibility in the context of BRT customer service quality was firstly impeded by the inadequate number of BRT buses and ineffective ticketing procedures. Other factors impeding tangibility were ineffective communication infrastructures and systems, some BRT routes not having the required infrastructures, absence toilets in some of Bus terminals as well as the interference of BRT infrastructures with other road users.
Secondly constraint to responsiveness included over loading of passengers, poor communication strategy, and more importantly, lack of customer care and communications skills by the transport operators. Thirdly reliability on the other hand was constrained by long waiting time, seasonal floods at places like Jangwani valley, unstable express routes (non-stop busses) as well as the negative customer behaviours such as not adhering to the on board rules and regulations.
Fourthly, constraints to assurance were presence of theft and pickpocketing behaviour in the buses, terminals and bust stops, fear of contracting diseases such as the COVID-19 pandemic as well as lack of customer care and communication skills knowledge by the BRT staff. Last but not the least, constraints to empathy were the absence of first aid services as well as lack of customer care and communications skills by the operators which further included the use of poor languages by the DART staff.
Recommendations
In order to overcome the above mentioned constraints and improve the existing transport services, the following recommendations should be taken into account:
· In order to alleviate constraint to tangibility in the context of BRT should invest in increasing the number of buses as well as ensure the effectiveness of ticketing procedures so as to reduce delays. Moreover, BRT should invest in the effective communication infrastructures and systems. In the same vain BRT management should ensure that all routes are having the required BRT infrastructures. To this end they should install adequate and effective social services such as toilets in all Bus terminals. Traffic police, Ministry of transportation through TANROADS should work to prevent interference of BRT infrastructures with other road users.
· Secondly in order to improve responsiveness BRT should increase number of buses as well as improve customer care in the bid to alleviate overloading of passengers, poor communication strategy, and more importantly, lack of customer care and communications skills by the transport operators.
· Thirdly, in improving the reliability BRT should increase number of buses as a way of reducing waiting time. Roads improvement and construction of flyovers will help to cope with the seasonal floods at places like Jangwani valley. Moreover, BRT should ensure that express routes (non-stop busses) are effectively utilised to reduce waiting time.
· Fourthly, assurance should be maintained through ensuring that both the transport operators and the customers adhere to all health instructions related to the COVID-19 and other communicable/airborne diseases. BRT management should maintain recommended number of passengers as well as introduce security measures such as installation of security cameras and security personnel in order to avoid challenges of pickpocketing behaviour in the buses.
· Fifthly, to promote empathy DART should ensure that first aid services are put in place as well as build the staff and operators’ capacities in terms of customer care and communications skills to avoid use of bad languages by the DART staff.
Acknowledgements
Researchers would like to acknowledge funding from LIPSINDAR project. Obtained funds were used in project setting and data collection exercises.
Appendix. Important Quotations and Extracts
Tangibility
I have been waiting for so long but only two buses have passed and both of them were full of passengers to the extent that I couldn’t board them… when will I catch another bus? It’s really a headache for me here, Oh my God!” How I wish I could have come to the bus station much earlier (Female commuter (50) Gerezani Terminal Dar es salaam).
Ineffective ticketing
I wonder how they can validate all of tickets sold to passengers manually if not scanned using a computerised system as intended earlier. I also ask myself why the process of buying tickets is no longer the way it used to be in the past. When this kind of transport was introduced, ticket selling and buying was more convenient as everything was done through computerised systems (Male commuter (25) Gerezani Terminal Dar es salaam).
Cementing the above quotation another respondent during an FGD remarked;
Am tired of queuing for tickets every day, the process causes a lot of delays to me to the extent that I am always late to deliver my products to my customers. I remember in the past I could get this service through scanning my card. This was a more convenient process back then. I don’t understand why they have declined using the cards as it used to be in the past (Female commuter (30) Mbezi, Dar es Salaam).
Absence of toilets
As you can see in some of the terminals there are no toilets. And bad enough, toilets are available in some of the terminals, but they are for pay. However, we’re wondering why the passages have to pay for the toilets even though bus fare is relatively high. Why can’t they maintain the toilets through the bus fare we pay to them? (Female commuter 57, Kivukoni Dar es Salaam).
Responsiveness
Some passengers fall down,others get severe injuries,clothes get torn and our shoes got lost but non of BRT workers cares!To them this is normal (Female Worker-commuter (30),Dar es Salaam).
Reliability
Arriving at the College late is quite normal here.Sometimes we even end up missing some classes and tests due to waiting for buses for too long hours (Male Student-commuter (19),Dar es Salaam).
Floods
It is now becoming a common phenomenon to stop BRT transport service during rainy season. Sometime this happens even without prior notice. Sometimes you just wake up in the morning and hear that the DART road at the Jangwani Valley has been closed. Therefore you have to change timetable or the rout immediately (Female commuter 29, DIT terminal Dar es salaam 2021).
Assurance
Lack of customer care knowledge by the operators may be taken as a simple issue;yet it is very important aspect when it comes to provision of good service.You see sometimes UDART staff have been serving customers while wearing headphones or being on their phones.Sometimes this. In my view this happens just due to lack of customer care knowledge.They need to improve on that (Female commuter Dar es salaam 2021).