GIS Assessment of Environmental Footprints of the Standard Gauge Railway (SGR) on Nairobi National Park, Kenya ()
1. Introduction
Transport infrastructures are some of the most essential components of the built environment. They enhance movement of goods and services and as such promote the production processes in any economy. Additionally, they are developed in space and time and as a result they tend to affect and be affected by other systems. For instance, a transport corridor developed anywhere in space will displace a given extent of vegetation cover or built-up structures in the vicinity. As such, it is required that infrastructural developments are undertaken with due consideration for the abutting natural and manmade features [1].
A majority of the countries in the developing world have taken keen interest in the need to promote harmony between the built and natural environments. They tend to develop mega infrastructural networks and blend them well with landscaped and aesthetically appealing spaces. Japan for instance, is the front runners in transport and is ranked as number one in the world for their railway infrastructure, famed for their high-speed bullet trains, which can reach up to 200 mph [2].
The African region is significantly lagging behind in the development of trade because of the challenges of globalization, predominantly because of lack of reliable and adequate transport [3]. Transport infrastructure and services have been little developed, the physical network poorly integrated, thus the existing transport facilities are completely outward-looking. No wonder Africa is termed as the valley as far as globalization is concerned. A review of 20 years of effort devoted to transport in African countries by the United Nations revealed that the existing transport infrastructure and services are still extremely far from making it possible for Africa to realize socio-economic development and integration [3].
According to United Nations [3], the most cost-effective mode of transport of moving bulk cargo for long distances over land in Africa is the railways, not forgetting their suitability for container traffic between ports and capitals. The rail system has an advantage over the other modes gained from recent economic and technological trends including higher energy prices, the growth of container stations and new increases in flows of bulk trade and traffic. However, the railways in Africa carry only 1 percent of the global railway passenger traffic and 2 percent of the goods traffic, due to very low railway connectivity. In 2005 Africa had a total railway network of 90,320 km or 3.1 km of per 1000 sq. km.
In Kenya, the transport sector is the major driver of the country’s economy; this is due to the provision of the required support to take the country to a middle-income country by the year 2030 [4]. To ensure the implementation of the economic pillar, the vision 2030 aspires to have a country firmly interconnected through a network of roads, railways, ports, airports, telecommunication, water and sanitation facilities, by prioritizing investments in the nation’s infrastructure [4].
The Standard Gauge Railway (SGR) in particular, is a transport project in Kenya involving the development of a railway line which connects Mombasa and Malaba. It was conceived and started in October 2013. Phase 1 of the SGR has been developed from Mombasa to Nairobi and is already operational [5]. Phase 2 (Nairobi to Malaba), has been divided into three phases and is yet to be constructed. Phase 2A, with its section of 6 km stretch cutting across the Nairobi National Park (NNP), passes through Naivasha to Narok. Phase 2B is from Narok to Kisumu while Phase 2C connects Kisumu to Malaba. The contractors are China Road and Bridge Corporation (CRBC, Kenya).
The project is expected to have a number of positive impacts. According to Murithi [6], a major influence on land use and development opportunities along and around the areas where the SGR will navigate is expected. Furthermore, it is envisaged that after completion, the principle of “open access” will be operationalized on the SGR, whereby local entrepreneurs will have the chance to take part in providing railway transport services by investing in locomotives and rolling stock [6].
On the other hand, it is noteworthy that the project has the capacity to have certain negative impacts which must be sufficiently mitigated against as provided for in article 42 of the constitution of Kenya 2010 [7]. An expected area of interference is the natural ecosystem [8] including animals being scared away from their natural habitats by noise [9].
2. Transport Infrastructure
2.1. Global Transport Infrastructure
Louis Armstrong famously saw trees of green, red roses too – marvels of nature that light up people’s lives and make them joyfully proclaim: “What a wonderful world”. It’s a timeless song about the present, but also the future and a subtle hope that each new generation will be better off than the last [10]. According to the KPMG global infrastructure report of 2014, infrastructure is characterized by three traits; optimism, social impact and economic value resulting in a better world that is sustained by projects that are to a great extent needed, those that are opportunistic and others that are beyond doubt visionary. In as much as we build infrastructure to change the world, it has to have a positive impact to the beneficiaries. The economic benefit should be balanced against the social need [10].
Urban mobility takes on a high priority in the form of metro and light rail developments as cities expand worldwide. China, for example, has rapidly extended its road, rail, port and grid infrastructure linking most of its cities with populations of over 200,000. The world’s largest high-speed rail system is the pride of Beijing, built using hundreds of billions of dollars. There are even ambitious plans for a China-Russia-Canada-America line that would run for 13,000 kilometers across Siberia and pass under the Bering Strait through a 200-kilometer tunnel [11]. Other exciting new innovations from China include driverless trains, the superfast Shanghai Maglev train—utilizing magnetic levitation [10].
2.2. Transport in Africa
The United Nations [3], describes transport in Africa as a very important element of development and socio-economic growth. In a fundamentally changing global environment, transport infrastructure remains a strong pillar of development since it is observed as a tool for accessing national and regional trade, accelerating growth and reducing poverty. Due to the challenges of globalization, Africa is significantly lagging behind in the development of regional trade, caused by lack of reliable and adequate transport. Indeed, the physical network is poorly integrated, with little development of the services leaving the existing transport facilities for trade utterly outward-looking [3].
The United Nations report of 2009, on the transport situation in Africa alludes to the railways as the most cost-effective mode of transport for moving bulk cargo for long distances over land, particularly container traffic between ports and capitals. The rail system has an advantage over the other modes gained from recent economic and technological trends including higher energy prices, the growth of container stations and new increases in flows of bulk trade and traffic. However, the railways in Africa carry only 1 percent of the global railway passenger traffic and 2 percent of the goods traffic, due to very low railway connectivity. In 2005 Africa had a total railway network of 90,320 km or 3.1 km of rail per 1000 sq. km [3].
2.3. Transport in Kenya
In Kenya, the transport sector is the major driver of the country’s economy [12]; this is due to the provision of the required support to take the country to a middle-income country by the year 2030. To ensure the implementation of the economic pillar, the vision 2030 aspires to have a country firmly interconnected through a network of roads, railways, ports, airports, telecommunication, water and sanitation facilities, by prioritizing investments in the nation’s infrastructure [4]. The SGR is one of the vision 2030 flagship projects whose aim is to connect Kenya, Uganda, Rwanda and South Sudan.
Phase one is from Mombasa to Nairobi while phase two is from Nairobi to Malaba. Once completed, the SGR will add to the country’s Gross Domestic Product (GDP) by 1.5% while boosting Intra-Africa trade by supporting the tourism industry and reducing the cost of transportation.
2.4. Effects of Infrastructure on Nature
According to Seiler and Folkeson [1], new habitat edges are created by the physical construction of railways and roads in the landscape. Moreover, hydrological dynamics are altered while natural processes and habitats are disrupted. The environment surrounding the transport infrastructure is often contaminated with various chemical pollutants and noise during maintenance and operation of the railways and roads. Apart from infrastructure inflicting movement barriers to most of the terrestrial animals, it also results in the death of millions of individual animals every year. Not only is there loss and isolation of wildlife habitat, but transport infrastructure also results into landscape and habitat fragmentation.
In Europe, habitat fragmentation is known as a contributor towards biodiversity decline, which occurs when natural habitats and ecosystems split into smaller and more isolated patches. Indeed, it is a major concern for the society. The principal cause of fragmentation is transport infrastructure like roads and railways. Due to transport infrastructure, habitat is disturbed and lost in the nearby environment. Movement and dispersal of many species is affected directly by infrastructure, which act as barriers to the habitat. There is also increased mortality risk for fauna caused by traffic generated by infrastructure. Species of greatest conservation concern are those mostly vulnerable to habitat fragmentation because they require large areas or strongly depend on a specific type of habitat [1].
Primary Ecological Effects
Wildlife is largely affected by infrastructure. There are five key primary effects that are caused by the mere existence of infrastructure link and its resultant traffic namely habitat loss, disturbance/edge effects, mortality, barrier, and corridor effects [1].
Habitat Loss is the unavoidable outcome from the construction of infrastructure which emanates from the physical occupation of the land under construction. Furthermore, there will be additional reduction in the amount of habitat available for wildlife due to disturbance and barrier effects [1].
Disturbance Effects are a product of pollution of the physical, chemical and biological environment during construction and operation of the transport infrastructure. A wide zone is usually affected by the toxins and noise emanating from the daily maintenance and operation activities [1].
Mortality Levels of terrestrial animals and individual wildlife linked to the traffic of the transport infrastructure are always increasing. Trains and wildlife always collide, attracting a wider public interest [1].
Barrier Effects mostly affect terrestrial animals because the animals’ range of movement is often restricted by the infrastructure, making the habitats to be inaccessible thus leading to isolation of the animal population [1] as illustrated in Figure 1.
Corridor Effect is whereby habitats along the transport infrastructure are negatively affected whereby non-native species invade well conserved natural landscapes [1].
Measures against the Effects
According to Seiler and Folkeson [1], to solve habitat fragmentation, principles of avoidance, mitigation, and compensation measures can be taken into
![]()
Figure 1. The barrier effect of a railway.
consideration. In avoidance measure, the project is abandoned or re-routed; Mitigation minimizes the project residual impacts; while habitats are created, restored or enhanced to compensate for any great losses. When planning roads, railways and waterways, the “ecological networks” concept helps in avoiding critical bottlenecks in the connectivity of habitats, hence mitigation measures are identified.
The Europeans Commission’s White Paper (European transport policy for 2001: time to decide) states that sustainability of transport is vital economically, socially, and from an environmental point of view. Environmentally friendly, safe and energy sufficient transport modes are a must. The effects of transport on biodiversity need to be deeply recognized. Biodiversity is adversely affected by land taken for transport infrastructure. During the land use planning process, transport plans should be incorporated to help push transport infrastructure away from protected areas [13].
3. Materials and Methods
3.1. The Study Area
The study area is the Nairobi National Park, located in the southern section of Nairobi County. Its geographical coordinates are 1˚22'24''S, 36°51'32''E and 1.37333˚S 36.85889˚E. It measures about 117.2 Km2 and is mainly composed of vegetation cover. It is located approximately 7 kilometres from the city centre and to the south is the Athi Kapiti Plains and Kitengela migration and dispersal area.
Nairobi National Park possesses a large and varied wildlife population. It is one of Kenya’s most successful rhinoceros’ sanctuaries, being a refuge for the migrating herbivores during dry seasons. The wildlife animals move out during the wet seasons, especially the herbivores disperse via the vital migration and dispersal areas at Athi Kapiti Plains and Kitengela. It is the main tourist attraction for visitors to Nairobi, given the diverse bird species, cheetah, hyena, leopard, lion and wildebeest and zebra migrations. It has a wildlife conservation education centre, the ivory burning site monument, the safari walks and the animal orphanage.
Figure 2 shows the location context of the study area.
3.2. Methodology
Relevant spatial and non-spatial data, based on the objectives, were collected for processing and analysis using geospatial technologies to assess the environmental footprints before and after the planned SGR on the Nairobi National Park. The data layers identified included SGR-Phase I alignment, SGR-Phase IIA alignment, Roads’ data, Rivers’ data, Boundary data, Noise prediction data, species distribution in the park, and vegetation cover types in the park. The layers were overlaid to identify the most impacted areas and spatial statistical methods applied to predict the expected continued impact over 5 years and 10 years, after which, a GIS based model was identified to solve the environmental problems and appropriate recommendations given.
3.3. Datasets and Materials
The types of data collected were determined by the objectives of the research. Both primary and secondary data sources were used. The primary data included a map of Nairobi National Park from Kenya Wildlife Service; data on the realignment of the SGR route passing into Nairobi National Park from Kenya Railways; biodiversity dispersal areas from KWS; data on wildlife migration routes from Kenya Wildlife Service; and getting data from KWS results from wildlife counts and ecological monitoring information so as to identify distribution of species in Nairobi National Park, especially herbivores.
Secondary data on existing literature about the SGR, effects of development on the environment and the study area information were sourced from publications written by diverse authors, including government documents, scholarly journals, books from the library, theses and dissertations, and papers presented at conferences. Various internet sites were accessed for relevant information. Table 1 shows the data types, their sources and characteristics
SGR-Phase I and SGR-Phase IIA alignment into NNP
The SGR-Phase I’s current re-aligned route encroaches on 87.29 ha (215.69 acres) of land of the Nairobi National Park, equivalent to 0.75% of the total park area, which is a significant portion of the wildlife habitat. Impacts related to SGR construction activities include vegetation clearance, land borrowing and filling, noise and air pollution. The design of SGR phase I is such that most of the line is built along the boundary of the park. Particularly, the SGR will interfere with the wildlife migration corridors that the animals have been used to for a long time. On the other hand, SGR-Phase IIA alignment cuts across the Nairobi National Park along a 6 km stretch, interfering with vegetation cover and species distribution within the park. Conservation has been put in direct conflict with socioeconomic interests due to political and economic priorities. Figure 3 demonstrates how the AutoCAD drawing layers from Kenya Railways were overlaid in ArcMap.
Severed Areas of NNP due to SGR-Phase I
The area that is severed by the encroachment of SGR-Phase I into the park is 32.5 hectares as highlighted in Figure 4.
The 6 Km SGR-Phase IIA Route across the Park
![]()
Figure 3. Overlay of SGR alignment on NNP in ArcMap.
![]()
Figure 4. Detailed SGR Phase 1 alignment and habitat loss in NNP.
The alignment for the SGR-Phase IIA route, which cuts across the park starts from the Nairobi South Station (DK0+00). The line enters the NNP near the East Gate of the park, crossing over the park through the savannah region in an almost straight line along a 6 km viaduct consisting of precast T-Frame girders of 18 m height along a single track way-leave of 15 m and exiting the park near NNP’s Maasai Gate. According to the ESIA report [5], the design of the viaduct is presumed to allow wildlife passage, while ensuring natural water flow in the park. The movement of tourists will also not be disturbed. In order to blend with the surrounding natural environment, the T-frame girders will be designed appropriately to reduce visual intrusion and impact as well, including acoustic noise-deflectors. The 6 km viaduct construction over the park is approximated to take eighteen (18) months in three (3) stages. The schematic diagram of the SGR-Phase IIA is outlined in Figure 5.
Vegetation Types to be affected by SGR in Nairobi National Park
Nairobi National Park harbors nine vegetation types which are very useful to the wildlife habitat in the area, especially the herbivores. These are dense tall forest, forest glade, grassland, open dwarf tree grassland (acacia depranolobium) open dwarf tree grassland (acacia mellifera), open low shrubland, open tall riverine woodland, scattered low-tall tree grassland and riverine vegetation, as shown in Figure 6 and Table 2.
Key wildlife species and potential habitat impact (ha) in the SGR-IIA route across the Park
Nairobi National Park boasts of a large and diverse wildlife population. The species that are found in the park comprise of baboons, Coke’s hartebeest, Cape buffaloes, Eastern black rhinos, hippopotami, impala, leopards, Maasai lions, Maasai giraffes, ostriches, Tanzanian cheetahs, vultures and waterbucks. Herbivores like the wildebeest and zebra use the Kitengela conservation area and migration corridor to the south of the park to access the Athi-Kapiti plains.
During the wet season, they disperse over the Athi Kapiti plains and thereafter take a refuge in the park in the dry season, thus making the concentration of wildlife high in the park, due to avoiding the dried-up areas outside the park. Along the Mbagathi river, there are built small dams which give the park more water resources compared to the outside areas, hence the high attraction of the herbivores which depend on water. A high diversity of bird species are also found in the park, with up to 500 permanent and migratory species. Birds and aquatic species have their man-made habitat in the dams in the park. Table 3 shows the various wildlife species that will be affected by the construction and operation of the SGR.
![]()
Figure 5. Schematic diagram of SGR Phase IIA cutting across NNP.
![]()
Figure 6. Vegetation types in Nairobi National Park.
![]()
Table 2. Type of vegetation affected and their Areas.
![]()
Table 3. Wildlife species affected by the SGR construction and operation.
Noise
One of the most irritating disturbances of the environment during construction and operation of the railway lines is Noise [9]. The Standard Gauge Railway is not an exception. Minimizing the impact of this “unwanted sound” called noise by any given development is very important. The units for measuring noise intensity are called decibels (dB).
During the construction of the SGR, noise levels will be mainly caused by the construction machinery and equipment like excavators, bulldozers, pile drivers plus other sources that are stationary. Mobile sources will include transport vehicles, trucks, road rollers and other light sources which can exert noise up to 10 meters from the source of production. Common construction equipment, vehicles and transport machinery have a noise intensity of 76 - 92 dB(A) in earth and stone stage, piling stage creating 90 - 109 dB(A), structural construction stage generating 70 - 90 dB(A) and decoration stage producing 85 - 95 dB(A).
Operation of the SGR will result in noise impact on the surrounding environment within a distance of 200 m exerted on both sides of the railway line. The main sources of the noise will be running and whistling of the trains, shunting at stations, departing/arrival of the trains, and frequent servicing works of the locomotives. Moreover, 30 m away from the central line of the outer rail, there is no shelter at the locations, thus noise is predicted for different lines during the day and at night, as shown in Table 4.
Wildlife Migration Corridors
The Environmental Management and Conservation Act, 1999 provides a clause on an environmental conservation order imposed on burdened land so that migration corridors for wildlife are created or maintained [14].
![]()
Table 4. Predicted noise levels for the proposed SGR locomotives.
Data on wildlife migration routes was extracted from the internet to be used as a base for digitizing the migration routes, as illustrated in Figure 7.
3.4. Data Analysis
Qualitative data was analyzed through logical reasoning. Geographical Information System (GIS) was used to analyze spatial data. The layers of the most impacted areas were overlaid. The Euclidean Distance analysis tool was applied to calculate the environmental impacts that will be caused by construction and operation of the SGR in Nairobi National Park’s ecosystem. Calculation of the area of vegetation cover that will be displaced by the construction of the SGR was done and a map of the same prepared. Spatial statistical methods were applied to predict the expected continued impacts over 5 years and 10 years. The analysis tools that were used in the research were Euclidean Allocation Analysis; Buffer Analysis; Measurements; and Graphs.
4. Results
Data was seamlessly integrated through harmonization of the various GIS datasets in a spatial environment, thus achieving a consistent scale, extent and uniform coordinate system. The issues addressed cut across problems experienced in various natural habitats in the country, where the SGR will be traversing. Overlays of the SGR alignment in the park, vegetation type, and species distribution are based on a common measurement scale.
4.1. SGR Encroachment on Nairobi National Park
The drawing obtained from Kenya Railway was an AutoCAD file which was overlaid on Nairobi National Park layers in ArcGIS and the centre line and edges of the SGR digitized for easier visualization and analysis. The resultant overlay map is shown in Figure 8.
4.2. Noise Maps
Based on the predicted noise intensity by Habitat Planners [5] for locomotives to be 64.1 dB(A) during the day and 58.4 dB(A) during the night, while 76 - 92 dB(A) in earth and stone stage, piling stage creating 90 - 109 dB(A), structural construction stage generating 70 - 90 dB(A) and decoration stage producing 85 - 95 dB(A), the study assumed the highest noise level pressure for both construction phase and operation phase for the SGR to be 109 dB(A). This was the basis on which the Euclidean allocation analysis tool was anchored for calculation of sound pressure level.
The following formula in Equation 1 adopted from Wawa & Mulaku [9] was applied:
The distance at the source, which is the SGR was assumed to be 30 metres as per the prediction in Table 4 above. Taking a distance of 5 km from the source, the commensurate sound pressure levels in decibels were calculated using the formula in Equation 1 above and the values obtained were recorded in Table 5 below.
The graph of the distance in metres verses the decibels in dB(A) is shown in Figure 9.
The SGR buffers were then analyzed using the Euclidean distance analysis tool in ArcGIS and the results in the maps in Figure 10 and Figure 11 were realized
![]()
Figure 7. Migration routes for wildlife in NNP.
![]()
Figure 8. Map of SGR overlay on Nairobi National Park.
![]()
Figure 9. Graph of distance (y-metres) verses decibels (x-dB(A)).
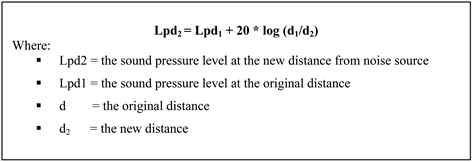
Equation 1. Formula for calculating sound pressure level at a given distance from a noise source.
![]()
Table 5. Noise level for SGR buffers based on calculations.
![]()
Figure 10. Noise map of construction and operation of SGR-Phase I in NNP.
![]()
Figure 11. Noise map of construction and operation of SGR-Phase IIA in NNP.
4.3. Affected Vegetation Cover in NNP
The buffer analysis tool was used to show the 200 m extend on both sides of the SGR line. The buffer result was clipped within the park extend to demonstrate the magnitude of the vegetation lost during construction and operation of the SGR. The map in Figure 12 displays the results: -
The specific vegetation types along the SGR path were clipped and their areas calculated in ArcGIS as outlined in Table 6 and displayed in Figure 13. The total area of vegetation loss during construction and operation of the SGR is approximately 500.61 Hectares which is approximately 4.26% of the total park area.
4.4. Migration Routes
The wildlife migration routes were digitized from existing data and the SGR-Phase I and SGR-Phase IIA alignment overlaid. The SGR-Phase IIA will in particular affect the wildlife migration routes since it cuts through the Athi Kapiti Plains as shown in the map in Figure 14.
4.5. Discussion
The overlay of the SGR on Nairobi National Park in Figure 8 illustrates that features like the rivers, dams, roads and other utilities in the park will be interfered with by all means. The natural river flow will be interrupted, the roads re-routed, while the affected dams, which are man-made habitats for birds and aquatic species, will be extinguished in the long run. Phase 1 of the SGR that is already operational has hived off a significant area of 87.29 hectares of the park, reducing the natural habitat area by 0.75%. The section of SGR Phase 2 that cuts across the park divides the habitat into two portions, thus the probability of the wild animals sticking to one side is very high.
![]()
Table 6. Area of specific vegetation loss due to SGR construction.
![]()
Figure 12. Map of vegetation affected by SGR in Nairobi National Park 5313791.
![]()
Figure 13. Map of area of specific vegetation loss in the park.
Noise pollution maps in Figure 10 and Figure 11 showed intensive noise next to the source, which is the SGR, and a reduction in the noise pressure level further from the source with increase in distance. The graph in Figure 9 further demonstrates the decrease in noise pressure level as the distance increases. Even with the noise deflector acoustics that will be installed in the design of the viaducts across the pillar, the noise produced during construction of the SGR and throughout operation will intensely affect the wild animals in the park plus the personnel and tourists who visit the park. Moreover, combined with the noise produced by the aircrafts to both Jomo Kenyatta International Airport (JKIA) and Wilson airport, the noise levels will be even higher. The aftermath is immense exit of wildlife from the park.
The immense wildlife habitat loss during construction of the SGR was well illustrated by the vegetation types affected analysis in Figure 12 and Figure 13, with approximately 500.61 hectares being destroyed. This is a very significant part of the park that will be affected hence, less vegetation for the herbivores animals whose food is reduced. The birds nesting areas will be destroyed when vegetation is cleared during construction of the SGR. Phase 1 of the SGR, which is already operational cut off 87.29 hectares of the vegetation. Furthermore, the good aesthetics of the Nairobi National Park is infringed on by loss of vegetation cover.
Many of the wildlife species in the park will be fragmented since their migration routes, illustrated in Figure 14, will be encroached on to by the SGR construction and operation. It will take the wild animals a very long time to adjust to the foreign underpasses and bridges that will be provided. Some of the animals will in the long run disappear from the park due to confusion from the goings on.
During construction of the SGR-Phase IIA, foreign species will be carried from outside into the park, affecting the resident species which can be detrimental to the entire ecosystem. As the locomotives operate on a daily basis, solid waste disposal in the park will also be high since it is difficult to control human beings on when and where to litter while on the journey.
There is high possibility of expanding the number of lines of the SGR in future since the current one is only one line. Therefore, future extended encroachment on to the park cannot be ruled out.
5. Conclusions and Recommendations
5.1. Conclusions
From the results, a demonstration of how the Standard Gauge Railway (SGR) has encroached on Nairobi National Park was achieved by use of the various GIS analysis tools. Phase I of the SGR is already operational and therefore the affected land has been fenced off from the park reducing the area of the park by 87.9 Hectares. Phase IIA is yet to be constructed but will cut across a 6 km stretch of the park with a 70 m way leave as is outlined in the schematic diagram of the SGR alignment, affecting approximately 42 Hectares.
The vegetation that was lost during construction of SGR-I and that which will be lost during construction and operation of SGR-IIA is very significant to the wild animals especially the herbivores. The dust resultant from the construction phase of the SGR is detrimental to the vegetation in the park on which the herbivores animals feed on. The wild animals and workers of the park will also be affected by the dust. The noise pollution from the construction phase of the SGR is short term but very intensive to animal habitat since animals respond to the slightest noise possible. Noise produced by the continuous operation of the SGR is a lifetime occurrence and therefore will fragment the wild animals in the park. Since the Athi Kapiti Plains are the main migration corridor for wildlife from and to Nairobi National Park, it will suffer interference due to the construction and operation of SGR-IIA.
5.2. Recommendations
The study recommends that during construction of SGR-IIA across Nairobi National Park, workers should be advised to use methods like wet-spraying of cement and wet drilling to reduce dust emissions. Water bodies like rivers and dams in the park should be protected from sedimentation during the construction of the huge railway viaduct. Moreover, the National Environmental Management Authority (NEMA) should engage the SGR construction unit to sign a letter of responsibility, encompassing the underlying principles of construction, the main tasks and the construction standards and regulations. Additionally, all the waste generated during construction should be collected and treated daily by the construction workers, to avoid littering in the park which is harmful to the wildlife species in the park. Further still, investigations of the construction sites should be conducted often to ensure protection of the environment, giving reports showing the state of the water environment, while ensuring effective protection of vegetation and animals in the area. There is need to have long-term monitoring guidelines of the wildlife and local environment put in place by KWS to permit timely improvements and provide necessary warnings in case of any problems developing. More research should be done on the best route for the SGR to avoid it cutting across the Nairobi National Park. A suitability analysis using GIS would inform the relevant institutions on the best route that is environmentally friendly.