1. Introduction
Managing a project that needs coordination of multiple activities across the organization is one of the most difficult duties a manager can take on. Numerous elements must be taken into account when determining how to coordinate all of these tasks, setting a realistic schedule, and then monitoring the project’s progress. The focus of project management is the definition of project duration and the critical tasks associated with the project [1]. The management of large-scale projects requires coordinating several activities throughout the project. Details must be put into consideration in planning and coordinating these activities. The development of a realistic schedule and the progress of the project must be monitored. Several details should be considered in planning and coordinating all the sub-activities and monitoring the ongoing concerns or progress of the project [1].
Projects usually have several activities that may be divided into sub-tasks or sub-activities and smaller workgroups called work packages. The commencement of an activity depends on the completion of some preceding activity or activities. Understanding the element of precedence in a task or activity relationship is a critical skill a project management executive needs when starting a project. This implies that setting the order of precedence in line with the life span or completion time for each work or sub-project is a prerequisite task in project planning [1] [2]. Fortunately, two closely related operations research approaches, PERT (program evaluation and review technique) and CPM (critical path method), exist to aid the project manager in fulfilling these obligations. These strategies make extensive use of networks to assist in planning and displaying the synchronization of all operations.
Traditional project decision-making techniques will not suffice; as such an approach will stymie project success. It is important to employ operations research tools in the management of projects. These tools help complement the qualitative meaning of decisions and drive the optimization of project durations in order to minimize the time and the cost of the projects. The Programme Evaluation Review Technique (PERT) and the Critical Path Method (CPM) are widely used to manage project circles and activities from conception to the close of the project. The advantage of these quantitative tools is the optimization of project duration, time minimization and project efficiency [1] [3]. Therefore, the purpose of this paper is to investigate the effect of quantitative operations research tools such as the Project Evaluation Review Technique (PERT) and the Critical Path Method (CPM) on the efficient management of projects.
2. The Concept of Project Management
Project management is the planning, organizing, directing and controlling of resources in each activity of the project in order to optimize the duration of the project activities, thereby minimizing the total project costs and time. Every project involves men, materials, money, machines, which are controllable factors; and the time of project completion is the uncontrollable factor in project analysis [4]. In implementing or executing projects, resources are committed which are limited in supply. It is the duty of the project manager to harness these resources into project sub-activities and manage the project cycles in order to achieve the project results effectively and efficiently and in a timely fashion [5]. Project management entails a variety of activities, such as initiating, planning, implementing, controlling, and closing projects for businesses and individuals. It guides individuals and organizations by giving disciplines, principles, techniques and methods to finish or complete things on time and within the confines of planned budgets [6].
The thrust of project management is effectiveness, time savings, and efficiency. To accomplish this, project managers must hire and deploy a team of highly productive workers who are committed to achieving the project’s objectives [6]. This team helps management to successfully complete the projects without committing more funds or investing more time in the project. Therefore, project management involves proper execution of project circles through management of skilled people at work [7]. Further, project management helps project teams to work at a specific time, scope and cost to complete a project within the confines of budgets and specifications [7]. In the present knowledge-based economy, project management activities are factors that add exceptional value to products and services and to everyday routine workplace activities [8].
3. PERT and CPM in Project Management
Effective project management demands optimization of the duration of the project to minimize the total project time and cost. The Project Evaluation Review Technique (PERT) and the Critical Path Method (CPM) are always employed by project managers by breaking large complex projects into sub-activities, deploying resources and managing the circles of the projects in order to minimize the total cost and time of the project [2] [3]. Hence, PERT and CPM are operational research tools used in driving project effectiveness and efficiency and these techniques can be applied to several industries or sectors, such as construction, aviation, the military, and education, including the civil government [9].
In managing projects, managers rely on PERT/CPM to provide answers to the following project-associated pertinent issues: What is the total time to complete the project? What are the scheduled start and end dates for each specific sub-activity? Which sub-activities or activities are critical and must be completed exactly as scheduled to keep the project as planned? How long can non-critical sub-activities be delayed before they cause an extension to the finishing time of the project? If the activity time is unknown, what is the probability that the project will be executed to completion at any given time? If there is a cost associated with “crashing” each activity, what is the additional cost of completing the project at an earlier time than the normal time [4] ?
PERT and CPM assist management in identifying the longest time-consuming, or consuming path through a network of tasks or activities as a basis for planning, executing, and controlling a project. The techniques help managers to optimize the longest time duration in order to minimize the total project cost and time. These tools help the project manager by guiding him/her through many stages of project management. The techniques are mathematically simplified and give critical path and slack time, provide project documentation and are very useful in monitoring project costs [7]. However, in comparing both techniques’ advantages to project management, PERT is event-oriented, probabilistic, and concerned with time only and applies to projects in which the time horizon is unknown. In contrast, CPM is activity-oriented and is a deterministic model and is used for projects that are repetitive in nature and are small in size [4] [9].
The PERT and CPM models facilitate the basic functions of planning, scheduling, and control. The planning phase separates an entire project into defined requirements for materials, manpower, and equipment. It is concerned with arranging well-defined tasks into a time sequence of performance. PERT and CPM provide management with a clear definition of time cost, an operational network that relates all activities to a time dimension, resource requirements and a method for showing critical and non-critical activities [9]. The application of these network models includes such diverse areas as the development and distribution of new products, shipbuilding, turnaround maintenance of a plant and where the timing activities require planning and scheduling of project activities.
In project management, an activity is a task that must be performed by an assigned project team. An event is a milestone marking the completion of one or more activities. Before an activity can begin, all of its predecessor activities must be completed. Project network models are an abstraction or representation of activities and milestones of projects by arc/arrows and nodes respectively. The PERT/CPM diagrams are illustrated below to show how projects are broken down into various sub-activities, and how the duration of the project is optimized in order to minimize the total time and cost of the project [4].
AOA and AON Conventions
There are two approaches in showing the activity precedence relationship in a project. These are:
AOA—Activity on Arc (AOA) This uses arrows (or arcs) to represent activities and nodes (circles) to represent events.

AOA shows the activity duration on the arc.
Event is the point in time that indicates that an activity has been completed and other activities may begin showing the precedence relationship.
AON—Activity on Node (AON) This uses circles to represent project activities and arrows to show the required sequence of precedence relationship.

AON networks are slightly easier to construct since they avoid the need for certain connecting (dummy) activities.
Below shows a network diagram, the work activities in precedence relationships indicated by arrows linking the circles.

Activity A must be completed before Activity B can begin and after Activity B is completed, Activity C can begin.
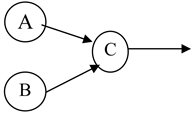
Activity A and B can occur concurrently, but both must be completed before Activity C can begin.
3.1. Project Evaluation Review Technique
Managers can have information on the time estimates of foremen, suppliers, subcontractors, and other service providers. This information also enables them to develop a central measure of completion time for a project and a measure of dispersion (standard deviation). Given the mean and standard deviation of the completion time distribution, the probabilities of finishing the project at a given due date can be estimated.
In PERT, there are three-time estimates for each activity, assuming a beta probability distribution for the time estimates. The expected time for each activity can be approximated using the following weighted average. These estimates are designated as:
a = optimistic time estimate, that is, the minimum reasonable time taken to perform an activity.
b = pessimistic time estimate, that is, the maximum reasonable time taken to perform an activity.
m = most likely time estimate, that is, the most likely time accepted to perform an activity.
As an estimate of activity completion time, the beta distribution is used, which is a reasonable approximate expression of activity duration.
The expected time te which approximates the mean, the standard deviationσ for the beta distribution is given as:
(1)
Given the mean and standard deviation of the beta distribution, the probability of completing a project at a given time may be calculated using the normal distribution. For example determine the probability that a project would be completed in a due date D.
Then
(2)
where
is the variance of individual activities on the critical path.
3.2. Critical Path Model
PERT is a probability time estimate for activities in a project. However, CPM does not involve probability but actual time estimate of activities in a project. The time estimate is determined by the estimator, who is expected to be an experienced individual. The estimator would have had a long record of similar projects in the past. For each activity, there are four-time estimates:
1) Early start (ES) is the earliest time it takes for an activity to begin. The assumption is that all preceding activities begin at their earliest possible start time; otherwise, a late start to the preceding activity will result in a late start to its succeeding activity. The ES of an activity is the sum of the time of all preceding activities on that path. When an activity has more than one preceding activity, the early start of that activity depends on the early finish of the longest duration or the activity with the longest ES time, t.
2) A late start (LS) is a delay in the start of an activity. The latest time an activity can begin without delaying the project completion time.
3) Early finish (EF) is an early start of an activity that will lead to an early finish. The assumption is that the activity begins with ES and ends with t. EF = ES + t. The precedence relationship shows that the early start of activity depends upon the early finish of its immediate preceding activity (ies). That is, ES + t = EF (Forward induction/movement).
4) Late finish (LF)—A late start to an activity will lead to a late finish. The delay in the late start of an activity resulting in the late finish of that activity should be such as not to delay the project completion time. We assume that for the last activity in the critical path, EF = LF and then LF − t = LS indicates a reverse process called Backward induction/movement. The LS of an activity is determined by the LF of the previous activity (ies). When an activity has more than one preceding activity, that is, if two or more paths converge on an activity, the path with the shortest total LS time is taken as the LF of the preceding activity or activities.
4. Methodology
An integrated review design was used in the study, which reviewed conceptual and empirical references to project evaluation review techniques and critical path methods, with a particular emphasis on work examples and analysis. Project management encompasses the processes necessary to ensure the project is completed on schedule. The procedures are as follows: plan schedule management, define activities, sequence activities, estimate activity durations, develop a schedule, and control the schedule [7].
5. Data Analysis
Deductive analyses based on worked examples are presented.
Worked Example 1
The Early Start (ES) and Early Finish (EF) times, as well as the Late Finish (LF) and Late Start (LS) times for each activity corresponding to each node representing an activity, are shown in Figure 1 [10].
Identifying Critical Activities
According to Bagshaw [4], the critical path is the sequence of activities which add up to the longest duration; it is the shortest time possible to complete the project; any delay of an activity on the critical path directly impacts the planned project completion date and there is no float on the critical path.
An examination of the completed diagram in Figure 1 will enable us to determine the critical activities. Note that for some activities, such as activity A, the early start and late start to the early finish and late finish times are identical. This means that the activity has no slack and is therefore critical. Any delay in that activity will cause the whole project to be delayed. Therefore, for those activities that have 0 total slack, the time difference between the start times and finish times is zero. These are A, B, D, G, I and K. The critical path is shown either with a thicker line or with a double line.
Total slack and Free slack
Slack or float is the extent of the period an activity can be deferred without delaying the start time of succeeding activities; it is described as the maximum time an activity can be delayed without necessarily delaying the completion of the project. This kind of slack is often called total slack or total float in order to distinguish it from several other types of slack.
Total slack for activities not on the critical path is found by subtracting either early start from late start times or early finish from late finish times. As a result, Activity C has a 15-day slack and Activity E has a 5-day slack.
Free slack represents the amount of time that an activity can be delayed without delaying the early start of any other activity.
![]()
Figure 1. Network diagram showing Early Start (ES) and Early Finish (EF) times as well as the Late Finish (LF) and Late Start (LS) times for each activity. Source: Decision analysis for managers: A Quantitative Approach, 2017. p.88 by Karibo B. Bagshaw.
Interruptive slack is the difference between free slack and total slack and represents the potential delay time beyond the free slack time, which if used will cause at least one activity to start after its early start time but will not cause the project to be delayed beyond its early finish time.
Total Slack = (Free Slack) + (Interruptive Slack) Consider Activity F, with ES = 7 and LS = 16; and EF = 16 and LF = 25; the difference between the early finish and start times, EF − ES = 16 − 7 = 9 days; or the difference between the late finish and start times, LF − LS = 9 days. Activity C can be delayed 9 days without changing the early start time for any other activity, or it can be delayed for as long as 16 days without changing the earliest project completion date (although if C is delayed more than 9 days, the early start time of some other activities will be postponed).
Activity E, on the other hand, has a total slack of 5 days, but since activity H, which follows E, has 5 days of total slack, E has no free slack at all. Interruption slack would be 5 for activity E.
Managerial Use of Slack
Information about each activity’s slack (total, free and interruptive slack) can be useful in making operational decisions for a project. If resources are in scarce supply, management may wish to smoothen the use of resources by delaying the start of some non-critical activities. Activities on the critical path cannot be postponed, but they can be terminated. In managing projects, it is advisable that decisions on the use of free slack be made central. Otherwise, each supervisor may decide to utilize the amount of interruptive slack that is not really available separately.
Crashing: Time-Cost Trade offs
Crashing is the reduction in the normal time of an activity in a project and thereby the project completion. However, it is only the critical activities that can be crashed. There is a normal estimate of the time required for each activity (and its associated cost). The crash time estimate is the shortest time that could be achieved to reduce the normal activity time of a project. The use of more workers, overtime, and more materials would generate higher direct costs for individual activities. However, shortening the overall time of the project would also reduce certain fixed and overhead expenses of supervision, as well as indirect costs that vary with the length of the project.
Worked Example 2
According to Bagshaw [10] a construction company has provided the following information for the construction of a road as in Table 1.
Assuming the project is to be completed in 45 weeks, which activities are expected to be crashed? What will be the total estimated cost in completing the project in 45 weeks?
The network diagram indicting the precedence relationship of activities with their early finish time and late finish time, is presented in Figure 2 [10].
Again, Bagshaw [10] determined the crashed time, crashed time and the average crashed cost as in Table 2.
![]()
Figure 2. Diagram showing the early event times (EET) and the late event times (LET) of each activity. Activities A; B; E; F; G; 1; and J are the critical activities and the project will normally be completed in 52 weeks.
![]()
Table 1. Activity, preceding activity, normal time, crashed time, normal cost and crashed cost of activities.
![]()
Table 2. Calculated crashed time, crashed cost and average crashed cost, with bold text indicating critical activities [10].
Crashing schedule
The crashing decision is to reduce (crash) the normal completion time of the critical activities in the project as to arrive at 45 weeks of the required time. From the solution of this problem, the normal time of completing the project is 52 weeks, thus, 7 weeks reduction is needed. The reduction will begin with the critical activity that has the least (minimum) average crashed cost.
Activity A – N5/week, for 2 weeks = N10.00;
Activity B – N15/week, for 1 week = N15.00;
Activity E – N12.5/week, for 2 weeks = N25.00;
Activity J – N5/week, for 2 weeks = N10.00;
Total crashed weeks = 7 weeks;
Total crashed cost = N60.00;
Total normal cost = N860.00; therefore, the total estimated cost in completing the project in 45 weeks = N920.00.
Summary of undertaking a new project
1) Develop a list of activities that make up the project, identify the controllable factors; and for the uncontrollable factor estimate the completion time for each activity.
2) Determine the immediate preceding activities for each activity in the project.
3) Draw a network showing the activities and precedence relationship of the activities.
4) Using the network and the activity time estimates determine the earliest start time and the earliest finish time for each activity by making a forward movement through the network. The earliest finish time for the last activity in the project identifies the total time required to complete the project.
5) Using the project completion time identified in step 4 as the latest finish time for the last activity. Note that the earliest finish time for the last activity is the same as the latest finish time. This is so because for the very last activity in a project, the earliest that activity can finish, is also the latest it can finish. Make a backward movement through the network to identify the start and latest finish time for each activity.
6) Use the difference between the latest start time and the earliest start time for each activity to identify the slack time available for the activities with zero slack; these are the critical path activities.
7) The crashing decision is to reduce the normal completion time of the critical activities in the project; beginning with the critical activity that has the least average crashed cost.
6. Conclusion
Operational research techniques are needed to manage the projects circles by optimizing the project duration so as to minimize the total project time and cost. The Project evaluation and review technique and the Critical path method are techniques used to plan the scheduling and optimal staffing of individual activities and control projects to completion within a given time. Large-scale project management necessitates managing several activities across the organization, and these tools are used to aid the step-by-step activities in a priority relationship, in order to minimize the total cost of the project by managing time and project efficiency. CPM is driven through network activities, optimizing the duration of the project, ensuring cost minimization and time of projects. Thus, they are useful tools for managing complex, small and medium-sized projects. Taking into consideration a project that has uncertain activities or an estimated start and end date for each specific activity, PERT provides management with a clear definition of time and cost, an operational network that relates all activities to a time dimension, resource requirements and a method for showing critical and non-critical activities. These tools (PERT and CPM) are now found to be useful in construction, transportation, education, and telecommunications projects. It is, however, important to note that traditional means of project management or the use of the Gant chart limit the success of project management.
7. Recommendations
Based on the investigations carried out on the application of PERT and CPM in project management, this paper recommends that:
1) In deciding between using PERT or CPM in effective project management, a project manager must identify the nature of the estimated time duration of a project, as PERT will be more effective for projects with an unknown time estimate, while CPM will work well for a project with a known time estimate.
2) Prior to commencing the execution of a project, all required resources to cover every activity must be assembled and prioritized to eliminate interruptions that could bring delay and unnecessary cost implications.
3) Policies focused on improving project execution should be implemented in developing nations to minimize the many cases of failed and delayed projects. Subsequently, stakeholders in projects must be given the right, under the law, to prosecute the government, its agencies and/or the executors of projects for failure to execute a project on schedule.