Effects of External Public Debt on Economic Growth: The Case of the Republic of Congo ()
1. General Introduction
The question of economic growth has always been one of the main objectives of government economic policy. But to achieve this, several determinants have always been mobilized (capital stock, labor, human capital, technical progress) (Solow, 1956; Becker, 1964). Since the 2000s, a particular interest seems to be put on the issue of the effects of external public debt on economic growth both among researchers and institutions (Smida & Dhrif 2016, World Bank, 2010). Thus, external public debt can be defined as the total amount of aid requested by a government from partners (bilateral, multilateral, financial institutions, financial markets, etc.) to finance development actions that could not be covered by the national budget (Traoré, 2005).
Indeed, both developed and developing countries, in this case those in Africa, over the past thirty years have experienced periods of low economic growth and high levels of external debt (Huggon, 2003; Lawin, 2009; Carton, 2014).
Theoretically and empirically, the issue of external public debt and economic growth is widely debated. Theoretically, three approaches seem to be available: the Keynesian approach, which maintains that debt represents a pillar of economic growth. Keynes (1936) as well as the liberal approach which rejects the Keynesian hypothesis (Barro, 1974). From these two approaches, a third approach seems to be emerging, the debt overengagement approach (Krugman, 1988; Sachs, 1988). Moreover, empirical work reveals the existence of two types of relationships; the non-linear relationship between public debt and growth (Cléments et al., 2003; Woo & Kumar, 2010; Guissé, 2016, Wade, 2014), and the linear relationship between public debt and economic growth (Rockerbie, 1994; Musa et al., 2013).
Nevertheless, in the context of the Republic of Congo, we note that the economic growth rate between 1986 and 1990 was negative and remained on average at −0.26%, while during the same period the external debt remained on average at 53.57% of GDP. However, during the period 1999-2003 the economic growth rate was low and remained at an average of 0.38, during which time the external debt stood at about 50% of GDP. In the years 2010 and 2014, the economic growth remains on average 5.23% while, during the same period the external debt amounted to about 20.6% of GDP (World Bank, 2016).
Theoretical and empirical comparisons and these statistics show that there is no monotony in the relationship between external public debt and economic growth. To this end, this absence of monotony allows us to raise the problem of the optimal threshold and to question the influence that the external public debt would have on economic growth in the Republic of Congo.
Thus, the main question of this work would be to wonder about the optimal threshold of the external public debt on the economic growth in the Republic of Congo. The general objective of this research is to analyze the effects that external public debt can have on economic growth in the Republic of Congo. Specifically, this study consists of determining the optimal level of external public debt in the Republic of Congo. The hypothesis that we verify in this study is that: the optimal threshold of external public debt in the Republic of Congo is between 20% - 25% of GDP in accordance with the studies conducted by Cléments et al. (2003).
In addition to the introduction and conclusion, this study is structured around four points: the first briefly presents the debt and economic growth of the Congo, the second presents a summary of the theoretical and empirical review, the third is devoted to the presentation of the methodological tools and the fourth deals with the presentation and interpretation of the results.
2. Trend Analysis of Congo’s External Debt and Economic Growth from 1986 to 2015
In this section, we will first present the evolution of Congo’s external debt, then that of the economic growth rate per capita, and finally we will trace the evolution of external debt on economic growth.
2.1. Evolution of the Debt
An examination of the curve below (Graph 1) shows a downward trend in the stock of external debt, including extremely high levels between 1994 and 1995 of 73.6% and 73.5% of GDP respectively. These high levels can be explained by the collapse of world commodity prices, particularly oil, which began in 1985. It is worth mentioning that the implementation of an Interim Poverty Reduction Strategy (approved in 2004 by the Board of Directors of the Breton Woods Institutions) enabled the country to reach the HIPC decision point in March 2006. Thus, in January 2010, the Congo was relieved of the burden of its outstanding external debt by reaching the HIPC completion point. The outstanding external debt is reduced to 17% of the Gross Domestic Product (UNDP, 2004).
2.2. Evolution of Economic Growth
Graph 2 below shows the evolution of the Republic of Congo’s economic growth from 1986 to 2015.
The graph below shows an upward trend in the economic growth rate. Despite this upward trend, there have been several periods of inflection during the period 1986-2015. The inability of the Congo to maintain continuous economic growth can be explained in part by the economies heavy dependence on petroleum products.
2.3. Debt Evolution and Growth
Graph 3 below shows the relationship between debt and economic growth during the period 1986 to 2015
The observation of Graph 3 shows that low levels of economic growth are accompanied by periods of high indebtedness, all other things being equal.
3. Literature Review
The discussion on debt and economic growth will be organized as follows: first, we will present the body of theory on the relationship between external debt and economic growth. Second, we will present the empirical work that has been done on this study.
3.1. Theoretical Review
Theoretically, there are three opposing approaches to the effects of debt on economic growth. For the first approach, known as Keynesian, debt represents a determining factor of economic growth. Debt favours the revival of aggregate demand (Keynes, 1936; Modigliani, 1961; Ando & Modigliani, 1963; Harrod-Domar, 1939, 1947 cited by Kenkouo, 2008; Samuelson, 1958).
On the other hand, the classical current considers debt as a brake on economic growth (Ricardo, 1820; Fisher, 1933; Barro, 1974; Minsky, 1982 cited by Dominique, 2016; Meensel and Nautet, 2011), all of which show that debt has negative or neutral effects on the economy.
From these two approaches, a third approach emerges, supporting the concept of debt developed by the classics and the Keynesians. The authors of this approach show that borrowing within reasonable limits can help countries to develop and strengthen their growth, hence the notion of debt overengagement
(Krugman, 1988; Sachs, 1988; Blanchard et al., 1990).
3.2. Empirical Review
This article has been the subject of several econometric researches, of which we can classify them in two main studies: the studies on non-linearity, which demonstrate the existence of a debt threshold beyond which any accumulation of debt contributes negatively to economic growth. And the studies on linearity, which stipulate that there is no optimal threshold. In this respect, debt can have positive, negative or even neutral effects on the economic environment.
3.2.1. Studies of the Non-Linearity between Economic Growth and External Debt
Indeed, Pattillo et al. (2002), in studying the relationship between external debt and economic growth in a sample of 93 developing countries over the period 1969-1998, using the Generalized Method of Moments (GMM), deduce that, as debt ratios increase beyond a certain level, which they call point A (80% to 85% of exports and 17.5% to 20% of GDP), debt ends up slowing economic growth. And from another level that they call point B (160% to 170% of exports and 35% to 40% of GDP), the overall contribution of debt becomes negative.
For their part, Checherita and Rother (2010), for a set of countries in the Eurozone, estimate that the ratio of public debt to GDP has a negative impact on economic growth in the long run at around 90% to 100% of GDP. On the other hand, Reinhart and Rogoff (2010a) by compiling data for 44 countries over two centuries with histograms using Excel software, found that the relationship between public debt and economic growth is weak below the 90% threshold. However, Herndon, Ash, and Pollin (2013) recently sought to replicate Reinhart and Rogoff’s results by directly using their data through the threshold regression model used by Hansen (2000). Once the errors made by Reinhart and Rogoff (2010a) are corrected, Herndon and his co-authors show that countries with government debt above 90 percent of GDP grow by an average of 2.2 percent, not −0.1 percent as previously suggested by Reinhart and Rogoff. In another place, Minea and Villieu (2009) sought to establish a relationship between deficits and public investment, on a panel of 22 OECD countries. Using the panel smooth threshold regression (PTSR) method for the period 1970-2006. According to these authors, above a certain amount of debt, between 50% and 90% of GDP, the debt burden would tend to reduce the positive impact of a deficit on public investment spending, this impact becoming negative when the debt exceeds 120% of GDP. Using the Vector Error Correction Method (VECM) in a quadratic form, Slimani & Bakari (2015) evaluate the effects of external debt on the economic growth of Tunisia, during the period 1970-2012 and conclude that, the optimal level of external debt in Tunisia is 51% of GDP. Similarly, Fadlallah & Chakhat (2018) in the vector error correction method (VECM) examined the threshold of external debt sustainability in Morocco based on quarterly data from 2004 to 2013, they assume that, the optimal external debt ratio is 45% of GDP. On the other hand, Égert (2012) on a panel of 48 developing countries selected for the period 1990-2013, based on the quadratic and spline approaches results respectively in a threshold of 46% and 70% of GDP.
3.2.2. Studies of the Linearity between Economic Growth and Public Debt
Despite the studies on non-linearity, Diallo (2007) during the period 1972-2005 based on the error correction method (ECM) finds that, external debt is a brake on Guinea’s economic development. Similarly, Mohamed & Salma (2015) over the period from 1990 to 2014 using the two lag VAR (vector autoregressive) method finds that, public debt is a poisoned gift for Morocco. However, Diallo (2008) in a vector error correction model (VECM) estimates the relationship between debt, investment and economic growth in South Africa for the period 1972-1998. The author shows that in the short term, public debt favors public investment, which in turn boosts economic growth.
On the other hand, Gürbüz and Raffinot (2001) during the period 1963-2000 in a methodological approach the non-existence of co-integration and the existence of a unit root conclude that, external debt has a positive effect on economic growth while internal debt exerts a crowding out effect in Turkey.
After reviewing the literature on the effects of external debt on economic growth, we draw a lesson that a reasonable evolution of debt is beneficial to economic growth, but the accumulation of a large debt hinders it, because the services of this debt generate a crowding out effect, due to the fact that resources are allocated to its payment rather than to investments or domestic expenditures that promote growth.
4. Economic Methodology
This section is structured in two parts: the first part deals with the modes of investigation, the second with the theoretical and empirical model of the effects of external public debt on economic growth, and the third with the source of the variables and the expected signs.
4.1. Theoretical and Empirical Model
To meet the objective of this study, we will regress the economic growth rate by three variables: physical capital and labor and human capital in an endogenous growth model of Solow (1956) augmented by human capital.
Consequently, we obtained a cobb-Douglass function of the form:
gdp: gdp growth rate; debt: external debt outstanding and disbursed as a percentage of gdp; debt2 : the square of external debt as a percentage of gdp; GFCF: public investment as a percentage of gdp; pop: population aged 15 - 64 (% of total population); HPop: population aged 15 - 64 (% of total population); t: the period of study (1986-2015).
This choice is justified by the fact that, the problematic of our work corresponds in part, to that used by Mincer (1981).
4.2. Source of Variables and Expected Signs
The data on which our work is based, come from the World Bank website report. The estimation period is from 1986 to 2015. The choice of this period is essentially dictated by the availability of data. The descriptive statistics of the different variables are summarized in Table 1.
5. Presentation and Interpretation of Results
This section will be organized in two points: first we will proceed to the estimation procedure and then we will present results from this model.
5.1. Model Estimation Procedure
Before estimating the model, and given that the data are time series of a fairly long period, it would be wise to analyze the stationarity of all the variables used. However, the use of stationarity is conditioned by a normal distribution of the variables (descriptive statistics).
Thus, Table 2 shows that all the variables in the model have a probability greater than 0.05, except for gross fixed capital formation. Given the number of observations, which is equal to 30, we can therefore affirm that all these series follow a normal distribution. To this end, we can carry out an econometric study.
Table 3 summarizes the results of the stationarity tests (ADF, PP and KPSS). The results allow us to conclude that all the variables are stationary in first difference.
The variables being integrated of the same order, we can then proceed to the study of their long term behavior, i.e. check if there is at least a co-integration relationship between the variables. Before proceeding to the co-integration test, it is important to determine the optimal number of lags.
Thus, the optimal number of lags being equal to 1, we then perform the Johansen Co-integration test (Table 4).
The results of Johansen’s test (Table 5) show the existence of three long-term Co-integration relationships. For this purpose, we use the vector error correction model (VECM) to estimate per capita economic growth as a function of debt stock, gross formation, openness and population growth.
![]()
Table 1. Summary of expected signs.
Source: Author based on results from Eviews7.
Source: Author based on results from Eviews7.
Source: Author based on results from Eviews7. *indicate Significance at 1%.
Source: Author based on results from Eviews7.
5.2. Presentation of Results and Discussion
This sub-section is essentially made up of two points, first the presentation of the results and second the discussion and interpretation of the results.
5.2.1. Presentation of Results
In this section, we will first present the results of the long-term model, then a short-term model and finally the speed of adjustment. The results of the model are presented in the tables below (Tables 6-8).
The variables (.) represent the standard deviation and those in brackets represent the Student’s t statistic.
After estimating the model, Table 7 shows that the coefficient of determination R2 (R-Squared) amounts to 59.88%. Moreover, Table 8 shows a recall force of −1.480416 and an absolute value of Student’s statistic of 3.02811 Thus, we can validate the application of a vector error correction model.
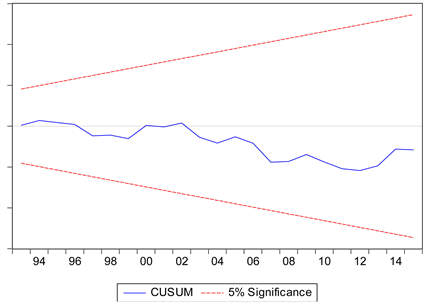
Except for these aspects, we note that the error behaved like white noise as the error autocorrelation and heteroscedasticity tests reveal that the error does not influence this model. Regarding the stability of the model, the CUSUM test (Appendix) reveals that it is stable whatever the bound. In spite of all the above, we can confirm that the model is good and stable and we can proceed to the discussion and interpretation of the results.
Moreover, Table 9 shows that the results of the residuals auto-correlation test by the residuals correlogram and the Box-Pierce statistics confirm the absence of auto-correlation of the residuals (Table 10).
Source: Author based on results from Eviews7. *indicate Significance at 1%.
Source: Author based on results from Eviews7. **indicates significance at 5%.
Source: Author based on results from Eviews7. **indicates significance at 5%.
Source: Authors based on results from Eviews7.
![]()
Table 10. Heteroskedasticity test: White.
Source: Authors based on results from Eviews7.
5.2.2. Discussion and Interpretation of Results
The application of the quadratic model led to the conclusion that the external debt has a positive and significant effect on economic growth in Congo. Thus, in the long run, if the external debt is increased by 1 percentage point, economic growth will increase by 0.17 percentage points, while increasing the debt variable 2 by 1 percentage point leads to a reduction in economic growth of 0.004 percentage points. This result can be explained by the existence of a threshold effect of external debt on economic growth in Congo. Note that debt and debt squared have the expected signs.
Determination of the optimal threshold of the long-term debt
Economically speaking, the debt threshold corresponds to the optimal debt level that maximizes economic growth. From a mathematical point of view, this is the level of debt that cancels the derivative of tpib with respect to the debt.
The determination of the optimal external debt threshold in our study is obtained by the following formula:
The optimal level of Congo’s external debt is 21.61% of GDP. From this result, we see that the hypothesis related to this study has been verified. This is because the threshold obtained is between 20% - 25% in accordance with the studies conducted by Cléments et al. (2003). Finally, the debt starts to have a negative impact on economic growth once this level is exceeded. These results allow us to draw two lessons:
6. External Debt as a Factor of Economic Growth
It has been shown in this paper that external debt has a positive impact on economic growth. Thus, debt is a factor of economic growth. These results corroborate the work of Diallo (2008) who, based on the VECM, concludes that debt positively explains economic growth. These results can also be explained in the context of the Congo insofar as, for several periods, the Congo has developed development plans and programs: 1982-1986 five-year plan, three self-adjustment programs (1985-1986, 1994, 1995), three SAPs (1986-1987; 1987-1988; 1996-1999), PRSP-I (2005-2007), Interim Post-Conflict Program (2000-2002), National Development Plan (2008-2010) and NDP(2012-2016), New Hope at the end of the year 2002 which required the financing of external debt which subsequently contributed to the economic growth of the country. These facts show that the Keynesian theory on debt has been validated in the first teaching.
7. Existence of an Optimal Public Debt Threshold
Despite the positive effects of debt in Congo, the results of threshold calculations show that the optimal level of external public debt in Congo is 21.61% of GDP. This work corroborates with the work of Krugman (1988), Cléments et al. (2003), Cecchetti et al. (2011), Fadlallah & Chakhat (2018) who support the hypothesis of a Laffer curve of debt. From then on, the relationship between external debt and economic growth will take the form of an inverted U and the probability of debt overhang becomes high once the estimated level of 21.61% of GDP is exceeded.
8. General Conclusion and Policy Implications
The main objective of this study was to analyze the effects of external debt on economic growth in Congo and specifically to determine the optimal level of external public debt on economic growth.
In order to achieve this objective, a literature search was conducted to synthesize information that would identify factors that may impact economic growth in the Congo.
The existence of an optimal level of external debt is an obvious fact that has been empirically proven without being definitively concluded.
Then, to estimate these factors, we used the Solow (1956) model augmented with human capital by Mankiw, Romer and Weil (1992). Next, we inserted debt into the theoretical model to determine its effect on economic growth. After an extensive literature review, the quadratic method was used to account for the non-linearity between external debt and economic growth.
GDP per capita growth was chosen as the explanatory variable, long-term external debt (outstanding and disbursed) as a percentage of GDP as the explained variable, and gross fixed capital formation, labor, and human capital measured by the number of students enrolled in primary and secondary school as the control variable.
The results obtained from the estimation of the VECM model of the relationship between debt and economic growth led to the conclusion that there is a positive impact in the long term between economic growth and public debt up to the threshold of 21.61% of GDP, beyond which any accumulation constitutes a brake on economic growth. On the other hand, in the short term, public debt has no direct impact on economic growth.
Thus, we can say that our hypothesis asserting the existence of an optimal level of public debt has been verified. In the current context, the results obtained represent an additional argument in favor of implementing ambitious debt reduction strategies. If policymakers leave debt levels high, fears of measures will be unpopular with voters, damaging the prospects for economic growth.
The results obtained throughout this work imply a number of policies. Thus, in order to improve economic growth, political and public authorities should set up relevant strategies. For this purpose, we make the following recommendations:
➢ We suggest the implementation of a recovery policy based on debt. To this end, the Congolese government must resort to external debt since it contributes positively to its economic growth. And, allocate it to productive investments adapted to the needs of the nation and direct it to the sectors that bring economic growth (education, health, infrastructure...).
➢ We also suggest that the government establish an effective national committee to monitor the external debt ratio and debt management. The monitoring committee should formulate a fiscal policy that includes the public debt ratio of 21.61% of GDP as a priority and urgent objective to be implemented.
However, this article seems to have some limitations that we can cite:
➢ The study did not take into account certain institutional variables that can have an influence on economic growth. These are: political stability, good governance of the state, the regularity of the institutions of the republic... Ideally, they should have been included in the regression model to see the influence of each of these factors in the regression model.
➢ The failure to take into account total public debt (external public debt and domestic public debt). It was necessary to insert it into our empirical model to detect its influence on economic growth and to compare its threshold to the CEMAC threshold.
It should be noted that the limitations mentioned above do not call into question the validity of the results. Given that the issue of debt management is an institutional one, it would be interesting to study this topic within the CEMAC framework.
Appendix: CUSUM Test