1. Introduction
Burnout is a term first used in the 1970s by Herbert Freudenberger, Ph.D., a Psychoanalyst and Psychologist (Freudenberger, 1974, 1975, 1977). Today, Burnout is interchangeable with mental exhaustion syndrome and can be defined in having a psychological depletion as a result of chronic work-related stress, depersonalization and emotional exhaustion, personal accomplishment and engagement (Koopman et al., 2002). Since Freudenberger’s (1974) and Maslach’s (1976) pioneering work, burnout has become a major topic of research throughout the world. Koopman et al. (2002) and Michelsen and Thorsteinsdottir’s (2010) work in identifying relationships between engagement, motivation, stress, defense routines, and presenteeism is groundbreaking when it comes to preventive measures. Moreover, research in more than 4550 studies have linked work stress to lower levels of wellbeing and engagement (Cotton 2003; Levi et al., 1999); few studies (Burke & Mikkelsen, 2006) have empirically examined the association between self-expectancy and external demands in relation to burnout. Michelsen and Thorsteinsdottir (2010) measured the relationship between stress, motivational adaptiveness and engagement of personnel at Rexam, now Ball Corporation, in Sweden; Koopman et al. (2002) introduced the Stanford presenteeism scale in relation to the health status and employee productivity; and Seppäla & Moeller (2018) showed how burnout is commonly associated to conflicts between individual self-expectancies and demands.
There are many retroactive models and measures claiming to diagnose burnout today. Many of the above mentioned use symptomatic questions that lead to a diagnosis. However, preventing employees from reaching a diagnosis of Mental Health Exhaustion or Burnout is not only ethically necessary for sustainable human resources, but also just good business management sense and it provides continuity and provides companies with a practical address prevention instead. According to Seppäla & Moeller (2018) prevention methods can produce an ROI of $5 for every $1 spent.
2. Background, Workplace Mental Health and EFP Risk Analysis for Burnout
In the UK, a sixth of workers experiencing a mental health problem at any one time (McManus et al., 2016), and a direct connection between stress, anxiety and depression is thought to be responsible for almost half of working days lost in Britain (HSE, 2019) and more than 50% of sick leave days in Sweden. Skandia Insurance reported that there was a 25% increase of workplace related mental ill-health in Sweden, in just 9 years (Skandia, 2019), and also acknowledging that the relationship between mental health and the workplace is a complex one. As a consequence, finding reliable occupational health tools to proactively measure, identify mental health risks, and prevent causes and conditions that lead to burnout.
There are many highly stressful occupations today and exhaustion is not particularly exclusive (Seppäla & Moeller, 2018) to any one group. Nonetheless, Deloitte also estimated the costs to employers of poor mental health across employees in different age groups. They found that costs increase up to the age 30 - 39 as earnings potential grows, peaking at £2,068 per person (Seppäla & Moeller, 2018). Graph 1, in that same report, Business in the Community (BITC) has shown that work-related mental health problems are caused largely by increased pressure (52%) and workload (36%), lack of support (35%), and others.
Psychological pressures experienced are dependent upon possessing adequate coping skills to address self-expectations with demands and wellbeing (Michelsen, 2019). Additional evidence supporting this have shown high levels of stress
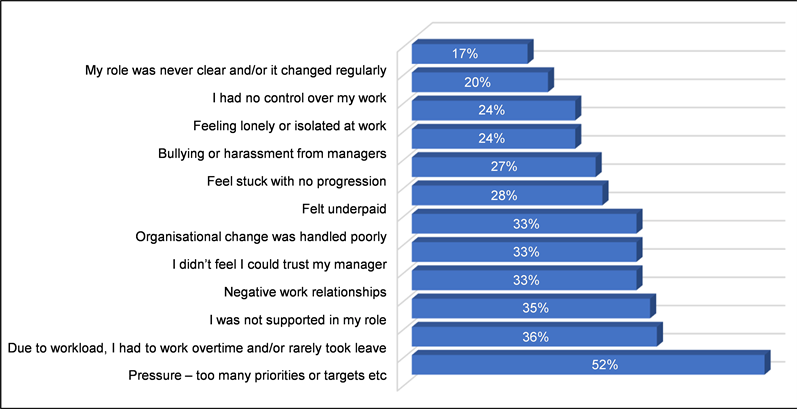
Graph 1. A mental health at work study (BITC, 2019) in the UK found that 52% of employees felt time pressure and workload to be a problem affecting mental health. All of the above questions in the Deloitte study are represented in some format within the EFP Batch of Assessments.
and burnout experienced by teachers (Seppäla & Moeller, 2018; Cunningham, 1983; Kyriacou, 2001; Seidman & Zager, 1991). Burnout was also associated to such variables as job satisfaction (Kantas & Vassilaki, 1997), poor working conditions and time pressures (Abel & Sewell, 1999), conflict between external demands facing an individual and their self-expectations (Michelsen & Thorsteinsdottir, 2010; Seppäla & Moeller, 2018) and more. Research shows that mental health exhaustion (burnout) is high among teachers who felt that their jobs were very demanding and low in control (Santavirta et al., 2007). Studies also suggest that many with burnout suffer from related mental health problems, anxiety, depression, and emotional exhaustion (Unterbrink et al., 2007; Naring et al., 2006).
In the UK, the Deloitte report suggests that poor mental health costs employers £45 billion and that poor mental health has increased by 16% from 2017 (Deloitte, 2020). Presenteeism, those employees deciding to be present at work even though they exhibit psychological ill-health, costs 4.11 times actual absenteeism costs (Deloitte, 2020).
The World Bank and World Health Organization United suggested (WHO, 2017) that mental health should be a global development priority as costs are estimated to reach $1.670 trillion annually (Mnookin, 2016). If global employment is estimated that 44% (ILO, 2020) of the population then mental health companies bare approximately $738 billion in mental health related costs annually, excluding presenteeism.
3. Measuring Burnout
The Maslach Burnout Inventory or MBI (Maslach & Jackson, 1986) is one of the most widely used instruments to measure burnout; nonetheless, some conceptual and methodological complications regarding this inventory have been identified. Since MBI is used retroactively and only after one is suspected of having burned-out, the associated burdens of mental ill-health and costs are already assumed. Critics have therefore advocated for the development of alternative burnout measures (Cox et al., 2005; Halbesleben & Demerouti, 2005) due to the limitations regarding the measurement and accuracy of the depersonalization and personal accomplishment scales.
The Copenhagen Burnout Inventory (CBI) was designed to overcome the limitations of the MBI and it was developed as a study to investigate burnout among social workers in Copenhagen (Kristensen et al., 2005). CBI is a 19-item questionnaire with some assessment modifications of up to 22 questions measuring three burnout sub-dimensions. The CBI personal burnout scale has six items measuring degrees of physical and psychological fatigue as well as exhaustion experienced by a person regardless of their participation in the workforce. Like the MBI, the CBI is a retroactive tool. The work-related burnout scale has seven items and measures the degree of physical and psychological fatigue related to work. The CBI scales have shown acceptable reliability and criterion-related validity in studies conducted in Danish and Australian samples (Kristensen et al., 2005; Winwood & Winefield, 2004). In these populations, the three burnout sub-dimensions were negatively correlated with vitality, mental and general health, job satisfaction, sickness days, sleeping issues, use of pain-killers, intention to quit the workplace, and absenteeism.
As a generic but retroactive burnout scale for the general population, the CBI is a well-tested inventory. Nonetheless, assessing a complex occupational health environment, like the EFP batch of assessments does, can become rather challenging task with the retroactive limitations of the CBI, not to mention, its lack of continuity and inability to monitor an individual or company aggregate data and historical deviations over time (Michelsen & Thorsteinsdottir, 2010).
The Empowerment for Participation (EFP) assessments measure individual motivation, stress, defense routines, and perpetual motivation positioning (seven environments: knowledge, external demands, social, health & safety, self-expectancy, openness and self-esteem) in order to gain a composite understanding of the situational environment facing an individual (Michelsen, 2008, 2019, 2021; Michelsen & Thorsteinsdottir, 2010). The EFP Risk for Burnout (EFPRB) extracts selected questions from the battery to provide a risk assessment level for burnout. In order to avoid psychological and central tendencies and to increase reliability and validity, individuals taking the EFP assessments are not asked to take a burnout assessment, but rather, they are asked to take the EFP Batch of assessments in regard to their general wellbeing of self within their general situational environment. The EFP Risk for Burnout (EFPRB) assessment is compiled from thirty (30) questions embedded within the 110 EFP assessment questions. These measures include four subcategories related to symptomatic (physical and psychological), depersonalization, self-expectancy and external demands and have been shown to be highly accurate. Risk assessments for General Anxiety Disorder (GAD) and workplace related Depression are also extracted from the EFP batch of questions, however, these will not be discussed within this framework and study.
Burnout emerges when external demands facing an individual conflict with their own self-expectancy and outstrip a person’s ability to cope with stress (Seppäla & Moeller, 2018). In order to proactively measure and identify the slippery slope leading to Burnout, a causal perspective needs to be added into the World Health Organization’s guidelines for burnout diagnostic code: ICD-10-CM Diagnostics code Z73.0 (Michelsen, 2019).
4. The Present Study
This Burnout study is part of a broader project investigating proactive occupational health in regard to engagement, presenteeism, and the general health and wellbeing of employees using the EFP batch of assessments. The purpose of this study is to address the reliability and validity of the EFP Burnout Assessment to proactively identify the various risk levels leading to burnout.
The advantages of proactively identifying and preventing employee Risk for Burnout are obvious, however, it is a vital step forward for sustainable health and wellbeing of employees, workplace productivity. The aim of this study is to collect, analyze and disseminate accurate and comprehensive information on the occupational health and wellbeing of employees in relation to their individual Risk for Burnout, the reliability of the measure, and its validity.
The reliability and validity of this report connects the theoretical constructs of proposition to logical variance distribution providing meaning and relevance to the relationship between the measurable variables of those constructs.
The aim of this study is to collect, analyze and disseminate accurate and comprehensive information on the reliability and validity of the EFP Burnout as a measure to proactively monitor and proactively sustain engagement and prevent Burnout within the workplace.
Prediction requires only correlations, but in contrast, explanations require causations. Given the importance of environmental variables and continuity, this study will also examine whether there are any gender and age bivariate convergencies or divergencies. The reliability and validity of the distribution risks will assist to construct correlations between the various levels and the understanding of identified cause-effect relationships. This paper reports the results from three Swedish companies within a certified Company Healthcare and Rehabilitation provider in Sweden. The four companies studied herein prided themselves on the health and wellbeing of their employees.
The study specifically examines the internal consistency and homogeneity of the EFP Burnout, its reliability and construct validity.
Given the importance of environmental variables and continuity, this study will also examine any gender and age correlation or differences in the EFPRB measure, the use of medications, and any stress or burnout related diagnoses. This paper reports the results from a number of Swedish companies within the My-E-Health company care program. My-E-Health is a registered and certified Company Healthcare and Rehabilitation provider in Sweden.
5. Method
5.1. Participants
Graph 2 shows the age distribution (N = 69) employees from three companies and two within the unbound category (an employee not bound to a specific company) participated in this study. Ages ranged from 26 to 62 (M = 43.36, SD = 9.253, Minimum 26, Maximum 62, Range 36, 37.00 at 25 percentile 43.00 at 50 percentile and 51.00 at 75 percentile).
Table 1 shows gender participation. There were 30 males (Percent = 43.5) and 38 females (Percent = 56.5) in this study. At the time of their assessment, employees had been working at their specific positions from 6 months to 15 years. However, a counselor did forget to ask five individuals the internal validation questions. Some employees had taken the assessments multiple times or on a quarterly basis during the assessment period.
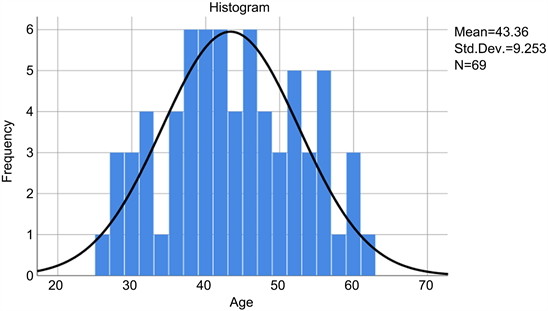
Graph 2. A distribution curve and histogram to showing age frequency and homogeneity for N = 69.
![]()
Table 1. Shows an acceptable gender frequency.
5.2. Instruments
Figure 1 shows how the Visual Analog Sale (VAS) is used in the EFP assessment battery. The battery consists of five (5) sub-assessments. All assessments are scored using the same type of scale, consisting of a straight line with a beginning and end point, for example, Very Good - Very Poor. As the slider moves from left to right, the text positioned at either end of the line increases as the opposite end decreases. The position where the slider stops is represented by a number from 0-20. The slider can be moved in either direction and in accordance with how the assessed feels in regard to that specific question. In order to minimize clustering of points around a preferred numeric value or description as used by Likert-type assessment scales, no visible numeric values or intermediate points are visible or seen by the assessed. The Journal of Behavior Therapy and Experimental Psychiatry showed that VAS-A scales used below enable simple and rapid assessment of state of anxiety and exhibit superior psychometric properties (Abend, 2014).
The EFP Assessment battery consists of four separate assessment are as follows:
Motivation Assessment—MA Assessment consists of 20 VAS-questions and aims to show at what level the individual’s motivation lies in areas such as transparency (openness), meaning, identification, balance, teamwork, stimulation, self-esteem, participation and engagement amongst others.
![]()
Figure 1. Shows an EFP and EFPRB question measure using a VAS with hidden values to minimize cluster tendencies. The button can be moved in either direction, either left or right based-upon how an individual may feel and the scale variables increase/decrease proportionally.
Stress Assessment—SA Assessment consists of 20 VAS-questions and aims to show at what level the individual’s stress level is by measuring a number of stressors and symptoms in areas such as communication, knowledge, conflict, justice, values, safety and health in the workplace.
Defense Routines Assessment—DA Assessment consists of 20 VAS-questions. The purpose here is to get a mapping and understanding of an individual’s defense routines and the ability to participate effectively and openly. The concept of defense mechanism drives from Freud (Freud, 1923) where more difficult-to-handle associations are considered to exist in the so-called primary process (subconscious process), usually considered as an antagonistic relation to the secondary process (conscious processes). Rather herein, the DA Assessment uses Neisser’s (1967) redefinition of these processes, where they are not perceived as antagonistic but instead as essential to each other. This suggests that the secondary process is given opportunities to process primary material through an appreciation of the routines that the individual creates as a defense. According to Senge (1990) and Michelsen and Thorsteinsdottir (2010), defense routines are habits created to protect us from threats to our self-image and identity. Therefore, these routines provide protection for our deepest assumptions. The DA assessment aims to measure these routines in areas such as guilt, flexibility, forgiveness, communication, conflict, control and rationality.
Perpetual Motivation Positioning—PMP Assessment consists of 50 VAS-questions, divided into seven sub-scales, namely 1) knowledge, 2) external demands, 3) social environment, 4) health & safety, 5) self-expectations, 6) openness, and 7) self-esteem. The purpose of the assessment is to gain an insight into a person’s engagement, boundaries, participation and adaptability, trust, creativity, openness and more.
5.2.1. EFP Risk for Burnout (EFPRB)
All 30-questions used within the Burnout inventory are extracted and complied from the four EFP batch of assessments mentioned above. There are four sub-dimension measures, namely 1) external demands, 2) self-expectancy, 3) depersonalization, and 4) symptomatic. All questions are VAS formatted with values from 0 - 20 and a total accumulated score from 0 to 600. The purpose of the risk assessment scale is directly associated to the preventive care and proactive CBT used to address any identified trends or associated risks. Since My-E-Health is a registered Company Healthcare provider, this EFPRB measure has served as proven its reliability and validity in preventing workplace related psychological ill-health.
5.2.2. Six EFPRB Burnout Levels
There are five risk levels of Burnout in the EFPRB assessment: Risk levels are provided in relation to the total score or the mean score following a lineal guide: 0 - 99 points (M = 0 - 3.300) = No evidence of Burnout, 100 - 199 points (M = 3.333 - 6.6333) = Low risk for Burnout, 200 - 299 points (M = 6.6667 - 9.9667) = Moderate risk for Burnout, 300 - 399 points (M = 10.00 - 13.300) = High risk for Burnout, and 400 - 600 points (M = 13.3333 - 20) = Burnout.
Clinical treatment and sick-leave are recommended for individuals assessed to be “Burned-out” and they are immediately placed into the company rehabilitation program. Individuals fluctuating between the lower two categories (No Evidence and Low Risk) required no additional care and continue with their normal quarterly feedback sessions with their Health Coaches. Individuals that test in the “Moderate Risk for Burnout” category enter into a modified online rehabilitation program to address identified concerns and receive the necessary guidance to build the needed coping skills to address said issues. Employees falling into the Moderate Risk for Burnout enter into an individually designed proactive rehabilitation program to include: Cognitive Behavioral Therapy, Acceptance Commitment Therapy, floating, mindfulness and other activities to reduce their risk level and to build internal resilience.
Figure 2 shows Risk Assessment levels as seen in the graphical meter below. All individuals are asked two specific questions about whether or not the Risk for Burnout results shown are true to how they feel. The answer is followed-up with an additional validity question related to the accuracy of the scale.
5.3. Ethical Statement, Procedures for Assessment Collection and Data Analyses
Ethical approval was received from the University of Lund ethics committee.
Data was extrapolated from organizations in the My-E-Health program. All employees had agreed to co-ownership of the data and to participate in research. All individuals have approved our GPDS regulations and responsibilities and are currently or were members of our Company Healthcare program. Sixty-nine (69) employees took 113 batches of EFP assessments, however, for the purpose of this paper only the first assessment for each will be used. Employees were informed about ongoing research and the objectives of the studies, anonymity and confidentiality of the survey.
Since all assessed individuals entering into the My-E-Health EFP platform are unknown (as little information was known about them prior to them taking their assessments, no pre-qualifications or demographics are applied to entry or
![]()
Figure 2. EFPRB graphic representing a numerical value (current & historical) on a scale illustrating the degree of Risk for Burnout by an employee. Dark Green = No evidence, Light Green = Low Risk, Yellow = Moderate Risk for Burnout, Orange = High Risk for Burnout, and Red = Burnout.
their results, and no individual categorization or adjustments are made) they should be considered one large cohort. There is only one contingency, all assessed persons within this study were fulltime employees. All assessments were subjective and were purely based upon how the individual interprets their own situational environment, health and wellbeing. Personal data is strictly kept private between the individuals and their counselors/caregivers. No information was made available to employer organizations other than aggregate data.
This study evaluates both the reliability of the assessments to provide consistent data and the validity to delivery useful values. The validity of the EFPRB was internal and external and not based upon prior information. No previously reported information for this measure was available, separate confirmatory factor analyses was first performed after the batch of assessments was taken and only during the feedback session, one to one with a counselor, and only after the Risk for Burnout scale was presented to the individual.
5.4. Reliability and Validity Construct
Reliability was constructed using SPSS’s statistical reliability in the thirty (30) Risk for Burnout questions, and the Validity construct was in two parts, an internal and an external part. Statistical consistency measures were conducted using an inter-item correlation matrix and the mean values using a Cronbach’s Alpha, an ANOVA with Tukey’s Test for Nonadditivity and an Intraclass Correlation Coefficient.
The internal validity was constructed around five validity questions related to: their results, the accuracy thereof, any use of anti-depressive or other related medications used and any psychological related diagnosis. Validity results (received during feedback sessions) were noted in the individual’s journal by the counselor and kept strictly confidential. Validity questions were asked during the feedback session and only after the Risk for Burnout graphic (Figure 2) was shown to the individual. Results were documented in each individual’s journal. The counselor was required to ask each individual two questions. The first question was dichotomous in nature with a “yes” and/or a “no” reply to “Is this how you feel?” and when shown a graphical scale represented by their scores (Figure 2). The second question followed-up on the answer by asking them to, “Grade how correct or accurate the EFPRB Risk for Burnout is on a scale from 0 - 10.”
The external validity construct was limited in scope, but specifically designed to correlate real-life correlations between any psychological diagnoses and/or medical prescriptions (behavioral medications like Benzodiazepines or Serotonin Reuptake Inhibitors, Amphetamines, and others) were used by individuals and answers correlated to their EFPRB Risk for Burnout scores.
6. Results
1) Table 2 shows Cronbach’s Alpha is a measure of internal consistency related to a set of items in a group and is considered to be an important measure of scale reliability. The thirty EFPRB questions received an excellent α = 0.929.
a) Reliability using ANOVA with Tukey’s Test for Nonadditivity
Table 3 shows a nonadditivity assessment provides a singular value decomposition to study interactions in two-way layouts (Goodman & Haberman, 1990). The nonadditivity analysis supports the α = 0.929 reliability as it describes
![]()
Table 2. Cronbach’s Alpha Analysis shows an excellent statistical reliability.
![]()
Table 3. Analysis using ANOVA with Turkey’s test for nonadditivity.
Grand Mean = 5.17; aTukey’s estimate of power to which observations must be raised to achieve additivity = 0.230.
of the nature of the interactions rather than whether they do or do not exist. The model assumes that the matrix of interactions has rank 1, so in a singular value decomposition of the interactions, only one singular value is not. This analysis shows that nonadditivity is statistically significant p < 0.001.
b) Intraclass Correlation Coefficient
Table 4 shows good average measures using the Intraclass Correlation Coefficient. As the EFPRB is a Multirater instrument measuring sub-groups of information from depersonalization to symptomatic, external demands and even self-expectations, an average measure using an intraclass correlation for reliability was considered important. Results below show excellent average measures of 0.928 with a Lower Bound CI > 0.90 and statistically significant p < 0.000.
2) Validity
Correlations between EFPRB assessment levels (N = 69) and the percentage in each Risk for Burnout level (Table 5) were compared to internal validity questions, measuring correctness in level and accuracy, prescription use and a psychological related diagnosis (Table 6) revealed a statistically significant correlation between a high risk for burnout on the EFPRB scale and prescription use and or a current/previous diagnosis.
Table 6 shows the Correlation Coefficient using Kendall’s tau_b and Spearman’s rho to analyze medical prescription use (SSRI anti-depressive) with any mental health diagnosis or treatment for stress or burnout. The below tables show a significant 2-tailed p-values using Kendall with a p < 0.030, p < 0.001, and Spearman’s rho with a p < 0.028 and 0.000.
Three individuals were on anti-depressive medications for burnout and depression (Table 7) of which one had been hospitalized (for three days) eight months earlier. Analysis showed that all three that were taking anti-depressive medications also scored a “High Risk for Burnout” in the EFPRB assessment. The single individual taking Amphetamines (for ADHD) scored in the “Moderate Risk for Burnout” category and was struggling with coping strategies to control workload and exhaustion. Internal Validity confirming that individuals agreed with the Risk for Burnout analysis (Table 8) and the Accuracy of the Risk for Burnout value (Table 9) confirmed an excellent at 91.2% validity. Using this strategy to validate the EFPRB measure and correlation proved to be statistically significant to confirm validity and no further steps were deemed to be necessary.
![]()
Table 4. Intraclass correlation coefficient needed to provide EFPRB assessment.
Two-way mixed effects model where people effects are random and measures effects are fixed.
![]()
Table 5. A frequency table showing risk levels and percentages for the N69 participants.
![]()
Table 6. Correlation between risk for burnout, anti-depressive use and a diagnosis for stress or burnout.
*Correlation is significant at the 0.05 level (2-tailed); **Correlation is significant at the 0.01 level (2-tailed).
![]()
Table 7. Table showing the relationship between the risk levels for Burnout in association to medical prescription use and a diagnosis related to mental health.
![]()
Table 8. Table showing the Yes/No question results.
![]()
Table 9. Table showing how the individual assessed felt in regard to the accuracy of the assessment provides an M = 91.2% accuracy in validity.
7. Discussion
The present study indicates that the EFP Burnout Inventory (EFPRB) is a reliable and valid measure to assess the Risk for Burnout in employees. This paper is the first to assess the reliability and validity of the EFPRB in a sample of sixty-six (69) employees, and among the first to extend the validation of the EFPRB beyond the original study. These findings support the use and applicability of the EFPRB measure in broader contexts than originally proposed and for use for independent practitioners, counselors and professional coaches to identify risk for burnout and even engagement (Biggs & Brough, 2006). Moreover, findings also addressed a gap in the literature by introducing the EFPRB as a precise and continuous measure for burnout risk assessment and for use in occupational wellbeing. As the EFP batch uses both causal, current and historical measures to track individual results, individual mean scores and deviations provide an improved reliability and validity over other static measures.
Graph 3 shows good distribution variances for the EFPRB representing multiple levels of risk for burnout across all represented types of job types. All of the High Risk for Burnout scores identified by the EFPRB assessment, were or had been previously diagnosed with burnout and were currently on anti-depressive medications. Feedback sessions with individuals ascertained that lower the scoring EFPRB values (No Evidence and Low Risk for Burnout) showed no anti-depressive use and no previous mental health conditions. EFPRB reliability was found to be excellent with a Coefficient Alpha of >0.929 and an internal validity score of 91.2% suggesting that the EFPRB assessment is both reliable and viable as an instrument to identify individual Risk for Burnout.
Negative correlations between the EFPRB or (burnout) and wellbeing are evident and no clarification is necessary (Cunningham, 1983; Kyriacou 1987, 2001; Kyriacou & Sutcliffe, 1977; Salo, 1995; Seidman & Zager, 1991). In Table 10, however, this study did find another significantly related difference related to age and gender in working adults. Table 11 shows a T-Test measuring the differences between Gender, Age and the Risk for Burnout which also confirmed no statistically significant differences in Burnout were found in gender nor age.
Other more well-established measures of burnout (i.e., Maslach Burnout Inventory & the Copenhagen Burnout Inventory) could benefit from additional research using the EFPRB measure. Notwithstanding these limitations and the relatively small sample size in this study, the findings regarding both the reliability and validity of the instrument are outstanding. Consistency supports the use of the EFPRB to assess Burnout in Occupational Health.
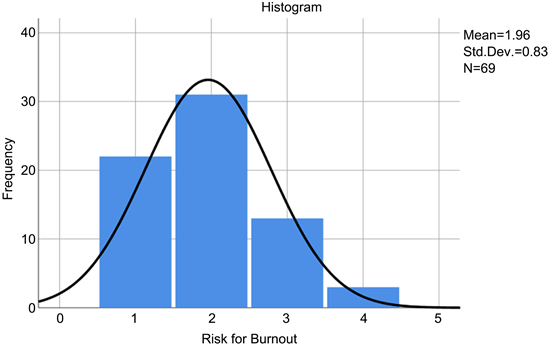
Graph 3. Risk for Burnout histogram with a normal distribution curve. 1 = No Evidence of Burnout, 2 = Low Risk for Burnout, 3 = Moderate Risk for Burnout, 4 = High risk for Burnout and 5 = Burnout. N = 69 had a normal distribution curve in relation to their Risk for Burnout with an expected SD = 0.83 M = 1.96.
![]()
Table 10. T-test to evaluate the risk for burnout in regard to age & gender and found no significant difference.
![]()
Table 11. Independent samples T-test in relation to age and possible risk for Burnout found no significant difference.
The EFPRB is therefore an excellent tool for companies to predict employee distribution Risk for Burnout within their operational environment. This also provides companies with the knowledge to predict mental exhaustion prior to affliction, affords them the ability to proactively launch preventative measures to help the individual and to address the related causes thereby staving off an inevitable diagnosis. An early identification tool therefore helps organizations to sustainably manage presenteeism costs, to improve psychological well-being, and to enhance engagement at work.
Additional research on multi-national corporations and larger groups can further strengthen the association between EFP and EFPRB in relation to anxiety and depression and could therefore also benefit society and companies as a whole. Not to mention providing companies with quarterly updates to their psycho-social wellbeing status and company-wide risk distribution and correlations between departments in continuum, prior to, and/or after any change programs.