Generation, Characterization and Management Practices of Household Solid Wastes in Cowfield, Paynesville City, Liberia ()
1. Introduction
The growth of the human population has led to increased consumption of natural resources. Simultaneously, households have been one of the major sources of waste generation. There is always high utilization of resources by households in urban, peri-urban and rural centers including energy, water, food and raw materials (The Re-Issued Amendment, 2005). Municipal solid waste stream at household level has taken a new dimension than ever as it is now in developed and developing countries (Ogedengbe & Oyedele, 2006). Economic growth, urbanization and change in consumption behavior coupled with population increase are immensely contributing to this new dimension (Ogedengbe & Oyedele, 2006; Afroz et al., 2011; Aguilar-Virgen et al., 2010; Bamgboye & Ojolo, 2004; UNEP, 2007; Premakumara, 2011). There is single method for waste management. The management practices may vary according to volumes and types of the wastes, national policy as well as the local conditions of a place (Wilson, 2010). In many countries, like Liberia, the local municipality is mainly responsible for Municipal Solid Waste Management services (Premakumara, 2011; Wilson, 2010; Shivashankara & Rekha, 2005). High waste generation, improper waste management system and lack of policy and financial supports have outpowered many municipalities in developing countries to manage waste properly (UNEP, 2007; Wilson, 2010; Hayal et al., 2014; Hoornweg & Bhada-Tata, 2012).
Municipal Household Solid waste is one of the cores of urban environmental problems facing Liberia and other developing nations. Many studies have linked poor waste management as a significant threat to public health, water resources, climate, property value and quality environment (Ogedengbe & Oyedele, 2006; Dorliae, 2012; Bobeck, 2010; Henry et al., 2006). Moreover, the lack of sanitary landfill and uncontrolled decomposition of organic wastes is becoming serious challenge to human health and environment (Bobeck, 2010; De Wilde et al., 2014). Due to their nature and composition, waste emanating from households needs to be constantly researched and monitored. Determining the fractional composition, management practices and challenges faced are germane. Waste characterization is an important integral of any waste management system. It plays a vital role in the treatment, improving performance, policy making and provide the information required for the development of relevant community and national based activities to address waste management issues (The Re-Issued Amendment, 2005; Afroz et al., 2011; Aguilar-Virgen et al., 2010; EPA, 2002; Kumar, 2006). Relevant data and information at household level is required to monitor and control existing waste management systems and to make regulatory, financial, and institutional decisions (EPA, 2002). General and specific information on waste generation and management from both urban and rural households in Liberia is lacking (UNEP, 2007; Dorliae, 2012; Pasco Waste & Environmental Consulting, 2012; UNICEF, 2004; WHO, 2003; UNEP, 2005). Generally, waste data available at the national is a combination of all sources such as household, commercial, construction and industrial. It is from this background that this research was conducted to determine the waste generation rates, quantities and composition, management practices, challenges and strategies at the Household level.
2. Materials and Methods
2.1. Research Setting
The study was conducted in the Cowfield Community of Paynesville Borough. Paynesville City is a metropolitan area in Greater Monrovia with a population just over 400,000 (PCC, 2018). It is characterized by Tropical Masoon Climate with an annual rainfall of about 182 inches and temperatures averaging around 26.4˚C (79.5˚F). The wet season runs from May to October while the dry season runs from November to April (Petterson, 2014; LISGIS, 2008).
2.2. Methods
The research used measurement, questionnaires and reconnaissance surveys and field observations as means of data collection. The data were both quantitative and qualitative. The socio-demographic characteristics, management practices, challenges and strategies were obtained through structured questionnaires and field observations. Multistage sampling technique was adopted during the study (Bobeck, 2010; EPA, 2002). Purposive sampling was used in selecting the study area and households were systematically selected in four zones. The fourth house of every count was sampled. The selected households in the communities were assigned number from 1 - 60 for identification and analysis purposes.
2.3. Survey
A reconnaissance survey was conducted in order to have baseline knowledge of the study area including community consent and entry, number of households, social background, etc. A questionnaire survey was conducted prior to the commencement of the seven days waste collection. This survey was intended to gather information on the socio-economic and demographic characteristics of the households, the total number of occupants, management practices, challenges and strategies.
2.4. Wastes Collection and Weighing
Waste was collected, sorted and weighed from a total of 60 households of four zones (A, B, C and D) over a week period. The sample size was dependent on time and research budget. A representative sample size was selected based on (EPA, 2002) waste management characterization guidance. Selected households were issued emptied plastic bag every morning and asked to put in their daily waste generated. The waste bags were collected by the researcher and five trained research assistants every morning and another plastic was issued. The waste on the first day was discarded as it may contain wastes of previous days. Each bag was weighed and recorded in the data sheet for analysis. Each waste bag was labeled using the profile below:
• Day and time of waste collection.
• Assigned house number.
• Block/zone of the household.
• The name of the waste collector.
2.5. Materials
The following materials were used: Weighing scales (15 kg Kinlee scale; minimum precision 50 g), Bags for collection and weighing, Disinfectant, reflector jackets, gloves, nose masks, etc., Survey papers, writing boards, and paper and pens and Tricycle.
2.6. Data Analysis
Statistical Package for Social Sciences (IBM SPSS Statistics 20) was used for questionnaires analysis. For the compositional analysis, the weighed waste bags of each day were emptied onto a flat plan and reduced to a manageable size using the quadrant technique. The opposite size was selected for analysis. The fractional waste was weighed and the weight of the bucket was subtracted from the total weight. The daily per capita/person generation, the per cap generation rate (kg/cap/day) and the sum of the daily household generation were calculated using standard method (EPA, 2002). Tables, Graphs and Charts were used for data presentation.
3. Results and Discussion
3.1. Demographic Characteristics
The majority of the respondents were (38.3%; n = 120) between the ages of 31 - 40. Most of the respondents (51.7%; n = 120) have received a tertiary education and are engaged in business (35.0%; n = 120) or employed (36.7%; n = 120) for income generation with majority (55.0%; n = 120) earning a monthly net income between $51 - $150 United States Dollars. Majority of the households (60%; n = 120) are nuclear family with majority (53.3%; n = 120) a family size of 6 - 10. This result revealed a high household size compare to the findings of (Ogedengbe & Oyedele, 2006) in Nigeria and (LISGIS, 2008) in Liberia, where the highest percentage of household size was between 4 - 6 persons. The big family size may be due to the recent influx of young people in Monrovia for greener pastures and high education.
3.2. Waste Generation and Composition
3.2.1. Waste Generation
Waste generation varied with day of the week with a total generated quantity of 1125.2 kg with average per capita generation of 0.41 kg/cap/day. As shown in Table 1, there was a diminution in the trend of total waste quantity generated daily. The waste generation reduces at the mid and end of week. A high proportion (27.3%) of the waste was generated on Sunday and the least on Friday. The variation in daily waste generation might be as the result of lifestyles, cooking and eating habits, social economic circumstances and the number of people staying at home. During this time, especially on Sunday, a relatively high percentage of the household population spends their time and cook huge quantity of food. Also, the rural-urban movement of people during weekend may also contribute to the high generation of waste during the week start. People who work or stay in the rural areas occasionally comes to urban areas during weekend for social amenities and family purposes. The low generation of waste during mid-week days might be as the result of working or engagement schedules. Most people eat from restaurants, cook shop or canteens rather than cooking. Many studies have also indicated variation in waste generation due to similar lifestyles, and household size (Afroz et al., 2011; Aguilar-Virgen et al., 2010; Bobeck, 2010; Afon & Okewole, 2007). The variation in household waste generation might be as the result of income differences, difference in household size, level of education and consumption pattern. It can be deduced that household daily solid waste generation varied from 0.5 to 17 kilograms per household per day with an average of 3.2 kg per household per day depending on the household size and income. A little difference and significant variations were reported by (Aguilar-Virgen et al., 2010) in Ensenada and (Premakumara, 2011) in Cebu City, where more than 70% of the households’ solid waste generation rates was a little over 2 kg per day. The average per capita waste generation rate was 0.09 kg/cap/day less than the average per capita waste generation reported by (UNDP, 2006) for Monrovia. The per capita waste generation rates have never been same over the years in many communities, districts, cities, provinces, country and continents as well. Studies conducted across many African communities, cities or countries have reported variation in the average per capita waste gener-
![]()
Table 1. Total quantity of waste generated per day.
(Note: Waste collected on Saturday was discarded as it may contain waste of previous days).
ation. In Lagos, Dhaka and Addis Ababa, 0.48 kg/cap/day, 0.3 kg/cap/day and 0.5 kg/cap/day was reported as the per capita waste generation respectively (Afroz et al., 2011; Aguilar-Virgen et al., 2010; Bamgboye & Ojolo, 2004). The variation in per capita generations has been attributed to spatial-temporal difference, individual lifestyle, seasonality, level of education, culture, income, urbanization and economic activity (Oberlin, 2011; Premakumara, 2011).
3.2.2. Waste Composition
Household wastes are generally classified into organic and non-organic. The waste composition was categorized as bio-waste (food, vegetables, grass, dried leaves, etc.), paper and cardboard (packaging, carton and newspaper), plastic (including soft drink bottles or PET, cosmetic bottles, plastic bags, sachet water bags, etc.), glass (green, clear, brown and others), metals (ferrous metal, Aluminum, can bottles, batteries, etc.) and others (consisting of fines element, unclassified) (EPA, 2002). As presented in Figure 1, bio-waste was the most generated waste in the community with the highest percent weight of 54% and others had a percent weight of 22%. The high generation of organic wastes is an indication of the household consumption behavior and is likely that many of the household consume food, fruit and green. Most of the organic waste was made of fruits skin, green stems, and leaves with less edible food. Also, it is a residential area that is closed to the Duport Road market and the commercial hub, Red Light Market, of Paynesville where fresh meat, fish, vegetables are always available in these markets at cheaper price then the canned food and residents could prefer fresh greens and fruits over canned food. The potential recyclable materials include paper and cardboard, metal, textiles and glass. Collectively, these components make up 24% of the household waste. Relatively low number of textiles and paper are recovered for recycling. This is either because the waste is not segregated during generation or these materials can easily be affected by ash, organic and liquid wastes. In the case of textiles, people may discard used clothes when it is not of faction and do not share with others because of some ritual beliefs in Africa. People often believe that clothes once won can be used to plan evil against him or her (Agazue, 2014). The low PET and plastic materials is because
![]()
Figure 1. Composition of waste fraction.
of their recyclable and reusing nature. Most of the households confirm that PET/plastics bottles are collected to store oil and other cooking materials. The PETs are also recycled for soft drinks and juices packaging. Plastic and sachet water bags were high and this might be because of the low potential opportunity for reusing and recycling or low recycling price. The metal and glass contents in the waste were very low. This may be because households consume less canned food and glass bottles are recycled for use in beverages production. Comparing the results to that of previous studies, the variation is very less especially in the organic, plastic, cardboard and paper and plastic fractions even though the classification grouping may vary. However, organic waste seems to be the highest waste generated especially in developing countries. In several studies conducted across in other African Nations, there was high level of organic wastes with low recyclables (Afroz et al., 2011; Aguilar-Virgen et al., 2010; Bamgboye & Ojolo, 2004; UNEP, 2007; Premakumara, 2011; Pasco Waste & Environmental Consulting, 2012).
3.3. Management Practices
Despite the efforts applied by the municipality and Community Based Enterprises (CBEs), municipal solid management remains a very serious environmental and public health issues for the city of Paynesville. As presented in Table 2, waste management practices are extremely unhealthy, unsustainable and rudimentary. The wastes generated by households are being burned, buried and disposed in open areas or designated dumpsites. A high percentage (70%) of the waste generated by households is burned and dumped in vacant places in the community. The limited waste service providers, irregularity in collection frequency and systems, the unavailability of communal area or public bins and limited segregation are mean factors exacerbating the poor waste management. Waste separation is not a common practice among households. The materials used by households for storage of waste generated are not standard/environmentally friendly as they do not contain lid. Standard bins should have lid to prevent flies and other diseases carrier (Guerrero et al., 2013; Aguoru & Alu, 2015). Used bucket, plastic drum/metal and rice bags are mostly used storage medium. Generally, old bucket has been observed to be the most used material for temporary storage of waste in developing nations (Kumar, 2006; LISGIS, 2008; Afon & Okewole, 2007; Oberlin, 2011). This may be as the result of its availability and limited recycling opportunities available. Rice bag was less used by households because of its numerous uses particularly by charcoal vendors. The similar medium of storage was reported by studies conducted in Ghana and Uganda (Guerrero et al., 2013; Aguoru & Alu, 2015; Mukisa, 2009; EGSSAA, 2009). This is either because most of the households cannot afford conventional bins or they are readily unavailability in the country. Although conventional bins are environmentally friendly, most of them are expensive and scare in developing nations (Guerrero et al., 2013; Aguoru & Alu, 2015). Furthermore, there is lack of locally designed and produced bins for storage of wastes at the household level in Liberia. Most of the bins were found near the kitchen and were uncovered.
![]()
Table 2. Waste management practices.
Similar observation was made in (Aguoru & Alu, 2015; Henry et al., 2006) where uncovered bins were placed close to the kitchen. However, it is important to note that lack of lid and closeness of these storage materials near the house can cause health challenges, especially when the waste is mixed and not collected frequently (Aguoru & Alu, 2015; EGSSAA, 2009; Henry et al., 2006).
In terms of temporary refuse disposal area, there is no communal facility or public bins in the study area. Lack of predetermined locations or communal community disposal facility is also causing indiscriminate disposal of waste. Unlike the findings of this study, a study conducted (Mugagga, 2006) revealed that 98% of households relied on communal bin or area for waste disposal. Due to the challenges faced, the City Cooperation designates transfer station for temporary disposal of waste. One of these transfer stations is located by the main road near the ELWA Market opposite the Liberia Broadcasting System (LBS) shown in Plate 1 & Plate 2. Huge quantity of waste is being dumped daily on the ground by primary and secondary collectors manually or by automated vehicle. The waste is then loaded in large tipping truck by a wheeled loader and transported to the Whein Town Landfill for final disposal. Although the transfer station is considered as short emergency measure, it is inefficient and unhygienic. The transfer stations are not properly managed. Smells, litters, poor vehicle utilization, land degradation and improperly dressed scavengers are major problems of transfer stations. The stockpile of garbage has major challenges to the sellers, buyers, scavengers and passer-by. There is high concentration of unpleasant smell from biodegradable waste components thereby affecting air quality and climate. This is because the waste has already started decomposing due to less collection frequency before it is being brought to the transfer station. At the transfer station, scavengers were seen picking from garbage without personal protective equipment (PPEs). These recyclable pickers, most of whom were women, were seen picking recyclables without any gloves, noise masks and rain boot.
The waste disposed at the transfer station is a mixed fraction of the waste stream which makes it unsafe for scavengers. There are sharps metals such as zinc, iron and others which could easily cut waste pickers hands.

Plate 1. PCC tricycle offloading at the ELWA market transfer station.
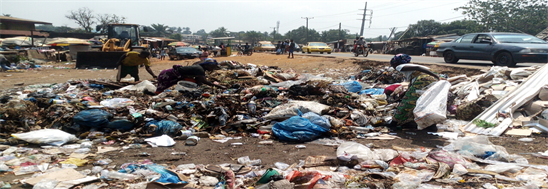
Plate 2. Scavenger without PPEs picking after offloading.
Solid waste collection and transportation is considered as the function of the Local Government Borough. The Paynesville City Cooperation (PCC) is solely responsible for the collection and disposal of garbage being generated within the confine of the Borough. However, Population and economic growth couple with lack of finance have overpowered the Cooperation’s efforts to expand waste management services. To mitigate the challenge and for a collection system to be effective, it must be designed to suit location conditions. The PCC adopted an integrated system for waste collection. Waste collection is done by private and public institutions. This created the avenue for the establishment of Community Based Enterprise (CBEs) and Small Medium Enterprises (SMEs) to help collect garbage and maintain the orderliness of the city. The CBEs are mainly responsible to carry out door to door collection of municipal solid waste, while the SMEs are responsible to collect and transport municipal solid waste from holding points to final disposal site (Landfill). However, as shown in Table 2, very few of the households benefit from waste collection services. In terms of collection frequency, the study shows that solid waste is collected once a week from most households. The less coverage was attributed to lack of Finance, equipment, technical expertise and data for planning. Similar waste collection practices were reported in is implemented in many countries in Africa (Henry et al., 2006; Coffey & Coad, 2010; Mbeng et al., 2009).
The diet of households also affects waste disposal. Fish is mostly consumed by Liberians and its waste are eventually mixed other fraction of the wastes. This causes the waste to develop strong smell quickly. When the wastes start to decompose and attract flies because of odor and vector diseases carrier, there is a tendency that the household will burn, bury or dump the waste in vacant spots due to unavailable door to door collection. It was also noted by some household respondents that the dumping of waste in open or unauthorized areas is as the result involvement of unrecognized personnel. Most of the households rely on Zogos for garbage disposal because of the less cost. The Zogos collect very little amount from households as fees. Normally, the amount to be paid is determined by the household. The drug addicts have taken garbage collection as a means of getting money to buy drugs and food. The holding point is very far from the community. As the result, the waste collected from households by the Zogos are often dumped on land, vacant building, by the road-side, streets and sometimes drop to a nearby household waste bin. The findings of this study are also in concurrence with previous studies reported over ten years now. This is an indication that waste management in Liberia is not improving despite the efforts from government and private partners.
The methods of solid waste management also pose considerable setbacks to the country attaining the sustainable development goals and contravene the citizens constitutional rights to safe, clean and healthy environment, the Environmental Protection and Management Laws of Liberia as well international protocols and conventions of which Liberia is signatory and member of such as Basel Convention, Bamako Convention, Stockholm Convention, Paris Agreement, Rotterdam Convention, Montreal Protocol that call on every member to ensure sound environmental management wastes and its hazard. The burning of waste including electronic can create serious problems for community residents’ health and the environment. Many studies have reported the impacts of burning and open dumping on human health and the environment. Indiscriminate dumping and burning of waste can cause the emissions of dioxin, furans, carbon monoxide (CO) and methane gas (CH4) into the atmosphere (Bobeck, 2010; Ravi & Vishnudas, 2017).
3.4. Challenges Faced by Households
While it is true that there have been efforts in curbing solid waste dilemma, there are still array of challenges faced. These challenges reveal why solid waste is indiscriminately handle in the community. As shown in Figure 2, the community lacks temporary or communal, waste service provider and sound environmental storage bins for household waste management. This calls for provision of standard bins either through a loan scheme or humanitarian aid and the enhancement of CBEs capacities through the provision of collection equipment such as tricycle. The environment and health impacts are obvious in the Cowfield Community as the result of improper waste disposal and management.
3.5. Recommended Strategy
Figure 3 presents the respondents’ recommended solid waste management strategies. Some of these practices were commonly being used by most of the respondent while some were not. These management strategies include: Composting, Burning, Burying, Dumping and Waste to Energy. Waste to energy and composting were the most recommended management. Even though hundred percent of respondents do not have the technical knowledge of waste to energy and composting technology but they see it as the most preferable options in managing organic waste. This was determined by a follow up intended to understand household’s willingness and knowledge on waste to energy and composting. The respondent choices are obvious because of their level of education as
![]()
Figure 2. Challenges faced by households in waste management.
![]()
Figure 3. Respondents’ recommended management strategies.
observed by the researcher. Furthermore, the respondents may have expressed interest in utilizing organic waste for energy and composting because of the noticeable impacts of organic waste on the community as the result of improper management.
4. Conclusion and Recommendations
The findings of the study reveal an alarming situation and if nothing is done, the health of the environment and community remains compromised. The study concludes that Municipal Solid Waste Management practices by households, in the Cowfield Community, is rudimentary and it has a considerable treat to the environment and public health. It is without doubt that the impact on the environment is glaring as the result of the poor waste management practices. Majority of the households carry on burning and open dumping as method of solid waste disposal; Waste collection services are very limited and poorly done while the segregation of waste at sources is unarguably not a practice among households with no means of waste to energy or composting. The Waste generation was high and fall within the range projection of UNEP (2007) for a typical household in developing countries.
The study therefore recommends the adoption of an integrated sustainable solid management system. This should prioritize waste minimization, reusing, recycling, segregation, collaborative partnership and effective collection in other to create avenue for waste to energy, composting and other wastes value addition services.
Research should be conducted across other communities at different for spatial and temporal variation, comparative analysis and to monitor and evaluate performance of waste management system and community challenges. Municipality should enhance collaboration and leadership between the CBEs and community as well encourage political support and community participation. Community sensitization and capacity building programs should be designed along with the community needs that should focus more on solutions that align with local conditions. To increase the coverage of waste collection and build good rapport, CBEs should prioritize efficiency and effectiveness to make their services reliable. CBEs should also engage into community awareness, give back programs and constantly evaluate action plans that will inform collection strategies.
Acknowledgements
The authors would like to thank the African Union Commission for research funding and all those who made this work of success.
Funding
This work was funded by the African Union Commission grant through the Pan African University scholarship 2017/2018.