High Efficient Photocatalytic Degradation of 3,7-Bis(Dimethylamino)-Phenothiazin-5-Ium Chloride Dye and Kinetics of H2 Evolution of N2H4H2O by Synthesized CdS/NiS Nanocomposite by Electrochemical Method ()
1. Introduction
CdS is one of the most studied materials among the II-VI compounds. II-VI semiconducting chalcogenide nanoparticles, especially sulfides and selenides have been investigated extensively, owing to their interesting optoelectronic properties [1] [2]. Recently, semiconductors photocatalysis are being considered for the elimination of organic and inorganic pollutants from aqueous dye solutions [3]. Nowadays, cadmium sulphide (CdS) has paid much attention for the degradation of organic pollutants owing to the excitation of holes and electrons by illumination of visible light [4]. CdS is one of the most important semiconductors with direct-band-gap of 2.42 eV, so it has a promising potential application in electroluminescent, photo luminescent and photoconductive devices [5]. There has been considerable interest in hydrogen storage in addition to the transport technology for its utilization. Potential solutions using novel nanomaterials have been proposed and investigated extensively [6] [7]. The decomposition of ammonia using a catalyst has been examined as a means of supplying COx-free hydrogen, which requires a high reaction temperature (>573 K) to be converted into nitrogen and hydrogen [8]. Hydrazine, N2H4, as monopropellant was investigated for use in satellite propulsion using an Ir based catalyst [9]. Shell 405TM (30 wt% Ir/Al2O3) was milestone in the development of such a catalyst, which activated anhydrous hydrazine even at 293 K [10]. Hydrazine is considered to be an eco-friendly and efficient energy-saving alternative in lowering the overall voltage of the overall water splitting for hydrogen generation [11] [12]. In recent decades, hydrazine monohydrate (NH2NH2·H2O) has been acknowledged as ideal for hydrogen storage due to its hydrogen content being as high as 8.0 wt%, liberating nitrogen as the only by-product. A number of efficient catalysts for the decomposition of hydrazine to hydrogen and nitrogen even at ambient temperature have been reported [13]. Visible light assisted hydrogen generation from complete decomposition of hydrous hydrazine using rhodium modified TiO2 photocatalyst as been reported by Pawan Kumar et al. [14] [15]. Semiconductor based photocatalysts such as TiO2, ZnO, InVO4, (Ga1 − xZnx) (N1 − xOx), etc. could be interesting alternative materials [16]. In continuation of our ongoing research on photocatalytic reactions, herein we report for the first time, visible light (laboratory condition) and UV light assisted hydrogen generation from hydrazine hydrate using CdS/NiS photocatalyst.
2. Electrochemical Synthesis of CdS/NiS Nanocomposite
In this method CdS/NiS nanocomposite was synthesized by electrochemical method. The experimental setup is as shown in Figure 1. The preparation of CdS/NiS nanocomposite were carried in a reaction chamber containing 20 ml of Na2S (0.2M) solution. Voltage power supply of 15 V, current of 20 mA and Ni and Cd wire as anode and Pt electrode as cathode were used. The experiment was run for 2 hours at 298 K temperature. The anodic dissolution of Ni and Cd gives Ni(II) and Cd(II) ions which are electrochemically reacted with aqueous Na2S (0.2M) to form Ni(II) Sulfide with Cd(II) Sulfide. The resulting precipitates were filtered and washed several times with double-distilled water. Washings were done to remove any organic part or any other impurity from the particles. The wet powder was then dried at a temperature 750˚C for dehydration in muffle furnace and removal of Na2S impurities to get CdS/NiS nanocomposite. The synthesis takes place at the electrode-electrode interface or close to the electrode within electrical double layer. The product is deposited on the electrode in the form of thin film or coating and also it floats in the electrolyte solution which is collected by filtration. The rate of electrochemical reaction is not same for all the metals, as the redox potential of Ni (−0.23 V) and Cd (−0.403 V) is different. Since the dissolution potential for Cd is more negative than Ni, it is expected that the formation of CdS takes place in competition with the formation of NiS. Hence the product would be CdS/NiS nanocomposite. The electrochemical reaction takes place according to the mechanism shown in Scheme 1.
Determination of Photocatalytic Activities Methylene Blue (MB) Dye
MB solution was used as a test contaminant for investigating photocatalytic activities of the CdS/NiS nanocomposite. The evaluation was carried out under UV
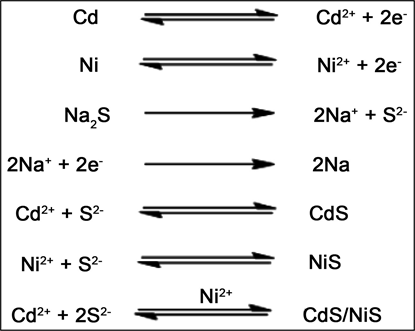
Scheme 1. Plausible mechanism for the electrochemical synthesis of CdS/NiS.
![]()
Figure 1. Experimental set up for the synthesis of CdS/NiS nanocomposite.
light in order to investigate the efficiency of CdS/NiS nanocomposite. To examine the photocatalytic activity 5.0 ml of colloidal solution upon exposure to light for equal interval of time were transferred to centrifuge tubes and centrifuged at 800 rpm to remove the dispersed catalyst and percent transmission was recorded for the colour solution. Chemical oxygen demand (COD) was estimated before and after treatment using dichromate oxidation method [17]. The increase in percent transmission and decrease in COD (mg/L) of dye solution with colour removal was observed to be more in CdS/NiS nanocomposite.
3. Results and Discussion
Characterization of the CdS/NiS nanocomposite was carried out by different techniques. BET surface area was analyzed using quanta chrome Nova1000 BET instruments, UV-Visible spectra were measured using (ELICO SL171) model double beam spectrophotometer. X-Ray diffraction (XRD) pattern was recorded with pan analytical X-ray diffractometer using Cu Kα radiation (λ = 1.5406 Å), The morphological properties of the Ni/CdS nanoparticles were examined by scanning electron microscopy (SEM), The elemental analysis of the Ni/CdS nanoparticles was carried out using EDAX (JOEL, JED-2300, Germany),
3.1. Brunauer-Emmett-Teller (BET)
BET surface area analysis and nitrogen adsorption-desorption isotherms were used to evaluate the properties like surface area, pore volume, pore diameter of CdS/NiS nanocomposite. Surface characteristics of the sample were analyzed using quanta chrome Nova1000 BET instruments, prior to the analysis samples that were degassed at 180˚C for 4 hrs, the nitrogen adsorption-desorption isotherm was recorded by passing nitrogen gas to the sample under bath temperature 77K. Nitrogen adsorption-desorption isotherms, surface area and pore size distribution were obtained by Brunauer-Emmett-Teller (BET) and Barrett-Joyner-Halenda (BJH) method [18] [19] [20]. The micro pore volume, micro pore area and external surface area were obtained by Volume-Thickness (v-t) method using Asiqwin data reduction software (version 3.0). As prepared CdS/NiS nanocomposite showing identical hysteresis loop of IV isotherms. BET surface Analysis data has been reported in Figure 2 and Table 1.
3.2. UV-Visible Spectra
UV-Visible spectrum Figure 3(a) of CdS/NiS nanocomposite over the range 200 - 700 nm showed photoabsorption properties no longer than 320.70 nm, which suggest that the catalyst is photo active under UV light irradiation. Assuming the CdS/NiS solid as direct semiconductor and it is possible to calculate the band gap of CdS/NiS by constructing a Tauc plot [21]. The Tauc plot of CdS/NiS is displayed in Figure 3(b). The energy of the band gap of CdS/NiS could be thus estimated to be 3.26 eV. It is reported that Cd loading results in enlarge surface area of the CdS/NiS photocatalyst. However, the increase of surface area is likely not the main factor affecting the photocatalytic activity of CdS/NiS. Other factor
![]()
Figure 2. N2 adsorption/desorption isotherms (a), BET-plot (b) and pore size distribution of the catalyst (c).
![]()
Table 1. Brunauer-Emmett-Teller (BET) surface analysis.
![]()
Figure 3. UV-Visible spectra (a) and Tauc plot of CdS/NiS nanocomposite (b).
that could affect photocatalytic efficiency are such as availability of active sites, crystalline structure, pore size and number/nature of trapped sites [22] [23]. According to the literatures and the fact that cadmium acting as an electron trap [24], an enhanced photocatalytic activity of CdS/NiS nanocomposite found in our study was likely ascribed to a decrease of electron-hole pair recombination and thus promoting the photocatalytic activity [25].
3.3. X-Ray Diffraction and Williamson-Hall (W-H) Plot Method
The XRD patterns of CdS/NiS nanocomposite Figure 4(a) exhibit hexagonal structure with similar peaks. The broadening of XRD peaks confirms nanocrystalline nature of the as prepared samples. The diffracted peaks obtained at diffraction angles 2θ of 27.11, 37.21, 43.28, 63.01, 75.48 and 79.51 corresponds to the (111), (211), (300) (400) (332) and (422) planes of CdS/NiS peaks with hexagonal phase (JCPDS-80-0006) [23]. The crystallite size was calculated using Williamson-Hall (W-H) plot method Figure 4(b). W-H method reported that the XRD pattern broadening is attributed to both crystallite size and lattice strain. The XRD peak broadening due to micro strain is given by
(1)
where βε is broadening due to strain, ε is the strain and θis the peak position in radians.
(2)
From Equation (2) is Williamson-Hall equation and represents the uniform deformation model (UDM) by plotting 4sinθalong the x-axis and βcosθalong the y-axis and from the linear fit of the data, the crystalline size was estimated from the Y-intercept and it was found to be 23.22 nm, and the strain ε was estimated from the slope [26] [27] and it was found to be 6.6324 × 10⁻⁴. From the XRD data the cell parameters are calculated and it is found to be a= b≠ c (a=
![]()
Figure 4. XRD patterns of CdS/NiS nanocomposite (a) and Williamson-Hall plot (b).
4.176 Å, b= 4.176 Å and c= 13.412 Å) and α = β = 90˚, γ ≠ 90˚. Accordingily CdS/NiS nanocomposite belongs to hexagonal structure [28] [29] [30].
3.4. Field Emission Scanning Electron Microscopy (FE-SEM)
Particle size and surface area contributes to a larger extent on the photocatalytic activities of photocatalysts. The morphological studies of synthesized CdS/NiS nanocomposite from electrochemical method were analyzed by scanning electron microscopy are shown in Figure 5. Sample shows that it consists of nano rod shape of CdS/NiS nanocomposite. The elemental analysis of the CdS/NiS nanocomposite was carried out using EDAX (JOEL, JED-2300, Germany). The EDAX analysis spectrum Figure 6 reveals elemental composition of CdS/NiS nanocomposite. It is clear from the graph that the peaks corresponding to Cd, S and Ni are present in the prepared samples. The elements present and their relative proportions or quantitative results obtained by SEM-EDAX analysis and the corresponding data are given in Table 2.
4. Photodegradation Kinetics and COD Measurements
4.1. Effect of Concentration of Methylene Blue (MB) Dye
The reaction was performed with different concentrations of MB with constant weight of CdS/NiS photocatalyst. The change in concentration of the MB was recorded by change in colour using Spectrophotometer. A plot of log%T (percent transmittance of light) versus time was liner up to 50% of the reaction indicating the disappearance of MB follows 1st order kinetics as shown in Figure 7. The rate constant values are tabulated in Table 3. The reaction rate decreases with increase in concentration of MB. This is because with increase in the dye concentration, the solution becomes more intensely colour and the path length of the photons entering the solution is decreased thereby few photons reaches
![]()
Figure 5. FE-SEM micrographs of CdS/NiS nanocomposite.
![]()
Figure 6. EDAX of CdS/NiS nanocomposite.
![]()
Figure 7. Effect of concentration of MB on the rate of degradation (a) and COD values (b).
![]()
Table 2. Quantitative results for CdS/NiS nanocomposite.
![]()
Table 3. Effect of photodegradation at different concentration of methylene blue dye under UV light. [CdS/NiS = 0.02 g and Temperature = 298 K].
the catalyst surface. Hence the production of hydroxyl radicals is reduced. Therefore the photodegradation efficiency is reduced. The pH and COD for MB solutions before and after degradation were measured and given in Table 3 and Figure 7.
4.2. Effect of Catalyst Loading
The experiments were performed by taking different amount of CdS/NiS photocatalyst varying from 0.005 - 0.03 g in order to study the effect of catalyst loading. The study showed that increase in catalyst loading from 0.005 g - 0.02 g increased dye removal efficiency. Further increase in catalyst above 0.02 g decreased the photoactivity of the catalyst, which is due to the aggregation of CdS/NiS nanocomposite at high concentration causing a decrease in the number of surface active sites and increase in the opacity and light scattering of CdS/NiS nanocomposite at high concentration. This tends to decrease the passage of light through the sample. Further, in the present study indicated, from economic point of view, the optimized photocatalyst loading is 0.02 g/20ml. Effect of catalyst on photodegradation of MB is shown in Figure 8 and rate constant values are tabulated in Table 4. A result of COD effect is shown in Figure 8(b).
4.3. Effect of pH
The solution pH is an important variable in the evaluation of aqueous phase mediated photocatalytic reactions. The pH of the solution was adjusted by adding 0.001M HNO3 or 0.001M NaOH solution. The effect of pH was studied at pH 4.02, pH 6.0, pH 9.5 by keeping all other experimental conditions constant. The results are illustrated in Figure 9 and tabulated in Table 5. The rate of
![]()
Figure 8. Effect of catalyst loading on the rate of degradation of MB under UV light (a) and COD values (b).
![]()
Figure 9. Effect of pH on the rate of degradation of MB (a) and Effect of pH on COD values (b).
![]()
Table 4. Effect of catalyst loading on the photodegradation of methylene blue under UV light. [MB = 3.0 × 10⁻⁵ and Temperature = 298 K].
![]()
Table 5. Effect of pH on photodegradation of methylene blue dye under UV light. [CdS/NiS = 0.02 g, MB = 3.0 × 10⁻⁵ Temperature = 298 K].
degradation is observed to be slow at lower pH (<4.02) and higher (>9.5) pH. It was observed that the amount of material recovered after the experiment was lowered at lower and higher pH because of the dissolution of semiconductor sulfide at extreme pH values. Results of COD effects are illustrated in Figure 9(b). The optimum selected pH is 9.5 at which photodegradation is high.
4.4. Effect of Temperature
Temperature is one of the essential factors which effect the rate of photodegradation. To examine the effect of temperature, the experiment was carried out at three different temperatures. It is confirmed that when temperature is increased the degradation efficiency of MB is increased, and observed that the rate of degradation is not very significant at lowtemperature. However, the reaction is more significantly influenced at high temperature since the diffusion rate increased with temperature. An increase of temperature could bring about an increase in the degradation rate [31]. The rate constant and COD values are reported in (Table 6 and Figure 10). The thermodynamic parameters were calculated and are reported in Table 7.
5. Effect of Light Intensity
The photodegradation rate for the degradation of MB with UV light is compared with sunlight. It is observed that the photodegradation rate is increased in UV light for prepared photocatalyst compared to sunlight (Figure 11 and Table 8). The reason is that, the inclusion of Ni2+ in CdS matrix caused an increase in the band gap of CdS from 2.39 eV to 3.26 eV, indicating that these semiconductor nanoparticles absorb UV light. This can subsequently activate these modified metal sulfide photocatalysts upon UV light irradiation. When a photon incident on a semiconductor (CdS/NiS) has energy that matches or exceeds the band gap energy of the semiconductor, an e− is promoted from the valence band (VB) into the conduction band (CB), leaving a hole in the VB. Excited-state CB electrons and VB holes can recombine and dissipate the input energy as heat, get trapped in metastable surface states, or react, respectively, with electron acceptors and donors that happen to be adsorbed on the semiconductor surface or within the surrounding electrical double layer of the charged nanoparticles. In the absence of suitable e−/h+ scavengers the stored energy is dissipated within a few nanoseconds by recombination. If a suitable scavenger or surface defect state is available
![]()
Figure 10. Effect of temperature on the rate of degradation of MB (a) and COD values (b).
![]()
Figure 11. Effect of concentration of MB on the rate of degradation under sunlight.
![]()
Table 6. Effect of temperature on photodegradation of methylene blue dye under UV light. [MB = 3.0 × 10⁻⁵, CdS/NiS = 0.02 g].
![]()
Table 7. Thermodynamic parameters for methylene blue dye solution.
![]()
Table 8. Rate of degradation in sunlight.
to trap the electron or hole, recombination is prevented and subsequent redox reactions may occur. As the number of defects in CdS/NiS nanocomposite, electron or hole recombination is prevented and therefore the CdS/NiS is very active under UV light compared to sunlight.
Reuse of the Photocatalyst
The possibility of reusing the photocatalyst was tested to see the cost effectiveness of the method adopted. After the degradation of the dye, the dye solution was kept standing for a day and then the supernatant liquid was decanted. The photocatalyst was thoroughly washed with double distilled water and then reused for the degradation by taking fresh dye solution. From the degradation study it was observed that the efficiency of the catalyst to degrade the dye solution was slightly reduced to approximately 80% for the use of second time. Further reuse of the catalyst showed lesser efficiency.
6. Kinetics of H2 Evolution of N2H4H2O by CdS/NiS Nanocomposite under Visible Light and UV Light
Experimental
The synthesized CdS/NiS nanocomposite was added to 20 ml of hydrazine (N2H4H2O) solution in a 50 ml beaker at ambient temperature and atmospheric pressure. The experiments were carried out for different concentration of hydrazine (0.1 M - 0.5 M) and photocatalyst loading (0.001 g - 0.003 g). Correction of over potential for blank N2H4H2O solution of initial concentration (V0) was deducted by potential measured in presence of the photocatalyst (CdS/NiS) at different interval of time (Vt). The decomposition of N2H4H2O experimentally followed by measuring the potential against Standard calomel electrode (SCE). The experiment was carried out at excess concentration of N2H4H2O compared to photocatalyst. The disappearance of N2H4H2O was followed pseudo 1st order kinetics. A plot of log (Vt - V0) was plotted against time gives a liner graph. The rate constants for H2 evolution are obtained from the slope of the plot. The potential for the initial concentration and for the Hydrogen Evolution Reaction (HER) at different interval of time was measured against Standard Calomel Electrode (SCE) using digital potentiometer (Equip-tonics model EQ-606). The variation of resistance during HER was measured by the conductivity meter (Lab Man scientific instrument LMCM 20) as shown in Tableand figure. The effect of temperature on HER has been carried out. A comparison of HER for Visible light (Laboratory condition) and UV light (Sankyo denki G8T5 8W 12 UV Germicidal lamp 8Watts, 56Volts) were carried out.
7. Results and Discussion
7.1. Effect of Photocatalyst Loading and N2H4H2O
The rate of HER increases with the increase of CdS/NiS photocatalyst concentration from (0.001 g - 0.003 g). Rate constants were calculated by plotting log(Vt - V0) v/s time in mins. The values of pseudo 1st order rate constants are shown in Table 9 and Figure 12(a) & Figure 12(b). The rate of HER becomes slow after 50% of the reaction, hence the rate constants are obtained for approximately 50% reaction.
The rate constants for HER at different concentration of hydrazine (0.1M - 0.5M) are obtained. The values of rate constants are not affected by the concentration, since the experiments are carried out at excess concentration of hydrazine than photocatalyst. The comparison of the rate constants for Visible light and UV light are shown in Table 10, Figure 13(a) and Figure 13(b), which indicates the kinetics of rate of hydrogen evolution are carried out in visible light and UV light, the rate of HER is higher in UV light than Visible light. The current density (i) for HER has been calculated by using potential and resistance measured during the experiment has shown in Figure 14(a) and Figure 14(b).
Figure 15(a) and Figure 15(b) shows the plot of Current v/s Potential for HER, Figure 16(a) and Figure 16(b) shows the plot of current v/s time in mins, which indicates the increase of potential, increases the current with the increase of rate of H2 evolution. The rate of HER is very high in the presence of CdS/NiS photocatalyst compared to blank. This indicates the photocatalyst played an important role in the evolution of H2 from N2H4H2O in UV light compared to visible light.
![]()
Table 9. Effect of catalyst loading on the rate of HER N2H4H2O under visible light and UV light. [Conc of N2H4H2O = 0.2 M: Temp = 303 K].
![]()
Table 10. Effect of N2H4H2O under visible light and UV light. [N2H4H2O = 0.2M, CdS/NiS = 0.002 g: Temp = 303 K].
![]()
Figure 12. (a) & (b): Effect of catalyst loading on the rate of HER under visible light and UV light.
![]()
Figure 13. (a) & (b): Concentration of N2H4H2O under visible light and UV light compared to blank.
![]()
Figure 14. (a) & (b): The resistance for HER under visible light and UV light compared to blank.
![]()
Figure 15. (a) & (b): HER under visible light and UV light compared to blank.
![]()
Figure 16. (a) & (b): HER under visible light and UV light compared to blank.
In view of the above facts, the rate constants for HER are in following order
.
Hence the rate of HER by CdS/NiS nanocomposite is sensitive to UV light compared to sunlight, as the photocatalyst energy gap is 3.24 eV which comes under UV light. The rate constants for HER at different temperature are depicted in Table 11. Thermodynamic parameters for visible light and UV light are calculated and are depicted in Table 12. The increase of temperature slightly increases the rate of HER.
7.2. Tafel Plots
The different Tafel slopes for HER under UV light and visible light compared to blank are depicted in Figure 17(a) and Figure 17(b). The Tafel slope is higher
![]()
Table 11. Effect of temperature for HER under visible light and UV light. [Conc·N2H4H2O = 0.2 M, CdS/NiS = 0.002 g].
![]()
Table 12. Thermodynamic parameters for HER under visible light and UV light.
![]()
Figure 17. (a) & (b): Tafel slopes for HER under visible light and UV light compared to blank.
under UV light than visible light indicates the higher HER for UV light compared to visible light in presence of CdS/NiS photocatalyst. The values of Tafel slopes are shown in Table 13.
In view of the above results it is confirmed that initially HER rate in presence of the CdS/NiS photocatalyst is very high and after 50% of HER the reaction tends to slow. The results show that HER occur at very low cathodic current density. Considiring the decomposition of
the
maximum gas evolution would be 91.1 mmol. 50 vol% hydrogen gas if all the
![]()
Table 13. Values of Tafel slopes. [N2H4H2O = 0.2 M, CdS/NiS = 0.002 g, Temperature = 303 K].
hydrazine hydrate was converted into nitrogen and hydrogen, i.e. x= 1. Thus the N2H4H2O can be used as a hydrogen source which contains large amount of hydrogen undergo oxidation with OH radical in presence of the CdS/NiS photocatalyst and converted to hydrogen by following two ways
.
Splitting of N2H4H2O into H2 and N2 by photo-catalyzing HER may be due to interaction of OH radicals produced during the reaction with N2H4H2O which leads to oxidation of N2H4H2O. It is evidence that the formation of higher concentration of OH radical in presence of UV light compared to Visible light as the rate constant of HER was higher in UV light than Visible light by CdS/NiS photocatalyst.
The rate of HER is limited by either proton adsorption onto an active site or evolution of formed hydrogen from the surface. A high Tafel slope is indicative of proton adsorption as the rate limiting step, while a lower Tafel slope (20 - 45 mV) indicates that the evolution of molecules hydrogen from the catalyst is rate limiting. In the present case the Tafel slope for visible light is 23.5 mV and 42.5 mV for UV light. Blank experiments show poor activity for HER (10.1 - 13.5 mV).
8. Conclusion
CdS/NiS photocatalyst were synthesized by electrochemical method, an environmentally friendly method. Photodegradation by these semiconductors offers a green technology for the removal of hazardous chemical compounds present in the industrial effluents. Kinetics for the degradation of MB by CdS/NiS nanocomposite was studied systematically. Kinetics of H2 Evolution of N2H4H2O by CdS/NiS nanocomposite under Visible light and UV light has been studied. The synthesized photocatalyst shows appreciable HER with Tafel slope (Visible light/23.5 and UV light/42.5) considering the high photocatalytic efficiency of CdS/NiS photocatalyst it may be very good catalyst for hydrogen evolution for the oxidation of Hydrazine (N2H4H2O). The synthesized photocatalyst shows applicable performance for kinetics of Hydrogen Evolution Reaction (HER) in Visible light and UV light. The decomposition of hydrazine (N2H4H2O) proceeded rapidly to generate free hydrogen rich gas through OH radical contact with CdS/NiS nanocomposite at room temperature.
Acknowledgements
Shilpa. R is grateful to UGC-BSR, IOE, UPE, CPEPA, DST-PURSE and university of Mysore.