Analysis of the Microeconomic Factors of the Financial Inclusion of the Population in the Republic of Congo ()
1. Introduction
The financial reforms of the 1980s and 1990s that took place in most countries were intended to improve the financial depth and use of formal financial services, such as loans, savings and payment services (Haoudi & Rabhi, 2018). However, three decades after the implementation of these policies, the degree of access to and use of formal financial services remains very low in developing countries (the rate of bankization is on the order of 10 to 20 percent in low-income countries). To address this financial exclusion, which affects the most vulnerable populations to varying degrees in both advanced and developing countries, the G20 countries have decided to make financial inclusion a priority on the international development agenda.
Financial inclusion, defined as the access of adult populations to a range of financial products and services offered by formal financial institutions, has been the subject of theoretical and empirical debates. Theoretically, the debate on financial inclusion can be grouped around two theories (the theory of the frontiers of access opportunities and the theory of barriers to access). According to access opportunity frontier theory, access to financial services depends on the cost of financial services, product diversity, density of banking infrastructure, etc. (Beck & De la Torre, 2004; World Bank, 2009). In contrast, the second theory (the theory of barriers to access) considers price, information and cultural values to be barriers to financial inclusion (Honohan, 2004; Chamberlain & Walker, 2005).
Empirical results continue to fuel the debate in that some findings, for example, support increased education, cell phone ownership, and infrastructure density as key determinants of financial inclusion (Honohan & King, 2009), while others argue that employment, age, gender, and education are important factors in financial inclusion (Johnson & Nino-Zarazua, 2009). This debate highlights the importance of empirical analyses related to financial inclusion issues.
Despite this recognition of the importance of financial inclusion in the literature, some countries are still struggling to ensure that all people have access to financial services. Indeed, the average rate of use of financial services is only 26% in developing countries, compared with 90% in OECD countries (Claessens, 2006). In sub-Saharan Africa, only 34% of adults have an account in a formal financial institution, compared to the average of 60% worldwide and 94% in high-income countries (Demirgüç-Kunt et al., 2015).
In Congo, there is growing interest in the issue of financial inclusion. After the Maya conference in 2011, Congo committed to strengthening financial inclusion to make access to financial services visible. The rate of bankization of the population increased from 3.8% in 2010 to 12.5% in 2015. Additionally, the banking network, once characterized by low density, has been growing since 2011 (increasing from 36 branches in 2010 to 88 branches in 2015). This justifies the increase in the number of banks from 6 in 2010 to 11 in 2015. Similarly, the number of ATMs increased from 11 to 102. However, the financial services offered by banks do not cover all the needs of the population (11 banks provide financial services). Other unmet needs are covered by microfinance institutions (MFIs), which offer accessible services, particularly to the poorest and those in areas not covered by credit institutions (29% of MFIs are located outside the two major cities, Brazzaville and Pointe-Noire). Similarly, mobile payments, which have become an increasingly popular financial service, are also provided by two cell phone companies (ENIF, 2015).
Despite this performance, the World Bank and the IMF believe that the banking network is still far from meeting all the needs of the population. The bank penetration rate remains low, and the financial services offered are still inaccessible to a large segment of the population. This is why this study focuses on the factors that explain financial inclusion. The question at the heart of this work is therefore the following: what are the microeconomic factors that explain the probability of a person being financially included? The objective of this article is to identify the microeconomic factors that allow an individual to be financially included. To do so, the study is based on the hypothesis that financial inclusion depends on the individual characteristics of the Congolese population.
The rest of the article is organized as follows: in the second section, we present the literature review. The third section addresses the methodological approach. In the fourth section, we present and discuss the results. Finally, in the fifth section, we conclude and present the policy implications.
2. Literature Review
In this section, we take stock of the theoretical and empirical work on the microeconomic determinants of financial inclusion. With respect to the theoretical work, two theories (access opportunity frontier theory and access barrier theory) help explain the problems of financial inclusion. Developed by Beck and De la Torre (2006), access opportunity frontier theory uses the law of supply and demand to identify problems in access to banking and financial services. According to this theory, access to financial services depends on the cost of financial services, the diversity of products offered and the density of banking infrastructure. It is clear that costs play a major role in the choice to use any service in any sector, and the costs of using a financial service are among them. The cost of owning a current account depends on account maintenance fees and commissions paid on payments (World Bank, 2009). It is in this sense that Chidzero et al. (2006) argue that excessively high costs (fees and interest rates) can be seen as barriers to financial inclusion. Indeed, financial services may be too costly for clients, as there may be requirements for minimum deposit amounts and fixed costs that are too high for poor households (Beck & De la Torre, 2004; World Bank, 2009).
In addition, the use of a financial service is related to the diversity of products offered by financial institutions. According to the World Bank (2009), financial inclusion can be justified by simplifying the process for opening an account, applying for a loan, or joining another type of financial service. Additionally, the length of time it takes to process applications may explain whether financial services are used (Beck & Demirgüç-Kunt, 2008). A lack of collateral or formal identification may be a barrier to financial inclusion (Beck & De la Torre, 2004; Claessens, 2006). Finally, the use of financial services also depends on the density of banking infrastructure (Guerineau & Jacolin, 2014). In this sense, Beck et al. (2009) argue that the geographic location of branches and service points influences the ease with which customers can access financial services.
In addition, economic factors, such as employment status, income, income flows and debt, can be considered criteria for client selection. Bank preferences are in favor of individuals who are employed and who demonstrate some degree of job stability. Income, on the other hand, is considered to be the primary client selection criterion. Indeed, the bank tends to select wealthy individuals insofar as they can provide a minimum of guarantees that limit the bank’s risk. Similarly, income flows are an important criterion for the financial inclusion of agents. By observing movements in the client’s bank accounts, the bank can obtain good information on the client’s income flows. It is in this sense that Ramji (2009) believes that the lack of income or financial discipline of some individuals explains their non-inclusion. The level of debt is also considered a criterion for selecting clients. Indeed, a client who is already highly indebted may be refused an additional loan because of the risk of over indebtedness. From this perspective, the World Bank (2008) estimates that poor clients often have no tangible collateral to offer and cannot borrow against future income due to lack of stable employment.
In contrast, access barrier theory views price, information, and cultural values (language, ethnicity, and religion) as barriers to financial inclusion (Honohan, 2004; Chamberlain & Walker, 2005; Beck et al., 2005; Beck & De la Torre, 2006). Indeed, prices, which are the result of very restrictive regulations, can have repressive consequences and thus be a barrier to financial inclusion. Regarding the information barrier, which refers to the difficulty of measuring household solvency, Honohan (2004) raises the problem of information asymmetry, which constitutes an important obstacle in the distribution of credit. Indeed, the lack or inadequacy of information on clients’ credit history can constitute an additional risk (Beck & De la Torre, 2004) and thus be an obstacle to financial inclusion. In addition to information asymmetry, financial illiteracy, which refers to “the inability to read or write in the official language of the country”, is also a significant barrier to financial inclusion. Thus, a lack of knowledge about products and procedures can hinder financial inclusion (Beck & Demirgüç-Kunt, 2008; Ramji, 2009). Education is thus considered one of the determinants of financial inclusion (Demirgüç-Kunt & Klapper, 2012), as it refers to an individual’s ability to deal with a financial institution. It is easier for the highly educated to use the services of financial institutions.
In addition, cultural values (specific to certain ethnic groups and religions) have a great influence on banking exclusion. Indeed, certain ethnic groups living in autarky, i.e., living in isolation because of discrimination, forbid their nationals to have any contact with the derivatives of globalization, including financial services. In the same vein, certain religions (Islam, for example) are opposed to financial practices that give rise to the perception of interest, particularly usury (Collard et al., 2001). They reject the practice of credit services or paid savings products.
In addition to these barriers, factors such as family size, gender, and age are considered criteria for client selection by financial institutions. Indeed, the size of the client’s family may be considered a selection criterion in that the bank prefers to extend credit to a client with a small family rather than a large family. Gender considerations indicate that women are more likely to be excluded than men. This is partly due to differences in educational attainment that prevent women from finding lower-level jobs and partly because some women indirectly use their husbands’ bank accounts. Finally, age is also considered a selection criterion. Indeed, the young and the old are often financially excluded. The young do not meet the legal age requirement (the minimum age set by law) for using financial services. These young people do not usually need to use financial services, as they are under the guardianship of a parent or use financial services indirectly through a parent. Likewise, older people, whose retirement is synonymous with a decrease in financial resources, often face both financial and physical barriers to using financial services.
Several empirical works have been carried out. Among them, Demirgüç-Kunt and Klapper’s (2013) study of the use of financial services for 148 developed and developing countries is noteworthy. Using data from the World Bank’s Global Findex and three main indicators of financial inclusion (bank account ownership, savings in a bank account, and the use of bank loans), the authors find that income is a major determinant of financial inclusion. Similarly, Camara et al. (2014), using a probit model and controlling for individual characteristics, find that education and income levels are significant variables in determining financial inclusion in Peru. Fungacova & Weill (2015) study financial inclusion in China using data from the World Bank’s Global Findex and a probit model and find that income and education increase the level of financial inclusion and that married men and the elderly have higher levels of financial inclusion. Additionally, Tuesta et al. (2015), carrying out a similar study in Argentina and using a probit model, conclude that both income and education are important factors for financial inclusion.
In Africa, Honohan & King (2009) analyze the relationship between banking and age, gender, education, income, location, financial knowledge, trust in banks, and risk aversion using Finscope data from 11 African countries and a probit model and find that income and education enhance financial inclusion and that men and older people have higher levels of financial inclusion. Additionally, having more confidence in the banking system increases the likelihood of being banked. In contrast, the authors find that the more people know about the financial sector, the less likely they are to be banked. Similarly, Efobi et al. (2014), using a logit model, explored the factors influencing the access to and use of banking services in Nigeria. Their results reveal that individual attributes, income, and ICT use are significant factors influencing the use of banking services. Zins & Weil (2016) use the World Bank’s Global Findex database of 37 African countries and a probit model to analyze the determinants of financial inclusion in Africa. Their results indicate that the microeconomic characteristics that most influence financial inclusion are education and income. Finally, Haoudi & Rabhi (2018) analyzes the determinants of financial inclusion in Africa and concludes using a probit model that, on the one hand, education promotes financial inclusion and, on the other hand, the size of the informal sector and the associated employment vulnerability are barriers to financial inclusion.
This literature review shows that there is no consensus on the determinants of financial inclusion. Some authors focus on individual characteristics, while others focus on socioeconomic status. Developments in recent work on the issue highlight the continuing interest in this area. This lack of consensus encourages further analysis. The choice of the Congo as the context for investigation can provide rich lessons, especially since such studies are rare for this country. Finally, most of the authors mentioned in the literature review used the probit model, and this article uses the logit model. Indeed, the logistic law of the logit model flattens less quickly than the normal law of the probit model, making the logit model easier to interpret (Johnson & Nino-Zarazua, 2009).
3. Methodology
The theoretical model used as a support is the logit model developed by Johnson and Nino-Zarazua (2009). This model seeks to explain the impact of individual characteristics on financial inclusion. For an individual, therefore, we have a variable Y that equals 1 if he or she is included in the financial sector and 0 otherwise. In fact, Y takes the modality 1 if the utility that the individual included in the financial sector has is greater than the current utility that may not satisfy him or her. Variable Y can thus take only two modalities, making it a binary distribution for which the appropriate model is the binary choice model, with a qualitative explained variable.
The utility levels of individuals are therefore not directly observable, as they depend on education level, age, income, etc. This supposes that two parts make up the utility function, the first called deterministic and the second called random. The deterministic component depends on the characteristics of the respondents, while the random component (unobservable variables) in the model leads to reasoning in terms of probabilities. Raffestin states in this regard that a qualitative random variable is described by the probabilities of the different modalities it can take.
Let us consider a sample of N indexed individuals i = 1, ..., N. For each individual, we check whether the financially included event has occurred. Let Ui be the observed variable indicating whether the individual is financially included. More precisely, Ui is 1 if the individual is included financially.
Either
With
(1)
where Xi represents the vector of explanatory variables (level of education, age group, etc.), α the vector of parameters to be estimated, εi the error terms and
the latent variable that models the probability of individual i being financially included. Thus, our model for estimation purposes is as follows:
(2)
where
represents the matrix of explanatory variables, βi represents the matrix of coefficients associated with the explanatory variables, and IF represents the variable to be explained (financial inclusion). Estimates of the parameters of the selected logistic models are carried out using the maximization algorithms of a log-likelihood function. The likelihood can be written as:
Thus, the log-likelihood is:
4. Data Source, Study Variables and Descriptive Statistics
The data used for the econometric regressions in this research are from the ENIF, conducted among people aged 18 and older in 2015 by the BEAC and the National Economic and Financial Council. The choice of this data source is justified by the fact that it is directly related to issues of financial inclusion. Moreover, the ENIF database has the advantage of providing recent data. Our working sample includes 1912 individuals from the cities of Brazzaville, Pointe-Noire, Dolisie, Nkayi, Oyo, Ouesso, and Impfondo.
Before parameter estimation, the following variables are selected on the basis of the literature and the objective of this study. Financial inclusion: This is the explained variable of our regression; it takes the value 1 if the individual is financially included and 0 otherwise. It is constructed from the definition of the Alliance for Financial Inclusion (AFI). The AFI recommends three dimensions to measure the degree of financial inclusion: the access, use, and quality of financial services. In this study, we constructed a composite variable of financial inclusion using two dimensions (access and use), which were captured using several questions available in the National Financial Inclusion Survey questionnaire.
To capture the dimension of access to financial services, the questions of whether the individual has an account in a bank or in a microfinance institution in the ENIF were used. This variable takes a value of 1 if the individual has an account in a financial institution and 0 otherwise.
The use of financial services is approached by the following question: in the last 12 months, have you borrowed from (or had savings in) a financial institution? This question is coded as 1 if individuals borrowed from (or had savings in) a financial institution and 0 if not.
The explanatory variables are guarantees required (Claessens, 2006), product diversity (Honohan, 2004), gender (Honohan & King, 2009), age (Honohan & King, 2009), job type (Haoudi & Rabhi, 2018), education level (Zins & Weil, 2016), marital status (Fungacova & Weill, 2015), having a mobile money account (World Bank, 2009), and income (Zins & Weil, 2016).
The hypotheses adopted for the effects of the different explanatory variables on financial inclusion in this study are represented by the signs in Table 1. The signs reflect the effect of these different explanatory variables on financial inclusion. The positive sign reflects the positive effect of a variable on financial inclusion and the sign, the negative effect on financial inclusion.
![]()
Table 1. Expected Signs of Core Variables
Source: Author based on ENIF (2015) data.
5. Results
Before performing the econometric analysis, we will first describe the basic variables of the ENIF used for this study. The descriptive statistics of the variables used in our work are as follows:
Source: Author based on data from the ENIF (2015).
Table 2 provides information on the characteristics of the sample considered in this study. It indicates that the sample is dominated by people who are not financially included (59.1%) and that 53.62% of the respondents hold paid employment. Moreover, the incidence of men (57.62%) in the database was much higher than that of women (42.38%). The ENIF database has more single people (51.44%) than married people (45.17%). In the sample collected, the majority of respondents were between 35 and 65 years old (49.82%). Additionally, the majority of respondents had a secondary school level (32.03% for secondary 1 and 34.73% for secondary 2) and a higher level (24.37%). In addition, 85.81% of the respondents had a mobile money account. For the variable “demand for fewer guarantees”, the frequency is high (69.72%). This is very high with regard to the diversity of products offered (76.29%). If we look at “income”, the calculated parameters show that the values of the income variable are highly concentrated around the average. Indeed, the standard deviation corresponding to the mean is equal to 1.373666, while the value of the mean is 3.104803.
After describing the database, we will proceed with the econometric analysis. With regard to the results presented in Table 3 below, we can see that the value of the maximum likelihood is large in absolute value (−229.42116). This leads to the conclusion that the data are compatible with the model proposed. For Wald’s chi 2, the associated probability is less than 5%. This means that the independent variables as a whole are related to the dependent variable. Finally, for each variable, the associated Wald tests show to what extent each independent variable is significantly related to the dependent variable.
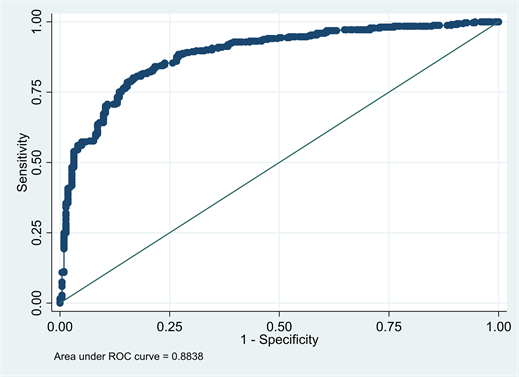
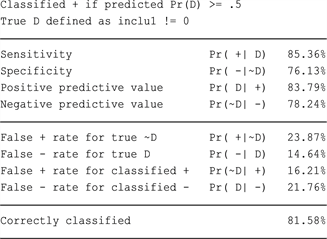
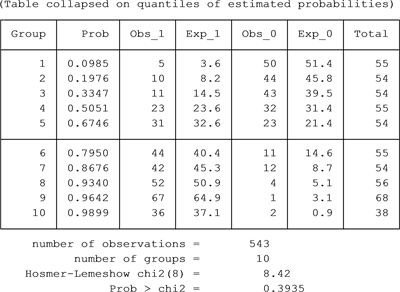
Concerning the model fit tests, the classification test (Appendix) that allows us to apprehend the explanatory power of the model shows that the percentage of correct predictions with the logit model is 81.58%. In addition, the results of the Hosmer-Lemeshow test, which allows the verification of the quality of the estimated model, show that the probability is equal to 0.3935 and higher than the 1% threshold, which means that the fit to the logit model is good. With regard to the discriminatory power of the model, the ROC curve (in Appendix 1) shows that there is good discrimination since the area under the curve is between 0.80 and 0.90. This means that the model is acceptable. All the conditions being met, it can be concluded that the selected models are valid, and we can move on to the interpretation and discussion of the results.
![]()
![]()
Table 3. The results of logit estimation of the determinants of financial inclusion.
Source: Author based on data from the ENIF, 2015. ***p < 0.01, **p < 0.05, *p < 0.1.
Overall, the results obtained after the estimation of the logit model allow us to draw two main conclusions: on the one hand, the requirement of fewer guarantees is an incentive for financial inclusion, and on the other hand, individual characteristics are the factors determining financial inclusion in the Republic of Congo.
· Fewer collateral requirements: an incentive for financial inclusion
The regression results presented in Table 3 indicate that the “less collateral requirement” variable has a positive and significant effect on the probability of financial inclusion in the Republic of Congo. All other things being equal, this means that requiring little collateral increases the likelihood of financial inclusion by 8.26% compared to requiring more collateral. This result can be explained by the fact that in recent years, Congolese banks that previously required high collateral have been relaxing their collateral requirements. Moreover, this result reinforces the theory that the lack of collateral to offer is an obstacle to financial inclusion.
· Individual characteristics as factors in financial inclusion
Looking at the results in the table above, income, age group, education level, and marital status are the microeconomic factors influencing financial inclusion in the Congo. These variables are significant and have the expected signs. All other things being equal, the results of this study point out that individuals having a secondary 2 education increase the probability of financial inclusion by 15.8% compared to those with no education or only primary education. This increase is 12.3% for those with higher education levels. This is because an individual who does not have many years of education is less able to understand and use available financial products. This finding confirms the results of Honohan and King (2009), who showed that an increase in the level of education increases the probability of being banked.
Income also has a positive effect on the likelihood of financial inclusion. Indeed, the results show that an increase of one unit in income increases the probability of financial inclusion by 12.1% In other words, as income increases, the probability of financial inclusion increases by 12.1%. Moreover, this result confirms that of Honohan and King (2009), who highlight that the rate of bank ownership is positively related to income. This result is justified in the context of the Congo by the fact that Congolese banks, to accumulate more profits, move away from poor clients (without income) to more affluent clients (without income). This is because the risk of offering financial services to individuals with no income is higher than that associated with individuals with income.
Taking into account the age group variable, we see that individuals aged 35 to 65 years have an 11.5% higher probability of financial inclusion than individuals aged 18 to 25 years. This result is consistent with that obtained by Honohan and King (2009), since these authors showed, all other things being equal, that older people have high levels of financial inclusion. This result assumes, among other things, that the elderly are the most affluent segments of the Congolese population and therefore constitute a positive signal to financial institutions and that allows them to benefit from financial services. Indeed, the elderly being the most affluent strata (i.e. having an income or a pension) therefore have the possibility to open a bank account, apply for credit, make bank deposits, etc.
With regard to the “marital status” variable, we find that the “married” modality is positive and significant. Compared to those who are single, those who are married have a 6.62% higher chance of being included financially. This result is supported by the study of Fungacova & Weill (2015), which shows that being married increases the chances of financial inclusion. We can explain this result by the fact that Congolese banks prefer to grant services to married people rather than to single people. Being married can in some ways be a guarantee of responsibility.
6. Conclusion and Policy Implications
Given the low level of financial development facing the Congolese financial system, we felt it would be useful to supplement the literature on financial development by analyzing the microeconomic factors of the financial inclusion of the population in the Republic of Congo. The objective of our study is to highlight the factors that facilitate the financial inclusion of the population. To achieve this objective, we used a logistic model, estimated using the maximum likelihood method and survey data from the BEAC and CNC du Congo in 2015.
Two lessons can be drawn from the econometric results obtained. First, the variable “fewer guarantees required” explains the financial inclusion of the population in the Republic of Congo; i.e., the estimates obtained indicate that the requirement of fewer guarantees by banks allows more people to be included financially. Second, the results show that income, education, age group, and marital status are individual factors associated with financial inclusion in the Congo. This implies that to further promote financial inclusion in the Congo, financial institutions must continue the policy of reducing collateral requirements. Additionally, these institutions as well as the government must invest in education, which can have a long-term positive effect on financial institutions and on the financing of the economy.
Beyond this analysis, we believe that a reflection on the macroeconomic determinants can be the subject of future work in order to promote a better understanding of the phenomenon of financial inclusion of the population in.
Appendix 1: Classification Test
Hosmer Lemeshow Test
ROC curve: