
1. Introduction
The maximum reduction of the received dose for the personnel working with ionizing radiation is a very important problem in the modern world. While the patient receives a dose only during the procedure, the staff working with the equipment receive a dose (from the scattered X-ray radiation) every day during work. This is the reason why we focused our efforts on studying the dose load of personnel working with the C-arm X-ray system. This type of X-ray equipment can be used for life-saving procedures in various fields of medicine, such as orthopedics and traumatology, surgery, urology, cardiology, and others. These areas of medicine need special flexibility in choosing the direction of the imaging. Flexibility in choosing the direction of the imaging, as well as preserving the geometric dimensions in different directions is achieved by using the constructive solution of the C-arm X-ray equipment [1] .
Along with the positive aspects, the use of this equipment leads to exposure harmful influence of the personnel working with it. Radiation protection from scattered radiation from the irradiated body, the patient table, the housing of the equipment and all other objects in the room, is very important for maintaining the health and life of people working in an environment with ionizing radiation.
The research in this direction is urgent and necessary and is performed continuously.
The purpose of work of C. Guo and his co-authors is to develop a database of 3D scattered radiation dose-rate distributions to estimate the staff dose by location around a C-Arm fluoroscopic system in an interventional procedure room. The results show that shape of the phantom will affect the dose-rate distribution at distances less than 100 cm, with a higher intensity for the super-ellipse. This database will allow estimation of the scatter distribution in the procedure room and, when displayed to the staff during a procedure, may facilitate a reduction of occupational dose [2] .
In the paper “Real-time, ray casting-based scatter dose estimation for c-arm X-ray system”, a novel ray casting approximation of radiation transport is presented and the potential and limitation vs. a full Monte Carlo transport and dose measurements are discussed. The X-ray source of a Siemens Axiom Artix C-arm is modeled by a virtual source model using single Gaussian-shaped source [3] .
Our study examines the dose load received by staff working with a C-arm X-ray system at the Clinic of Orthopedics and Traumatology. There are two main operating modes of the C-arm X-ray system used for orthopedic procedures, namely: radiography (single shot); here a single image is taken of the region of interest; this mode has variations for different parts of the body, with respective factory-set parameters for the X-ray tube:
・ for examination of shoulder;
・ for examination of wrist;
・ for examination of lower leg;
・ for examination of foot, etc.
ü fluoroscopy―here the object is observed in real time.
ü the fluoroscopy modes have two variations: LDF―Low Dose Fluoroscopy и HDF―High Definition Fluoroscopy.
ü each of them has three sub modes:
・ continuous fluoroscopy;
・ 1/2 dose fluoroscopy;
・ pulse fluoroscopy.
In the continuous fluoroscopy mode X-ray radiation is generated all the time during the examination. The 1/2 dose fluoroscopy is a variation aimed to reduce the radiation dose. The dose rate is reduced by at least 50% compared to continuous fluoroscopy. During this sub-mode for examination lasting 1 s the X-ray tube generates radiation during 1/2 s and the rest of the time no radiation is generated. Pulsed fluoroscopy is suitable for dynamic imaging (of moving objects). In the pulse mode with 7.5 fr/s exposition is 66.6 ms per frame. In this sub-mode the X-ray tube emits pulses of radiation about 7 times per second, where each pulse lasts 66.6 ms. So the total time of emitting radiation is 499.5 ms, for an examination lasting 1 s [1] [4] .
Main goal
The main goal of our study is, based on practical measurements, to compare the dose load on staff, which gives the two main modes of the “C-arm”, used for orthopedic procedures, in position of the X-ray tube below the patient’s table.
2. Methods
Dosimetric measurement
We measured the values of the dose received by the operator and his assistant at three points on their bodies―head, gonads and feet, in both modes of operation of the C-arm.
Based on the obtained dose values, the dose rates for each of the operating modes and all measured points of the body of the operator and his assistant were calculated. Dose rate calculation was necessary because the exposure time was different for each mode and so through the dose rates, the comparison becomes easier.
We also calculated the time to reach the maximum annual dose allowed for staff, which is 20 mSv, as stipulated in Bulgarian legislation. The values from this calculation show the results of the measurements more clearly [4] .
3. Practical Measurements
The practical measurements were made in the Clinic of Orthopedics and Traumatology of University Hospital St. Marina Varna, Bulgaria [4] .
3.1. Participants
Participants in the dosimetric measurement:
・ author of the article,
・ service engineer maintaining the X-ray equipment―the measurements were carried out under the direct and continuous control of the service engineer of the X-ray system,
・ medical physicist of the hospital who works with the measuring equipment,
・ surgeon―a specialist from the clinic of orthopedics and traumatology with instructions about the used medical procedures [4] .
3.2. Devices and Materials
For our measurements we used an X-ray system type C-arm Phillips BV Vektra (Figure 1), positioned in the clinic of orthopedics and traumatology.
For the measurements a digital dose meter of the type FH 40 G-L (Figure 2) was used. The Thermo ScientificTM FH 40 G-L is a wide range digital Geiger counter suitable for nearly all measurement tasks arising in radiation protection [5] . For the measurements we used a phantom. For the phantom we used a plastic bottle with a volume of 11 liters filled with water (Figure 3). The phantom was placed on the patient’s table, directly under the X-ray beam [4] .
![]()
Figure 1. X-ray system BV Vectra―mobile С-arm [1] .
![]()
Figure 2. FH 40 G-L multi-purpose digital survey meter [5] .
3.3. Procedure
During our measurements, we irradiated the phantom using the two main modes of the C-arm―radiography (single shot) and low-dose fluoroscopy (LDF-Low Dose Fluoroscopy). We used the three modes of fluoroscopy―continuous fluoroscopy, 1/2 dose fluoroscopy and pulse fluoroscopy.
The operating parameters under which the study was performed were:
・ radiography (single shot); X-ray tube parameters: U = 58 kV; I.t = 10.35 mA.s;
duration of the single shot t = 467 msec.
・ fluoroscopy:
・ continuous fluoroscopy; X-ray tube parameters: U = 58 kV; I.t = 3.45 mA.s;
exposure time t = 3 sec.,
・ 1/2 dose fluoroscopy; X-ray tube parameters: U = 58 kV; I.t = 3.45 mA.s;
exposure time t = 6 sec.,
・ pulse fluoroscopy; X-ray tube parameters: U = 58 kV; I.t = 3.45 mA.s;
exposure time t = 6 sec.
The position of the C-arm is perpendicular to the patient table, with the X-ray tube placed below the patient table and the image intensifier above it. The distance between the X-ray tube and the patient is 70 cm. The distance between the C-arm axis (the axis connecting the X-ray tube and the image intensifier) and the surgeon is 60 cm, and to his assistant―100 cm. The surgeon is sitting (as close as possible) near the patient, and the assistant stays upright. Measurements were made for three points of the bodies of the personnel working with the equipment: head, gonads and feet (Figure 4).
When using the radiography mode, the mobile station can be set to directly produce pictures of a specific part of the body: arm, leg, chest, etc. Each of these sub-modes has specific preset kV and mA.s, which cannot be changed during the radiography examination. These preset parameters are in accordance with the average parameters of the examined object (size, shape, density, etc.). However, if the properties of the irradiated object differ significantly from these averages (for example―a hand of a small child or a fairly full patient), the picture is not of high quality and the information value of the image is reduced.
![]()
Figure 4. Positions and distances during the study.
When using the fluoroscopy mode, the X-ray tube starts an automatic mode, in which on the basis of the data obtained from the irradiation of the object (shape, size, density, etc.) it sets optimal values of mAs and kV. So a highest quality and informative image of the irradiated object is obtained. If after the use of fluoroscopy mode the system is used in radiography mode, the collection from the fluorography is used (this is a factory setting). So in radiography mode the optimal data are used in order to get the best image for the region of interest of the respective patient [1] .
No members of the personnel and the research team were present during our measurements in the procedure room for reasons of radiation protection. The door to the room was left open, and the team stood behind the wall of the room to ensure maximum protection from scattered radiation. Only the C-arm stand remained in the procedure room. The station with the monitors was placed in the corridor outside the procedure room. The measuring device was placed on a stand that could be moved horizontally and vertically. In this way, the required measuring point could be selected.
Due to the fact that the measurement is carried out with a phantom that was of smaller size than the normal human body and that there were no personnel in the treatment room, it is expected that the scattered radiation is lower. This difference is not great and therefore we could apply these results to real situations as well [4] .
4. Results
At different positions of the X-ray tube and the protective shield placed on the patient’s body, 15 to 20 repetitions of measurements were made for the same parameters of the X-ray tube.
Comparison of the calculated dose rate that was sent to the operator and his assistant for the three points in the three different modes of operation of the X-ray tube.
To accurately compare the results obtained, we calculated the dose rate of each measurement due to the fact that the exposure time of the different modes is different (Tables 1-4).
![]()
Table 1. Average values recalculated for the dose rate received by the surgeon and his assistant using radiography mode (single shot).
![]()
Table 2. Average values recalculated for the dose rate received by a surgeon and his assistant using continuous fluoroscopy.
![]()
Table 3. Average values recalculated for the dose rate, received by the operator and his assistant using 1/2 dose fluorography.
![]()
Table 4. Average values recalculated for the dose rate, received for the operator and his assistant using pulse fluorography.
These values are shown on the diagrams for better clarity (Diagrams 1-4). The values are shown with accuracy to the fourth decimal place in μSv/s. The values are shown multiplied by ×10−4.
When comparing the dose rate, the difference of the radiation load for the different modes of operation is very clearly distinguished.
Comparing the radiography mode (Diagram 1) with the fluoroscopy modes (Diagrams 2-4), a six and more times lower value of the dose rate for the fluoroscopy modes is observed. For the gonads, where the measurements showed maximum radiation, the dose rate for the surgeon is 0.0642 μSv/s in radiography mode (Diagram 1) and 0.0100 μSv/s for continuous fluoroscopy mode (Diagram 2). The latter is the most unfavorable fluoroscopy mode concerning the dose load. For the other two fluoroscopy modes (Diagram 3 and Diagram 4) the dose rate is half of that for the continuous fluorography―between 0.0048 μSv/s and 0.0050 μSv/s.
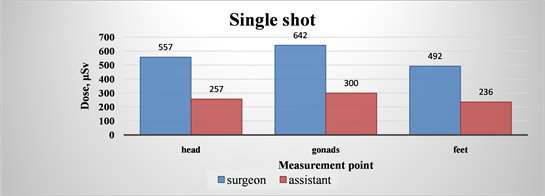
Diagram 1. Average values recalculated for the dose rate, received for the operator and his assistant using radiography mode (single shot).
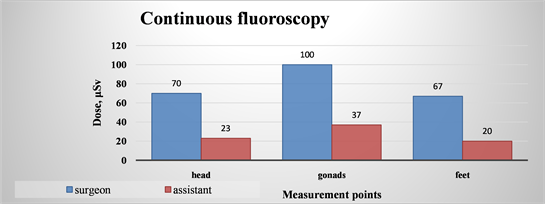
Diagram 2. Average values recalculated for the dose rate, received for the operator and his assistant using continuous fluoroscopy.
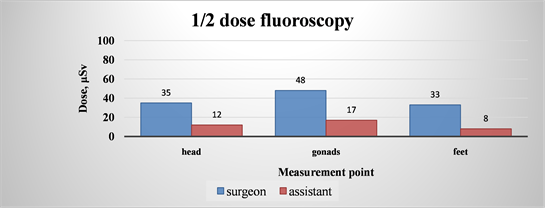
Diagram 3. Average values recalculated for the dose rate, for the operator and his assistant 1/2 dose fluorography.
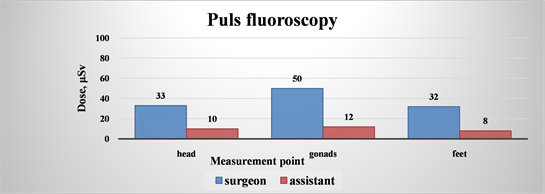
Diagram 4. Average values recalculated for the dose rate, for the operator and his assistant using pulse fluorography.
The dose rate values calculated for the assistant’s gonads are even greater (almost 10 times), namely 0.03 μSv/s for radiography mode (Diagram 6) and 0.0037 μSv/s for continuous fluorography (Diagram 2). The difference between the dose rate for radiography (Diagram 1) and 1/2 dose fluoroscopy (Diagram 3) is more than 17 times (the value for the 1/2 dose fluoroscopy is 0.0017 μSv/s). The difference between radiography and pulse fluoroscopy (Diagram 4) is 25 times (the value for the pulse fluorography is 0.0012 μSv/s).
When comparing the dose rate values for the surgeon at the point of the lowest radiation, namely the feet, the difference between the radiography and the fluorography is also very pronounced. For the radiography mode (Diagram 2) compared to the continuous fluoroscopy (Diagram 1) the radiography is more than 7 times more radiation load unfavorable (0.0067 μSv/s for fluoroscopy and 0.0492 μSv/s for radiography). The comparison of radiography and 1/2 fluoroscopy (Diagram 3) shows a difference of almost 15 times (0.0033 μSv/s for 1/2 dose fluoroscopy) (0.0033 μSv/s for а 1/2 dose fluoroscopy); the comparison of radiography and pulse fluorography (Diagram 4) shows more than 15 times (0.0032 μSv/s for pulse fluoroscopy) greater dose load.
Comparing the dose rate for the assistant at the point of the weakest irradiation point (the region around the feet), the differences are even greater. The values for the continuous fluoroscopy (Diagram 2) are almost 12 times lower than the values for radiography (Diagram 1―0.0236 μSv/s, for radiography and 0.0020 μSv/s for continuous fluoroscopy). The difference between radiography and 1/2 dose fluoroscopy (Diagram 3) is more than 32 times greater; same is the case for pulse fluoroscopy (Diagram 4).
Comparison of the calculated time for reaching the dose limit for staff, for the place of the surgeon and the place of his assistant, in three measuring points and for the different modes of operation of the X-ray tube.
For better clarity, we calculated the time for continuous operation of the X-ray system needed to reach the limit of 20 μSv for one calendar year (stipulated by the Bulgarian legislation). The data for the doctor-operator are shown in Table 5, and for his assistant in Table 6. On Diagram 5 is shown a comparison of these data for the operator and on Diagram 6 for the assistant. It is clear from the diagrams that the time to reach the dose limit for both the surgeon and his assistant differs greatly in the radiographic and the fluoroscopy modes.
The time for reaching the annual dose limit for the surgeon in the measure point “gonads” (Diagram 5―the most unfavorable radiation loaded point) for radiography mode is only 3.6 days continuous work. At the same time even for the heaviest mode of the fluoroscopy, namely the continuous fluoroscopy this time is 23.2 days (the time is increased 7 times). For 1/2 dose fluoroscopy the time is 48.2 days (about 14 times longer), and for pulse fluoroscopy it is 46.3 days (which is about 13 times longer).
For the point of the lowest dose, namely “feet”, the time until reaching the limiting annual dose for the surgeon (Diagram 5), is 4.7 days for radiography mode. For continuous fluorography this time is 34.5 days (an increase almost 7 times); for 1/2 dose fluorography the time becomes 70.2 days (almost 15 times longer); for the pulse fluorography the time is 72.3 days (more than 15 times) (Diagram 5).
These results show clearly that the use of fluoroscopy modes is much better than the use of radiography mode for the doctor-operator working in an environment of ionizing radiation (Diagram 5).
The comparison in Diagram 6 for the times to reach the annual dose limits for the assistant show similar results. Here again the most unfavorable mode is radiography: e.g. for the gonads this time is 7.7 days, for continuous fluoroscopy the time is 62.5 days and for 1/2 dose fluoroscopy and pulse fluoroscopy 163 days and 193, respectively, (almost 25 times longer) (Diagram 6) [4] .
The calculated time until reaching the limits is even more convincing for the feet where the dose load is lowest: for the radiography mode this time is 9.8 days and for continuous fluoroscopy 116 days. So, in this case the time is increased 12 times. When using 1/2 dose fluoroscopy the time is increased 17 times (namely 163 days). For the pulse fluoroscopy mode this time is increased 30 times (namely 289 days) (Diagram 6).
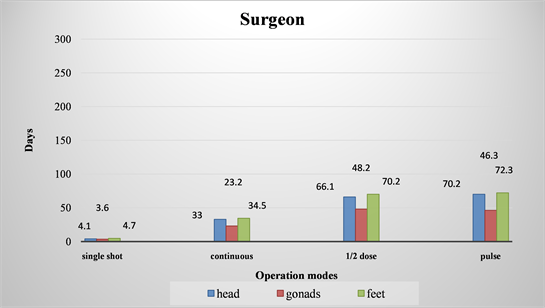
Diagram 5. Comparative graphs of time until reaching the annual limit dose value of 20 μSv for different points of the surgeon’s body.
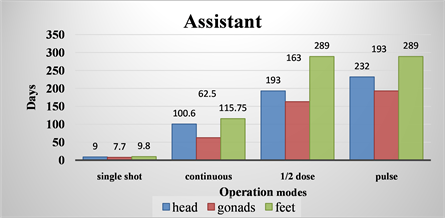
Diagram 6. Comparative graphs of time until reaching the annual limit dose value of 20 μSv for different points of the assistant’s body.
All the obtained results convincingly show the lower dose load when working with fluoroscopy modes [4] .
5. Conclusions
We made the comparison between the different modes of operation of the X-ray tube in three different ways:
・ by calculating the dose rate values at the three different points for both the operator and his assistant, due to the fact that the exposure time for the different modes is different;
・ by calculating the time at the measured points, which would be necessary to reach the dose limit of 20 μSv for the personnel according to the Bulgarian legislation.
A comparison of the dose rate from Tables 1-4 and the respective Diagrams 1-4 shows that the values for the radiography mode are much higher than the values for the fluoroscopy modes (in all variations). It can be concluded from the comparison of the radiography mode and the fluoroscopy mode with regard to the dose rate that the dose rate is many times lower in the fluoroscopy mode.
If one compares the times to reach the annual limit value for the dose exposure in Table 5 and Table 6 (or in Diagram 5 and Diagram 6), it is found that the fluoroscopy mode is at least seven times more favorable than the radiography mode. This can be seen from Diagram 5 and Diagram 6, which show a large time difference.
![]()
Table 5. Time until reaching the annual limit dose value of 20 μSv for different points of the surgeon’s body.
![]()
Table 6. Time until reaching the annual limit dose value of 20 μSv, for different points of the assistant’s body.
While in the radiography mode for the surgeon (at all measured points), the time to reach the dose limit is about half a week, in the 1/2 fluoroscopy mode, this time is about a month and a half. The difference is significant. In the same comparison for the time for the assistant in radiography mode (at all measured points) the time is about a week and a half, in the 1/2 fluoroscopy mode this time is almost one year. Here the difference is large.
Thus, one of the most important conclusions of our study is that the fluoroscopy mode is more favorable for the same exposure time.
The images obtained from the above-described modes of operation with the relevant parameters were informative enough for the purposes of the respective medical examination. In this case, it can be concluded that the single shot radiography mode can be replaced by fluoroscopy (in all three variations) for some period of time, maintaining the necessary information value and quality of the image and sometimes even higher quality.
We can also draw the following conclusions from our study:
1) When using radiography mode, with preset parameters for kV and mAs of the X-ray tube, for a certain part of the body, the resulting image may be of poor quality and low informative value. The image can be either very light or very dark if the subject is very different from the average person for whom the preset data was created. This reduces the quality of the resulting image and requires new “single shots” (one or more) to be performed in an attempt to obtain a sufficiently good image. So the dose load of the personnel and of the examined patient is increased.
2) Based on the collected properties (size and shape of the patient’s body, density, etc.) the system sets the optimal parameters for the operation of the X-ray tube, in order to get an image of best quality. Due to the fact that the fluoroscopy mode is less radiation loading than the radiography mode, this significantly reduces the dose load of the staff and the patient.
3) If at some point it is necessary to switch to radiography mode, the X-ray system automatically uses the settings obtained from the fluoroscopy mode for the same irradiated object. The radiographic made in this way will be of the best quality and informative value, with automatically set optimal parameters. So only one shot will be sufficient and the dose load of the personnel will be reduced.
4) Continuous fluoroscopy is the most radiation-loading mode of the three fluoroscopy modes, In the other two modes the dose load is almost 50% lower with values being very similar.
5) The image quality obtained in continuous fluoroscopy mode is almost indistinguishable from single shot radiography mode. Especially for the needs of the orthopedic procedures, its quality is good enough for the surgeon to receive the necessary information.
6) When using 1/2 dose fluoroscopy, the doses received by the personnel are halved compared to the continuous fluoroscopy mode with the same exposure time.
7) The image obtained using 1/2 dose fluoroscopy mode is of slightly lower quality than the image obtained by continuous fluoroscopy but the difference is quite small. The image obtained by 1/2 dose fluoroscopy is sufficiently informative for many of the procedures performed with the mobile system in the Clinic of Orthopedics and Traumatology.
8) In both radiography and fluoroscopy mode, the surgeon, who is closer to the patient and hence to the X-ray tube, receives a larger dose compared to the assistant. The difference of 40 cm in the distance to the X-ray tube has a great influence on the dose load on the personnel. (We placed the surgeon at a distance of 60 cm from the X-ray tube and his assistant―at a distance of 1 m). In this case, we have actually confirmed the law of reducing radiation by the square of the increased distance [4] .
Acknowledgements
・ We express our great gratitude to the University Hospital St. Marina Varna and the staff of the Clinic of Orthopedics and Traumatology of the hospital for their permission and assistance during our research.
・ We also express our gratitude to Philips, which supported us in our research, providing us with the necessary materials and photos used in the article.