Natural Resource Endowments and Foreign Direct Investment Flows in Sub-Saharan African Countries ()
1. Introduction
The efficient use of natural resource endowments and the implementation of strategies to attract foreign direct investment are permanent concerns of Sub-Saharan African countries to meet the aspirations of the African Union’s Agenda 2063. Africa in general and Sub-Saharan Africa in particular attract less foreign direct investment than other regions of the world. Indeed. FDI inflows in 20181 amounted to $512 billion (39.47% of global inflows) in Asia, $291 billion (22.43%) in North America, $172 billion (13.26%) in Europe, $147 billion (11.33%) in Latin America and the Caribbean, and $46 billion or 4% in Africa. FDI inflows to Sub-Saharan Africa amounted to $32 billion (2.46%). However, these figures contrast with the region’s estimated natural resource potential with respect to mineral resources, for example, which are estimated at approximately 30% of world reserves.
The literature on the link between natural resource endowments and FDI inflows has emphasized controversies both theoretically and empirically. These controversies can be structured by distinguishing two groups of authors: the first group consists of authors who believe that a country’s natural resource endowments have a positive effect on FDI inflows. While the second group includes those who do not admit this effect or condition it at most on the existence of weak institutions in the host country.
At the theoretical level, Dunning (1993) highlighted the positive effect of a country’s natural resource endowments on FDI inflows, based historically on the need for industrialized countries in North America and Europe to secure a reliable supply of raw materials. UNCTAD (2007) reinforced this idea by underscoring the predominance of multinational firms in the exploitation of natural resources predominance due to the high cost of capital and high capital intensity, which domestic investors could not bear. Moreover, natural resource endowments can have a negative effect on FDI inflows through the appreciation of the exchange rate caused by the influx of capital into the sector. This appreciation reduces the competitiveness of firms in tradable goods sectors. Which can lead to a net decline in overall FDI (Asiedu & Lien, 2011).
Empirically, Asiedu & Lien (2003), and Onyeiwu and Shrestha (2004) found a positive relationship between natural resource endowments and FDI inflows in the panel data of some African countries (Asiedu & Lien, 2003; Onyeiwu & Shrestha, 2004). However, Poelhekke and van der Ploeg (2013) concluded from their study of selected African countries that natural resource endowments have a negative effect on FDI inflows overall.
In light of these controversies, the objective of this work is to analyze the effects of natural resource endowment on FDI inflows in Sub-Saharan African countries.
The choice of Sub-Saharan Africa can be justified by: 1) the persistent controversy over the effects of natural resource endowments on FDI; 2) the need for certain countries in the region to move away from the Ricardian framework of specialization; and 3) the imperatives of sustainable development endorsed by the African Union’s Agenda 2063.
In addition to the introductory section, the remainder of this work is structured in four sections: in the second section is the literature review; the third section presents the methodology; the fourth section is devoted to the presentation and interpretation of the results; and the conclusion and policy implications are the subjects of the fifth section.
2. Literature Review
The literature, through Dunning (1979)’s OLI paradigm, has emphasized four (4) reasons that justify foreign direct investment: the search for resources, markets, efficiency and strategic assets. With regard to resources in general and natural resources in particular, with regard to their effects on FDI inflows, there is no unanimity, either theoretically or empirically.
At the theoretical level, two groups of authors have clashed. The first group of authors, Drabek et al. (2012) and Wiig and Kolstad (2010), argued that natural resources have a positive effect on FDIdue, on the one hand, to the weight of the natural resource sector in the economy as a whole, which in SSA is oriented towards extractive industries, and, on the other hand, to the poor quality of the institutions that foster a rentsharing environment between political elites and multinationals.
The second group of authors Asiedu & Lien (2011), Auty (2001), Collier and Anke (1998) , and Gylfason and Zoega (2006) have argued that there is a negative effect of the relationship between natural resources and FDI due to the crowding out effect of FDI from the natural resource sector, implying that increasing FDI in the natural resource sector will discourage investment in other sectors, and political instability, which has a repulsive effect on investment in non extractive sectors.
Empirically, many studies have assessed the effect of natural resource endowment on FDI inflows, particularly in developing countries. The results obtained have been ambiguous, especially since controversies identified at the theoretical level have also been noted. Thus, Morisset (2000), in an econometric study of 29 Sub-Saharan African countries for the period of 1990-1997, found that the availability of natural resources has a positive effect on FDI inflows, with elasticities of 0.92 and 1.2 using panel and cross-sectional data, respectively.
Asiedu (2002), Onyeiwu and Shrestha (2004), Anyanwu (2012) and Jadhav (2012) concluded that resource-endowed countries receive more FDI than non-resource-endowed countries, and the majority of these countries are oriented toward the extractive sector.
However, Asiedu & Lien (2003), using panel data from 22 African countries for the period of 1984-2000, placed this conclusion into perspective by arguing that FDI inflows into Africa are not solely motivated by its natural resource endowment and conditioning the positive effect of natural resources on the existence in the host country of a stable macroeconomic framework, political stability, good infrastructure and an effective legal framework.
Similarly, Asiedu (2006), in his study of 22 sub-Saharan African countries, found a significant, positive relationship between natural resources and FDI inflows after controlling for institutional and macroeconomic stability and political variables.
Soysa and Neumayer (2007), in their study of the effect of natural resources on FDI inflows in selected developing countries, concluded that natural resources captured by mining and oil rents have a negative effect on FDI inflows, mainly because these natural resources lie at the origin of ethnic conflicts and civil wars, reducing the stability of the business climate, which is essential for attracting FDI flows directed to the industrial and services sectors.
Analyzing the dynamics of Chinese FDI, Kolstad and Wiig (2012), in their study of 142 OECD and non-OECD economies, concluded that Chinese FDI is more oriented toward resource-rich regions characterized by low institutional quality. The same is true for Cleeve et al. (2015) and Bokpin, Mensah and Asamoah (2015) in their studies of 35 and 49 Sub-Saharan African countries during the periods of 1980-2012 and 1980-2011, respectively.
However, this conclusion is different from that found two years earlier by Asiedu (2013) in his work on some Sub-Saharan African countries where the relationship between a country’s natural resources and its FDI inflows is negative due to the phenomenon of the curse of natural resources, which generates an unstable environment that is less favorable to foreign direct investment.
In light of these contradictory results on the nature of the effect of natural resources on FDI inflows, this issue deserves further study in Sub-Saharan African countries, which must create an enabling environment to attract FDI and promote sustainable development, based primarily on the responsible exploitation of natural resources.
3. Methodology
This section is structured in seven parts: the theoretical framework and the specification of the model, the presentation of the variables of the model, the nature of the panels, the stationarity and cointegration of the variables, the stylized facts, the descriptive statistics and the estimation method.
3.1. Theoretical Framework and Model Specification
The literature on the explanatory factors of FDI flows has emphasized both macro- and microeconomic factors. In addition, the decision to invest in a foreign country depends fundamentally on the expected return on investment or the profit expected from it (Kinda, 2010). Profit (Π) is the difference between total revenue (TR) and total cost (TC). The functional form is:
(1)
with TC = IC + OC + HC; dΠ/dP, dΠ/dQ > 0 and dΠ/dCI, dΠ/dCO, dΠ/dCH < 0.
P = output price (Q) determined on the market; TC = total cost; IC = input cost (cost of labor, land, raw materials, etc.); OC = operating costs (financial costs, time costs, transaction and transportation costs); and HC = hidden cost (difference between the time and money costs reported by the government and the time and money actually paid by the investor. The variables that determine profit also determine the inflow of FDI into a country; hence, the reduced form
(2)
(3)
Considering the objective of the article, we focus our attention on the variables that determine total revenues.
Thus, with regard to the review of the literature, we retain the following explanatory variables: oil rent (OR), mining rent (MR), forest rent (FR), gross domestic product per capita (GDP_H), degree of openness (DO), FDI lagged by one period (FDI(-1)) and an indicator variable (DUMMY). The implicit form of the model is
.
The explicit formulation in panel data is as follows:
3.2. Presentation of Variables
We distinguish the explained variable from the explanatory variables.
3.2.1. Explained Variable
FDI: Foreign Direct Investment represents FDI inflows as a percentage of gross domestic product. It also captures the importance of foreign financial flows in relation to domestic production.
3.2.2. Explanatory Variables
A distinction is made between variables of interest and control variables.
1) Variables of interest
These variables are the three natural resource endowment measures used in the literature by Poelhekke and van der Ploeg (2010, 2013). From the perspective of the literature review, their effects on FDI inflows have been ambiguous. Indeed, natural resources might to some extent promote FDI inflows. However, they might also be a source of corruption and political instability that can eventually crowd out FDI (Asiedu, 2013). Thus, we have the following.
OR: Oil rent, represents all resources from oil exploitation activities. It is expressed as a percentage of GDP. The expected sign is ambiguous (
or
);
MR: Mining rent, represents the resources from mining activities. It is also expressed as a percentage of GDP. The expected sign is uncertain (
or
);
FR: Forest rent, represents the resources from logging activities. It is also expressed as a percentage of GDP. The expected sign is also ambiguous (
or
).
2) Control variables
GDP_H: Gross domestic product per capita, reflects the purchasing power of the population and represents the size of the market. According to the literature, the expected sign is positive (
);
DO: Degree of openness, represents the degree of openness of the economy. It is the sum of exports and imports relative to GDP. It is expressed as a percentage. A high degree of openness attracts investors because they can easily import capital goods and sell their products. The expected sign of the coefficient on this variable is positive (
);
FDI(−1): Foreign direct investment lagged by one period, reflects the influence of last year’s FDI on the current year’s FDI. Indeed, the existence of FDI in a country reassures investors who wish to settle there, possibilities of partnership, exchange of information, etc. The expected sign of this variable is positive (
);
is the error term;
DUMMY: Indicator variable capturing the effect of the 2008 financial crisis. The expected sign is negative (
).
3.3. Nature of the Panels
The estimation of the effect of natural resource endowment on FDI inflows is made through four panels representing the four subregions of our field of study, namely Central Africa, West Africa, Southern Africa and East Africa2. The main reason is that such an approach makes it possible to identify the specificities of each subregion. The study of panel data requires clarification of the nature (homogeneous or heterogeneous) of the data-generating process. Data exploration is performed in the first step, and in the second step, a statistical test is implemented.
3.3.1. Data Mining
This step consists of graphically appreciating the nature of the panel with double individual and temporal dimensions, as shown in the two Graph 1 and Graph 2 below.
These graphs indicate that the confidence interval of the average incoming flows is variable in both the individual and time dimensions. This double variability indicates the heterogeneity of Sub-Saharan Africa. This result can be refined by performing an appropriate test.
3.3.2. Specification Test
The results of the Hsiao (1986) test are summarized in Table 1.
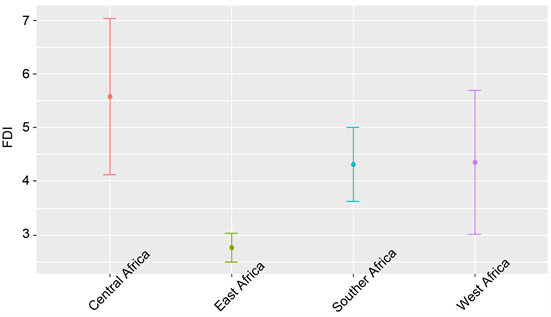
Graph 1. Individual dimension. Source: Authors, extracted from WDI BM data (2019).

Graph 2. Time dimension. Source: Authors, extracted from WDI BM data (2019).
Source: Authors, based on results obtained with Stata software, version 15.
The results of the test show that, with a 5% risk of error, the different panels are partially homogeneous. An individual effects model is estimated in the four subregions.
3.4. Stationarity and Cointegration of Variables
The nature (homogeneous or partially heterogeneous) of the different panels, as well as the need to avoid spurious regressions, leads us to study first the stationarity of the variables and second the cointegration.
3.4.1. Stationarity Tests
We use the tests of Im, Pesaran and Shin (1997, 2002, 2003), Levin, Lin and Chu and Fisher proposed by Maddala and Wu (1999) and Choi (2001). These tests have the advantages of removing the very restrictive hypothesis of the homogeneity of the autoregressive root if the null hypothesis as assumed in the first-generation tests is rejected (in particular, the test of Levin and Lin (1993)) and of considering interindividual dependence. The results are as follows (Table 2).
![]()
Table 2. Results of IPS and Fisher’s stationarity test.
Source: Authors, based on results obtained with Stata software, version 15. Null hypothesis: existence of a unit root. *: significance threshold at 10%; **: significance threshold at 5%; and ***: significance threshold at 1%.
These results show that, at the 5% significance level, the FDI, OR, MR and FR variables are I(0), I(1), I(0) and I(0), respectively, in Central Africa; I(0), I(1), I(1) and I(0), respectively, in West Africa; I(0), I(1), I(1) and I(0), respectively, in Southern Africa; and I(1), I(1), I(1) and I(0), respectively, in East Africa. It is therefore interesting to verify in the different panels whether these variables do not have long-term relationships.
3.4.2. Cointegration Test
Since the different panels are partially heterogeneous, we use Pedroni (2001) ’s test insofar as it considers heterogeneity through parameters that might be different from one individual to another. The results of the tests are the following (Table 3).
Source: Authors, based on results obtained with Stata software, version 15. Null hypothesis: absence of cointegration. *: significance threshold at 10%; **: significance threshold at 5%; and ***: significance threshold at 1%.
At the 5% significance threshold, these results indicate that the variables under examination do indeed maintain a long-term relationship in both the within and between conditions. Indeed, in Central Africa, six of seven tests validate the existence of a long-term relationship of FDI inflows with oil, mining and forestry rents; in West Africa, five tests validate this relationship; in Southern Africa, four tests validate it, and five tests do so in East Africa.
3.5. Stylized Facts
These facts relate to the evolution of FDI inflows and natural resource rents in Sub-Saharan Africa, as shown in Graph 3 and Graph 4.
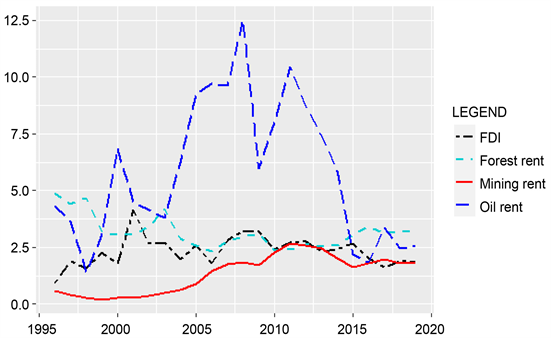
Graph 3. FDI inflows and rents as a percentage of GDP in sub-saharan africa. Source: Authors, extracted from the world bank’s WDI database.
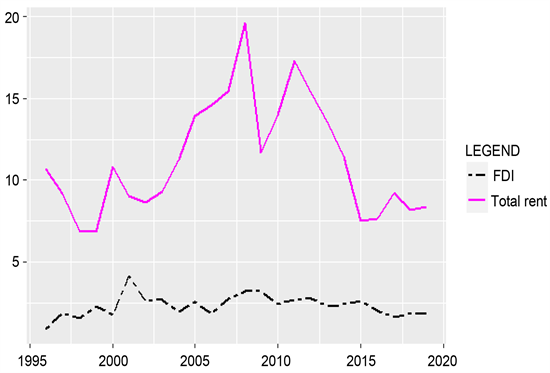
Graph 4. FDI inflows and total rents as a percentage of GDP in sub-saharan africa. Source: Authors, extracted from the world bank’s WDI (2019) database.
The two graphs show the evolution over the period under review of FDI rents and inflows in Sub-Saharan African countries. In the region as a whole, the total rent from natural resource exploitation is higher than the FDI inflows. The oil and forestry sectors are the most profitable, ranking first and second, respectively. The Central African subregion, the countries of which are mainly oil producers and have significant forest cover, especially since some of them constitute the Congo Basin, could be the origin of this dynamic. Moreover, the evolution of FDI rents and inflows can be analyzed by distinguishing three periods. The first (1996-2007) shows, with the exception of forest rent, a general upward trend in the other variables, which could be explained by the good performance of raw material prices following a relatively stable international economic situation.; the second (2007-2015) is characterized by a sharp decline in rents and FDI inflows despite the timid recovery observed between 2010 and 2014. This situation is due to the global economic recession that began in 2008 following the global financial crisis resulting from the “subprime” crisis in the United States. Indeed, this crisis has finally led to a decline in raw material prices and consequently in related rents and FDI inflows that depend on them (especially those oriented towards the extraction of raw materials). The third (2015-2019) is also marked by a downward trend in the various variables; the global economic crisis of 2014, whose effects are still perceptible, is at the origin of this period.
3.6. Descriptive Statistics
These statistics relate to the variables of interest. The data cover the period of 1996-2019 and are extracted from the World Bank (WDI) (2019) and UNCTAD (2019) databases. The results are shown in Table 4.
![]()
Table 4. Descriptive statistics in sub-saharan africa.
Source: Authors, obtained from the world bank’s WDI database (2019).
These statistics show that, during the period under review, FDI inflows received in Sub-Saharan Africa represented, on average, 4.4% of the gross domestic product of the zone, with maximum and minimum values of 161.8% and −8.7%, respectively, recorded in Central Africa, particularly in Equatorial Guinea in 1996 and the Democratic Republic of Congo in 1998. The colossal foreign direct investments in the oil sector in Equatorial Guinea and the effects of the 1997 civil war in the Democratic Republic of Congo are the main explanations. Moreover, the within- and between-group differences are on the order of 13.2% and 6% in Central Africa, 8.4% and 5% in West Africa, 4.4% and 3.7% in Southern Africa, and 1.4% and 1.1% in East Africa, respectively. With regard to oil rent, it represents, on average, 4.7% of the gross domestic product. The maximum and minimum values are 78.5% (Equatorial Guinea in 2000) and 0%, respectively, recorded in Central Africa and in Southern, West and East Africa. The differences within and between countries are 9.7% and 16.8% in Central Africa, 1.5% and 2.9% in West Africa, 0.1% in Southern Africa, and 3.2% and 3.4% in East Africa, respectively.
The mining rent represents on average 1.8% of the gross domestic product, and maximum and minimum values of approximately 46.6% (Sierra Leone in 2013) and 0% are recorded in West Africa and Central, Southern and East Africa, respectively.
The differences within and between countries are 2.18% and 2.3% in Central Africa, 4.14% and 2.8% in West Africa, 2.7% and 3.2% in Southern Africa, and 0.8% and 0.7% in East Africa, respectively.
Forest rent averages 7.05% of the gross domestic product, with maximum and minimum values of 40.4% and 0% recorded, respectively, in Central Africa (Burundi in 2003) and in West and East Africa. The differences within and between countries are, respectively, on the order of 3.6% and 7.5% in Central Africa, 2.2% and 5.3% in West Africa, 1.3% and 3.5% in Southern Africa, and 3.4% and 7.8% in East Africa.
3.7. Estimation Method
The one-step generalized method of moments (GMM) is used to analyze the effect of natural resource endowments on FDI inflows in Sub-Saharan Africa. This choice is justified by: 1) the dynamic nature of the model; 2) the non stationarity at the level of most of the variables that, moreover, maintain long-term relationships; and 3) the endogeneity (Gujarati & Porter, 2008; Asiedu, 2013), simultaneity and low exogeneity of the explanatory variables (not considering the prices of raw materials, for example, rendering the different rents weakly exogenous because they depend on them). The ordinary least squares method, for example, leads in such cases to biased estimators (Wooldridge, 2002; Flannery & Hankins, 2013). The effectiveness of the generalized method of moments is due to the use of instrumental variables. Indeed, this method generates unbiased and efficient estimators (Arellano & Bond, 1991; Blundell & Bond, 1998; Arellano, 2003).
4. Presentation and Interpretation of Results
The results of the estimates for the four subregions are presented in Table 5.
![]()
![]()
Table 5. Estimation results for the four panels.
Source: Authors, based on results obtained on Stata 15. *: significance threshold at 10%; **: significance threshold at 5%; and ***: significance threshold at 1%. The values in parentheses are Student's t values.
Overall, it appears that these results are good for the four subregions, especially since the P-value relative to Fisher’s statistic is less than 1%. Moreover, these results can be analyzed especially since Sargan’s test validates the instruments used at the 5% threshold, and the Arellano and Bond (1991) test also confirms at the 5% threshold the absence of a second-order autocorrelation of the error terms.
Thus, regarding natural resources in particular, the forest resource component has a positive but not significant effect on FDI inflows into Sub-Saharan Africa. This result is in line with those of Cleeve et al. (2015) and Bokpin, Mensah and Asamoah (2015) in Sub-Saharan Africa but contradicts that of Asiedu (2013), emphasizing the negative effect of natural resources on FDI inflows.
In Central Africa, mining and oil resources have a negative effect on FDI inflows that is significant and insignificant, respectively, at the 5% threshold. In West Africa, mining and petroleum resources also have a negative but insignificant effect on FDI inflows at the 5% threshold. These results confirm the natural resource curse emphasized in the work of Soysa and Neumayer (2007).
In Southern Africa, mining and oil resources have positive effects on FDI inflows that are nonsignificant and significant, respectively, at the 5% and 1% thresholds. In East Africa, mining and petroleum resources also have positive but not significant effects on FDI inflows. These results are in line with those obtained by Morisset (2000).
Conversely, for Sub-Saharan Africa as a whole, the 2008 financial crisis generated insignificant, negative effects in Central, Southern and East Africa and insignificant, positive effects in West Africa.
With regard to the interpretation of the results, we distinguish three major results:
➢ Natural resources, particularly forestry resources, have a beneficial but negligible effect on FDI inflows into Sub-Saharan Africa. Two arguments could explain this result: the low level of development of the forestry industry; and the constraints on foreign investors’ compliance with environmental standards. With regard to the first argument, Graph 5 shows the evolution of this industry compared to other industries in other parts of the world.
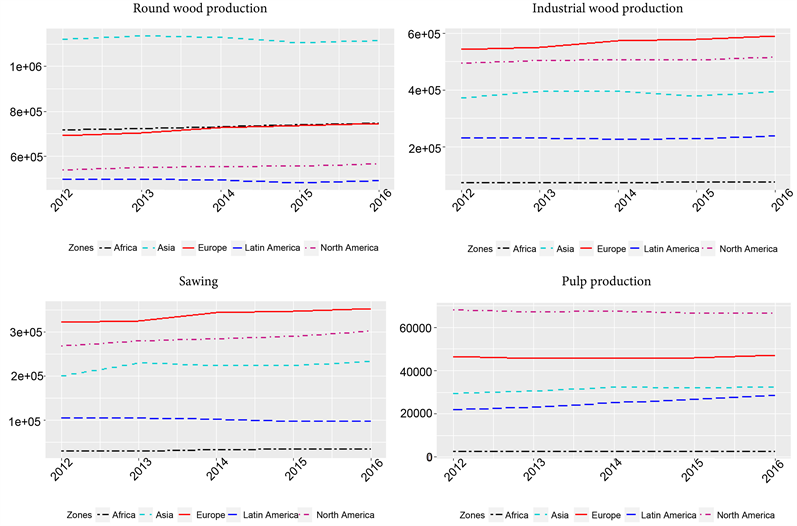
Graph 5. Evolution of forest industry production worldwide (in thousands of cubic meters). Source: Authors, extracted from state of the world’s forests data (FAO, 2017).
From 2012 to 2016, these graphs show that, in terms of roundwood production, Asia is in first place, followed in order by Africa, Europe, North and Latin America. For the production of industrial wood and sawn timber, Europe is in the lead, followed in order by North America, Asia, Latin America and Africa. For the production of pulp, North America leads, followed in order by Europe, Asia, Latin America and Africa. Thus, with the exception of wood production, for which Africa ranks second with Europe, Africa ranks last for other forest industry products, which is the consequence of the low level of development of the forestry industry in Africa. This low level limits the effects of FDI. Indeed, given its dynamic nature, the dynamism of the forestry industry has positive effects on other sectors, such as construction, which in the end is a factor in the attractiveness of FDI.
With regard to the second argument, the observation of environmental standards has led the majority of countries in Sub-Saharan Africa, particularly those in the Congo Basin, to update their forestry codes, which in one of their provisions oblige forestry operators to perform their activities in forest concessions, which more often than not are difficult for new investors to access. Additionally, operators’ compliance with 85/1533 and maintenance provisions of the concession reduce the latter’s benefits;
➢ Natural resources, particularly oil and mining, have significant and negligible adverse effects on FDI inflows to Central Africa and West Africa, respectively. Political instability, civil wars and the corruption generated by their exploitation could be causes. The following graphs of the evolution of indicators of political stability and corruption control (Kaufman et al., 2012) in the two subregions illustrate this point (Graph 6).
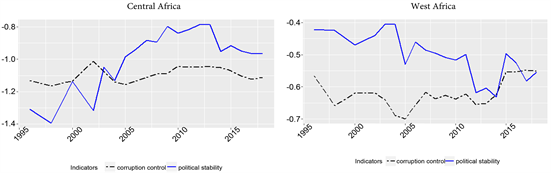
Graph 6. Evolution of average indicators of political stability and corruption control from 1996 to 2018. Source: Authors, extracted from WGI data (2019).
These graphs show that the average indicators of political stability and corruption control are not good in either subregion since their values are less than zero over the entire period. However, the situation is better in West Africa, where these values range between −0.7 and −0.4, while they vary between −1.4 and −0.9 in Central Africa. Such a context is detrimental to the business climate and macroeconomic stability of the two subregions; stability is indispensable for the attractiveness of FDI driven by vertical or horizontal strategies;
➢ Natural resources, particularly oil and mining, in contrast, have significant and negligible positive effects on FDI inflows in Southern Africa and East Africa, respectively. Relative political stability and progress in the fight against corruption in Southern Africa compared to East Africa would explain this result. The graphs below on the evolution of these indicators are instructive (Graph 7).
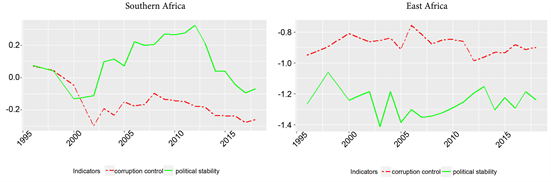
Graph 7. Evolution of average indicators of political stability and corruption control from 1996 to 2018. Source: Authors, extracted from WGI data (2019).
These graphs indicate that the values of these indicators are less than zero in East Africa, while in Southern Africa, political stability has positive values between 2003 and 2015. The exploitation of natural resources in this subregion is accompanied by political stability, which is an indispensable factor in attracting FDI. The negligible effects of FDI inflows in East Africa could be explained by the magnitude of the corruption phenomenon, especially since the values of this indicator range from −0.98 to −0.75, whereas they vary between −0.29 and 0.07 in Southern Africa.
5. Conclusion and Policy Implications
Sub-Saharan Africa has two major assets: the extreme endowment of natural resources and the importance of its human capital. However, this double advantage contrasts with the level of development of the subcontinent, which is characterized by low levels of domestic and international savings. With this fact in mind, the objective of this work was to analyze the effects of natural resource endowment on FDI inflows to Sub-Saharan African countries. Given the heterogeneity of the field of action, estimates are offered for four partially homogeneous subregions: Central Africa, West Africa, Southern Africa and East Africa. The natural resource endowments retained are oil, mining and forest resources approximated by three variables: oil rent, mining rent and forest rent. The data cover the period of 1996-2019 and are obtained from UNCTAD (2019) and World Bank databases (WDI, 2019; WGI, 2019). A dynamic model with individual effects is estimated in each subregion using the one-step generalized method of moments. The results obtained show the following:
Forest resources have a beneficial but negligible effect on FDI inflows into Sub-Saharan Africa;
Oil and mining resources have a significant and negligible adverse effect on FDI inflows in Central Africa and West Africa, respectively;
Oil and mining resources, in contrast, have significant and negligible positive effects on FDI inflows in Southern Africa and East Africa, respectively.
These results imply: 1) the development of the forestry industry in Sub-Saharan Africa; 2) the strengthening of political stability and control of corruption in Central and West Africa; and 3) the strengthening of corruption control in Southern and East Africa. The limitation of this work is methodological and relates to the method used to estimate the effects of natural resources on FDI inflows. Indeed, the one-step GMM method used does not take into account the variance of the matrix of error terms. This is not the case with the two-step GMM method, which takes this into account and improves the quality of the estimators. This limitation constitutes a further avenue of research.
NOTES
1World Investment Report 2019.
2Central Africa: Angola, Burundi, Cameroon, Central African Republic, Chad, Congo, Gabon, Equatorial Guinea, Rwanda, and Democratic Republic of Congo; West Africa: Benin, Burkina Faso, Cape Verde, Cote d'Ivoire, Gambia, Ghana, Guinea Bissau, Guinea Conakry, Liberia, Mali, Niger, Nigeria, Senegal, Sierra Leone, and Togo; Southern Africa: Botswana, Lesotho, Malawi, Mozambique, Namibia, South Africa, Zambia, and Zimbabwe; and East Africa: Ethiopia, Kenya, Sudan, Tanzania, and Uganda.
3This is a provision obliging operators, in the case of wood exploitation, to locally process at least 85% of their production and to export no more than 15%.