Intelligent Information Management in Aquaponics to Increase Mutual Benefits ()
1. Introduction
Fish rearing in aquacultures and Greenhouse cultivation of vegetables are today becoming increasingly important in human food production due to several factors. The most relevant include 1) Food price increases; 2) Reduced amount of quality water to fish and irrigation; 3) Increased use of arable land for production of raw materials for biodiesel; 4) Increased toxicity of arable land with heavy metals, excessive and or misuse of fertilizers as well as long-term contamination due to pesticides; 5) Global climate change; and 6) Overfishing. Global trends show that these conditions will continue to rise in the near future.
In a recent study [1], authors investigated the feasibility of sustaining current and increased per capita fish consumption rates in 2050 based on extensive data: predictions of changes in global and regional climate, marine ecosystem and fisheries production estimates, human population estimates, fishmeal and oil price estimations and projections of the technological development in aquaculture technology. The authors concluded that the current and larger consumption rates can be meet, despite population growth and the impacts of climate change on fish production, only if the fish resources are managed intelligently, sustainably and effectively. Therefore, the demand for producing agricultural products that are as environmentally friendly and resource-saving as they are highly efficient is increasing [2] [3]. Aquaponics technology is one of them and is defined as a food production technology that couples aquaculture (production of fish) and horticulture as hydroponics in one system [4]. Hereby, the fish and the crops can highly benefit from one another.
Our previous research to this topic in the INAPRO project described in [5] [6] [7] focused on the technological innovations such as DRAPS (ASTAF-PRO technology), filtering systems, and optimal design of the aquaponics system. The technology was implemented in several demonstration sites e.g., in Spain, China, Germany, Belgium, etc. a model-based system for control and the management of water, energy and nutrients was developed based on the Classical automation pyramid (SCADA, MES, etc.) [7]. The modeling approach allowed the optimization of all details in the design, construction, integration, and operation of the system, proving the technical and economic feasibility of INAPRO.
From this previous study, several topics which needed research were identified as intelligent information utilization to create transparency in the aquaponics processes, optimize resources usage (water, energy and fertilizer) and system performance prediction for early warning. Therefore, the enhanced version of the INAPRO Project described in this paper aims to tackle these research topics. The new concept is information-based and connects demonstration aquaponic farms of the INAPRO Project from different parts of the world and collects all data in one central database and manages the data intelligently for added value. A web-based platform for different stakeholders contains such diverse information as fish farm sensor data, environmental data, store standard operating procedures (SOPs), information on sustainability and online tracking information during delivery of fish. Data-based analysis of the aquaponics system can help to optimize workflows and increase productivity by allowing drastic reduction of water for the fish and irrigation, increased density of the products (fish and plants) per unit area, reduction in the impacts of climate change as well as allowing the application of biocontrol as an effective alternative to traditional methods of plant protection.
The project has three main objectives:
1) Collection of data on fish culture in farms, as well as supply chain and cold chain monitoring.
2) Data integration and modelling to optimize growth, farming practices and shelf life.
3) Provide data to stakeholders (farmers, maintenance companies) and consumers/end users (e.g. retailers, restaurants).
This will help achieve the following outcomes which are in alignment with the Sustainable Development Goals (SDG) 2, 11, 13, 16.
1) Improving conventional aquaponics to provide local, healthy and sustainable food.
2) Producing high-quality food while saving water, energy, and nutrients, reducing wastewater discharge and CO2 emissions.
3) Support for renewable energy equipment and heating systems.
4) Develop model-based modular and scalable regionalized aquaponic facilities.
5) Mobilize industry and stakeholders into promoting commercialization.
The overarching IT structure will not only act as a repository for data but also as computational unit. It will connect all demonstration aquaponics farms and end-users by a web interface. In this way parameters affecting growth and environment and other sensor data can be tracked and displayed online and utilized to make the prediction models robust. An additional calculation tool will even enable users to predict the shelf life of fish. In this way the project will provide more transparency on the rearing of fish and crops and environmental conditions and better ex-change of good practices among different geographical regions. This will allow customers to make a favorable buying decision.
2. Methodology
In order to be able to understand the reason of the enhancement with IoT, we will first describe the INAPRO concept, followed by the management system based on the classical automation pyramid and then the enhanced architecture.
2.1. Brief Description of the INAPRO Aquaponics
First, The EU-INAPRO aquaponics design is based on the double recirculation [5], where the Recirculation Aquaculture System (RAS) and the Greenhouse and Hydroponics systems are separated as shown in Figure 1. The main advantage of such a double recirculation aquaponic system is that optimum conditions can be set up independently in the aquaculture and in the hydroponic units. This gives the possibility to increase the productivity of both sectors without generating adverse interactions between the plants and the fish.
![]()
Figure 1. Concept of the double recirculation aquaponics system (DRAPS) (source: [5] ).
In Figure 1, the filtered, nitrate-rich fish water is transferred to the hydroponics greenhouse section and buffered by the Nutrient solution tank. In contrast to conventional aquaponics, the amount of transfer water is automatically adjusted to the plant’s actual water requirements. After adding supplementary nutrients into the fish water it is used for the irrigation of the plants. In INAPRO, two irrigation systems were tested: NFT and drip irrigation. The nutrient solution not taken up by the plants is recollected and reconditioned in a storage tank and then pumped to the plants again. Evaporated water in the greenhouse is regained via cooling traps, stored and returned into the fish tanks. This reduces the daily need for freshwater to less than three percent of the system‘s total volume. The CO2 exhaled by the fish is directed to the plants—thus increasing crop productivity. The INAPRO system solution has been integrated with cutting edge technologies for Intelligent Information Management, such as models for predictive analytics and optimization bio- and mechanical filtering, remote diagnosis and anomaly detection, and control technology, and innovative one-way water supply for horticulture.
Furthermore energy for the aquaponics system is supplied by a Hybrid Energy System (HES) previously described in [8] composed of the components illustrated in Figure 2. Under consideration is an aquaponics system that utilizes PV and micro Combined Heat and Power (μCHP) systems and is a participant of a smart grid. The electricity produced by the PV or μCHP can be used locally, stored, or exported to the grid according to the regulations of EEG [9]. The heat generated by the μCHP must be stored in the heat storage unit to be used for local heat demand. Furthermore, it is assumed that the aquaponics contains an electrical unit (auxiliary boiler) that can cover heat demand if the heat generated by the μCHP is not enough.
To be able to find an optimal strategy for the daily operation to be followed by the hybrid system, the day-ahead electricity price, the daily solar power, and the
![]()
Figure 2. Hybrid Energy system of the aquaponics.
energy demands are required and need to be forecasted. The prediction of PV energy is available through weather information.
2.2. Intelligent Information Management System
The Intelligent Information Management System for the aquaponics system is illustrated in Figure 3. It is a free structure unlike the classical automation pyramid [10] with its hierarchical structure and its fixed information flow from bottom to the top. All information will be collected in a central database as in [11]. Models will be applied and simulated data will be fed back to the IIM and displayed on stakeholder-specific websites or in a mobile app.
Aquaponics webpages and a mobile app will be targeted to different stakeholders and customer segments. The consumer can enter the tracking code, QR code or even a barcode and relevant growth data will be displayed. There will also be an app for smartphones. A fish farm owner can view online sensor data, actual and modeled growth curves and compare data with other fish farms.
The platform collects data from all system components (Fish tanks, Bio and mechanical filters, Greenhouse climate, hydroponics, Fish and plants) on size, water quality (physical—pH, total dissolved solids (TDS), turbidity, temperature, and chemical—DO, Biochemical oxygen demand (BOD), electroconductivity (EC), Ammonia, Nitrite, Nitrates, etc.), actual filter efficiencies, feeding patterns and weather conditions using mobile devices, sensors, and automated feeders. Combined with other data, the algorithms go to work to provide recommendations such as feeding management strategies and optimal harvest dates and detection of anomalies occurring in the system, amount of additional fertilizer to be added to the system, recirculation pump flow, and greenhouse environmental control. Encapsulated in the Intelligent Information Management system are besides other components, data utilization functions, e.g., for predictive analytics,
![]()
Figure 3. In-situ data from sensors will be transferred to database and compared with environmental and COPERNICUS data. Growth data and temperature and coordinates during delivery will also be added. Algorithms will then create result data to be shown for specific target groups.
system optimization, and diagnosis and anomaly detection. The two will be described in the following sections.
3. Aquaponics System Optimization
Due to the structure of the DRAPS system (double recirculation), the optimization of the RAS and the Greenhouse-Hydroponics system can be done separately (see Figure 4) to get optimal conditions for both fish and crops, provided the production cycles and quantities of the fish and plants are optimized appropriately in the design phase. To find the optimal start date for fish production, the system should be run several times with different start dates for the fish production, because the plant production cycle is very seasonal dependent.
As in [7], for the RAS and the Greenhouse Hydroponics the main objectives are to maximize fish and plant growth rate, reduce water use and water discharge for environmental protection, maximize renewable energy factor, minimize energy for heating, electricity and pumping and find the lowest operation cost and the lowest CO2 emissions.
For the RAS, the operators have the aim to maximize the revenue above the variable costs (π). Besides the direct monetary costs induced by the stock, water and electrical power use and feeding the fish, there are some costs which can incur due to suboptimal system operation, e.g., if the filters are not completely removing metabolic wastes such as ammonia which can even cause mortality to fish. We can express the decision making problem as follows
(1)
![]()
Figure 4. Optimization strategy for DRAPS. Production cycles optimized in the design phase and then RAS and Greenhouse hydroponics optimized for their specific needs.
where the yield price is expressed by
is the price of Fish ($/gram) and Q is the quantity of fish harvested (grams/liter). The variable costs
are a results of (
) in which
is total feed cost ($/liter),
is total electricity cost ($/liter), and
is total fingerling cost ($/liter). The control variables are the feed ration size R, feed to satiation F, water quality and quantity W, Stocking density S, Protein Composition of feed PC and Electricity rate E.
Further, Equation (1) is subject to the system dynamics composed of the fish growth, the bioenergetics of the fish and water quality dynamics, e.g., the unionized ammonia (UAN) and dissolved oxygen feedbacks. To be able to fully utilize the available information and data, unlike in [7], where we used mathematical models, the prediction models for the system dynamics used in the optimization framework are based on machine learning methods, to be specific, on the Long Short Term Memory neural Network (LSTM).
For the Greenhouse hydroponics is as in the RAS to maximize the yield (Profit). Optimized control of the climate conditions, e.g., light intensity is very significant for obtaining good yield and quality for greenhouse products. This can be expressed as in Equation (2).
(2)
where
is the fuel consumption of the heating system,
electricity energy consumed by the heating and the lighting system,
is the supplied water,
are the supplied fertilizers and
,
,
,
and
are the fuel, electricity, water and fertilizer and Carbon dioxides prices, respectively.
The above objectives are subject to constraints such as the dynamics of the system such as the heat and water balances, nutrient dynamics, hardware, weather and climate conditions, in/out feed tariffs and the legislation on feeding power into the grid.
The calculated optimal values for energy demands (heating, electricity (mainly for lighting and driving the system components), and pumping) are fed into the Energy Management System (EMS) to optimize the hybrid energy system (see Figure 2).
4. Monitoring, Diagnosis and Anomaly Detection
One of the reasons for developing an IIM system is system monitoring and timely anomaly identification. Hier all the information available is used to obtain the system status. Due to the fact that aquaponics system processes are quite complex and usually staff at the farms lack professional knowledge, a monitoring, diagnosis and remote service assistance system as illustrated in Figure 5 is required. In the DRAPS system, data is monitored at different locations to maintain proper water chemistry and physics. Obviously, in an IoT-based aquaponics, faults can occur anywhere along the line from the facility itself, software up to the communication system, but here we are just looking at faults at the facility. The system takes sensors, actuators, fish and plant growth information and their tolerance bands and calculates remotely the system status and recommendations for action. Instead of a human measuring the fish or plant growth up and again photos from IoT-Cameras in combination with deep learning estimators are used to estimate remotely the fish and plant growth in real-time.
The core of the system is a Long-Short-Term Memory (LSTM) neural network [12] for anomaly detection and symptom generation and a Bayesian Network (BN) for fault localization [13]. The LSTM can predict future time point
![]()
Figure 5. A monitoring, diagnosis and remote service assistance system.
values based on the past observations. It is a zero-positive machine learning system [14] [15]. Therefore, it is trained on values from normal operation regime (does not require anomalous training samples). This is of practical significance, because anomalous samples are difficult to collect and varying. For the training, the dataset from the normal regime is divided into three portions. The LSTM is trained on the first dataset to get a model M, following this, the model M is used to the second portion of the dataset error vectors are computed and fit into a multi-variate normal distribution N. Further the Model M is applied to make predictions and compute error vectors for the third portion of the dataset. Then Mahalanobis distances are calculated and fit into a truncated normal distribution T. Finally, the inverse cumulative distribution function of T at a user-specified percentile is evaluated to be used as the anomaly detection threshold τ. For the inference, the system is applied to a New Dataset to make predictions. Error vectors and M-distances between these error vectors and the center of N are computed and finally the time-series values whose M-distances exceed the threshold τ are considered as anomalies.
For training the BN requires expert knowledge and historical data of symptoms and faults relationships. For inference, it takes the values calculated by the LSTM model as symptoms. The recommendations for action are sorted automatically according to the importance of the parameters and reaction times required by the failures. In aquaponics, issues with water, electrical power, dissolved oxygen i.e., aeration system and oxygen system requires very fast response in minutes. Moderate response time-hours are required by issues of temperature, carbon dioxide, pH, alkalinity, ammonia-nitrogen nitrite-nitrogen, nitrate-nitrogen, because they are normally slow changing.
As Illustrated in Figure 3, all the information calculated by the models is fed back into the IIM system for general use.
5. Results
An IIM system for an integrated RAS and hydroponics system model was constructed successfully. Sample results of selected features of the developed system will be presented and discussed in the following. This will include the results of the system optimization, the monitoring and anomaly detection and the overall benefits of the IIM system.
5.1. Results of Databased System Optimization
5.1.1. Optimal Fish and Plant Growth
Two example results of the optimization system will be shown to illustrate the capability of the system to predict for long and short-terms as required by different services, e.g. the planning department is more interested in the end outcome and the operational department would like to know the short-term operational controls. The optimization of the RAS will be used to illustrate the long-term and the optimization of the Greenhouse hydroponics system the short-term.
For the RAS, the fish growth optimization problem was setup as an optimal control problem with free final time. Therefore, the final growth state was set to 700 g of weight. The other parameters such as the filter efficiencies for removing metabolic waste in the system were set to 0.95 for the biological filter and 0.5 for the mechanical filter. These filter parameters were obtained through experiments. It was found out that when the real aquaponics system had stabilized, the efficiency of the biological filter and the mechanical filter where only 0.95 and 0.5, respectively. The results can be seen in Figure 6. It can be seen that the fish growth continually upto the final state of 0.7 kg with some reactions to the change in temperature. Correspondingly the objective function also increases in the same manner. The requirement of fresh water and the key metabolic waste values are also shown. The value of the unionized ammonia which is very dangerous to the fish was kept under its maximum. The values in the second figure are normalized.
The control variables ration size R and protein content D can be seen in the lower part of Figure 6. It can be seen that the ration size R was always kept as high as possible at 0.8 and the protein content D at 0.3 and then went down for the older fish. It could be deducted that the limiting factor for the whole system was the unionized ammonia. Unionized ammonia is introduced into the system by the protein content, so the there are two ways of controlling this, one is to supply more fresh water and the other one is to reduce the amount of protein in the feed. It can be seen that in this case the optimization algorithm could solve this problem by just setting the protein values as low as possible according to the fish growth stage. This saves money for the feed which is lower and also fresh
![]()
Figure 6. Optimal fish growth in RAS (top), water conditions (middle), controls variables (bottom).
water is not required which saves more money.
The predictive control shows good results as expected (Figure 7). The prediction horizon was set to 21 days which is considered short-term. Similar behaviour for all days can be observed. To maintain the minimum required greenhouse inside temperature, heating is switched on during the night just enough so that it is just above the required temperature. The heating is not higher than is necessary to keep this temperature. It can also be seen that the CO2 production is on during the day to increase the CO2 concentration which is require for photosynthesis. As expected, the CO2 production is shut down if the ventilation is on, because the increase in yield does not cover the cost to maintain a higher CO2 concentration with ventilation on. When the outside temperature makes the inside temperature rise to high, the ventilation is automatically opened.
Beside the optimization for the fish and plant growth, some econometric, environmental optimization for the complete system in terms of renewable energy, waste water discharge, fresh water use and supplementary fertilizer use was also performed and some of the results will be shown and discussed in the following.
5.1.2. Optimal Water and Fertilizer Use
Using models, the optimal water exchange flowrate between RAS and hydroponics area was determined. At the demo site, it was found through optimization that the sedimentation tank should be emptied once a week to supply water to the hydroponic area. This interval was sufficient to keep nutrient concentrations in the RAS safe for optimal fish growth and was enough to supply all NFT channels with enough water to cultivate tomato with optimal fruit yield. In the optimized aquaponics system no water discharge is required, no nutrients from the RAS are wasted. Furthermore, the system can predict an ideal fertilizer regime for optimal plant growth based on shortage in nutrient from RAS saving fertilizer costs and increasing yield.
In Figure 8 the results of an aquaponics system with 40 m3 fish tanks coupled with a 1000 m2 hydroponics system which can produce five tons of Tilapia and 75 tons of tomato yearly is given. In the top of the Figure, one can see that in the summer months, the RAS produces more than enough water for the hydroponics system. However, about 530 m3 of fish water per year is in excess and need to be discarded, otherwise if recirculated, it will cause the fish to die due to intoxication by the metabolic waste such as ammonia and nitrates. This is because in the winter months, the crops are too small and their demand for nutrients is low. Therefore, all the nutrients produced by the RAS cannot be utilized by the crops, here in our case tomatoes.
In the lower part of Figure 8, the nutrients balance (nutrients produced by the RAS, the nutrients uptaken by the tomatos, and the deficiency, i.e., the nutrients required in fertilizer form) is shown. Here, it is obvious that the crops requires much more nutrients than the amount produced by the RAS. Therefore, additional fertilizer for the crops is required, which amounts to about 171 kgN
![]()
Figure 7. Sample results of optimization of the greenhouse climate under real world weather conditions over 7 consecutive days.
![]()
Figure 8. Water and nutrient balance of the aquaponics and their utilization by the crops.
fertilizer per year. This irregular distribution in the summer and winter months makes us conclude that only 26% of the required nitrates can be really utilized due to the nutrient water discharge, even though the RAS can theoretically supply up to 56% of the required nitrates by the crops.
5.1.3. Optimal Energy Allocation and Utilization
The optimization of the Hybrid Energy system used several datasources, such as meteorological data, energy data demanded by the aquaponics system such as for heating, cooling, lighting, pumping, etc. The results of the optimization are shown in Figure 9 and Figure 10. It can be seen in Figure 9 that all demand requirements of all forms (heating, pumping, electricity) are met considering the availability of the resources and according to the given priorities of utilization of different energy sources. The figure also shows the contributors at the instance in time. Heat energy is mainly is satisfied by the by the biomass plant and the FPC in the hours from 8 to 16.
In Figure 10(a), the energy production rates of the different sources are shown. It can be seen that the energy produced by the wind turbine fluctuates a lot and that the energy suppliers based on the solar radiation (PV and FPC) have their maximum production capacity of at midday and zero at night. Small hydropower and biomass have constant production rate as they are driven by steady water flow and a constant supply of heating material was assumed, respectively. Figure 10(b) shows that the excess electrical energy mainly produced
![]()
Figure 9. Energy demand and supply contributions of different sources.
![]()
Figure 10. (a) Energy production by different sources and (b) Electrical energy allocation to/from Battery/Grid.
by wind is transferred to the power grid throughout the day. The battery start in an empty state and the excess energy from the HES is stored gradually. On the other hand little energy is taken from the power grid.
5.2. Results of Monitoring and Anomaly Detection
The monitoring and anomaly detection system constantly collects data of the whole system and compares it with the expected values form the tolerance bands of the sensors and the predicted growth by the models. As an overview, an extraction of the system status produced by the monitoring system is shown below:
Following the procedure described in Section 2.1, we prepared three datasets from the 2 years data in the ratio of 50% dataset 1 to train the LSTM to get a model M, 30% dataset 2 used to compute error vectors with model M and fit into a multi-variate normal distribution N, and 20% dataset 3 where the model M is applied for testing the predictions. For the LSTM model, the input dimensions were determined by the sum of the number of sensors, the number of No. of actuators and the growth prediction model outputs and for the structure, a dropout layer with dropout rate of 0.2, a hidden layer with 100 neurons, another dropout layer of rate 0.6, a dense layer and relu) was defined. The key hyperparameters (batch size = 1, learning rate = 0.7 and number of epochs = 50) were tuned using Bayesian optimization [16] while checking the performance of the system.
The results are shown in Table 1 and Figure 10. For example, for the dissolved oxygen, the network achieved a training MAE of 0.006 and a test MAE of 0.002. For all the sensors and actuators, the LSTM model had an average recall rate of 0.87, precision rate of 0.533 and Fβ-score of 0.0825.
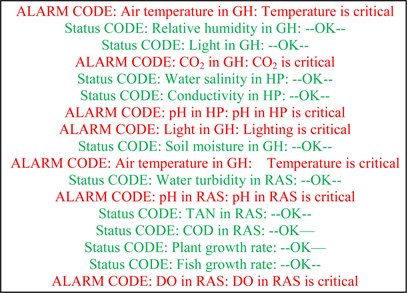
Figure 11 shows exemplary the results for the water quality (nitrate and ammonia), plant and fish growth, respectively. With the system, alarms and recommendations for corrective measures are triggered as can be seen in the Figures 11(a)-(d). For example, in Figure 11(a), anomaly was detected and confirmed in ammonia concentration. The system suggested through the Bayesian fault localization system that either the oxygen sensor or the directly the ammonia sensor was faulty. Due to the shift in the values, the system further suggesteda recalibration of the sensors with the first option ammonia sensor and an SMS
![]()
Table 1. Results of the anomaly detection system compared to a Bayesian detector.
![]()
Figure 11. (a) Anomaly detected for ammonia, (b) Plant growth rate deteriorating alarm at 70th day (c) Nitrate issue occur after 320 days, (d) retardation in fish growth registered and corrected.
was sent to the operator console.
In Figure 11(c), the system detected some limiting factors issues, in this case a controller outage for the nitrates was found as the fault by the Bayesian fault localization system and a message “Nitrate critical alert, possible cause controller defect” was sent.
For the long-term development of the aquaponics products (fish and tomatoes), the system collects actual data from the sensors and predict the future growth rate using the fish and tomato growth models. In Figure 11(b), after 65 days, the tomato growth rate was predicted to be stagnating. Therefore, it was recommended to add extra fertilizer to the system to increase the electroconductivity (EC) and in Figure 11(d), the fish growth rate was predicted to be slower than expected. Several possible causes for the deterioration were identified to be the feed rate (first option) and too high Biochemical Oxygen (BOD) (second option). It can be seen that increasing the ration size solved the problem after a while.
5.3. Intelligent Manufacturing Execution System (MES)
The IoT enhanced Manufacturing Execution System (MES) is based on the IIM system and is the front end of the system. It has several views for visualizing different functions customized for different stakeholders, listed in Figure 3. One important feature of the INAPRO aquaponics system is to minimize fresh water less than 3%, energy and nutrient supplies [5]. This can only be achieved by appropriate design of the fish and crop mixture, considering the fish to crop ratio, when to sow the crops etc. and to monitor the system to see whether or not, it performing as designed. Therefore, the MES has a view to show the system with all the material flow (water, energy and nutrients) and also how the system will be performing for a given prediction horizon. The main view of the MES is shown in Figure 12. It shows the economics (current harvest, losses, production costs, current sale prices of the products, actual feeding costs etc.) and the consumption rate of the resources. Knowing the future developments of the system, the operator can take corrective measures to make sure that the system is behaving as required. The MES is responsible for
1) Cost and yield monitoring, product tracking on a user-friendly dashboard.
2) Enables production without human intervention and maintain accountable and controlled production flow.
3) Visualizing quality, costs (energy, food, water, heating, etc.) and productivity in comparison to market prices.
4) Assists users in feed and nutrient calculation and other planning issues and
5) Log farm activities, e.g. Log health & safety activities, Fish feeding traceability and Plants harvest traceability.
6. Key Benefits of the Intelligent Management System
FigureThe modularity, scalability and viability of the of the INAPRO system has been proven in many demonstration sites, e.g., in Germany with 573 m2 greenhouse produces 24 tonnes of African catfish and 11 tonnes of tomatoes and another large scale site in China of 2100 m2 of greenhouse produces 30 tonnes of fish and 360 tonnes of vegetables. All the sites have been running at <3% freshwater input. The resulting benefits of the system are
1) Improved productivity. DRAPS provides optimized conditions for both fish and plants.
2) Costs and resources savings. Efficient double use of water and energy, model-based optimization, reducing sewage and the amount of fertilizer used. The reduction of fish water emission saves costs for freshwater and wastewater treatment and protects the environment and regaining evaporated water.
3) Reduction of freshwater consumption. Compared to conventional (RAS) which requires a daily water input representing 10% of the total amount of water circulating [4] [6], INAPRO cuts this rate to 1% - 3%. The freshwater demand is minimized by a secondary clarification step in the RAS circuit and using evaporated water from the plant section which is regained via cooling traps.
4) Automated system management. Production conditions are adjusted automatically model-based on the analysis of different sensors and historical data
5) Competitive advantages. High-value products for consumers who are concerned about the environmental impact. Transparency through product tracing, achieving higher retail prices.
7. Conclusion
An information management system for aquaponics has been presented. The aquaponics system is based on the double recirculation technology, which enables the set-up of optimal conditions for both fish and plants. Fish and plant health and welfare are ensured with the help of smart sensors monitoring water quality and biological parameters of the fish and plants in the fish tanks, before and after the filters, fertilizer requirements and intelligent information management (e.g., remote monitoring diagnosis and anomaly detection based on collected data, predictive analytics and system optimization for minimizing use of resources and maximizing yield). Cameras are installed to measure fish and plant growth. It is implemented according to the Aquaculture industry 4.0 and its management system does not follow the outdated classical automation pyramid with its bottom-up, layer to layer structure. It looks at the digitalization of the whole value chain from production to customers. This will enable full traceability and transparency in the processes, increasing consumers’ trust in aquaponics products. The sustainability and efficiency use of natural resources will benefit from the implementation of digital technologies and data management in real-time monitoring of water and aquaponics farm conditions.
Acknowledgements
The INAPRO project has received funding from the EU’s ENV.2013.WATER INNO&DEMO-1 under the grant agreement ID: 619137. Thanks to the consortium of the INAPRO project and the colleagues at Fraunhofer IOSB for their support.