The Role of Enthalpy of Reaction in the Process of Global Warming: What Can We Learn from Basic Thermodynamics* ()
1. Introduction
Over the past 200 years, a rise in our environmental temperature has been observed. Therefore, statements about changes in our environmental temperature are currently present in all media. This is due to the fact that there is a widespread feeling that behaviors have been established in our world that calls into question the continued existence of Planet Earth in its entirety. A detailed study of this problem is justified and necessary, but it is also extremely diverse and requires the interaction of different scientific fields and corresponding expertise in order to understand it. The data primarily used for this purpose come from measurements of the proportions of various gases in ice cores [1] or from the determination of the isotope ratio 18O/16O in the deep sea [2]. They try to draw conclusions about situations on our planet that are up to millions of years in the past. Especially the climatic conditions of that time are in focus. The currently most widespread opinion in this context attributes a decisive role to the so-called greenhouse gases, especially the CO2, part of the atmosphere [3] [4] [5] [6]. The knowledge gained from the retrospective view of the past earth age of up to several million years is applied to today’s development of the environmental temperature. In this context, it should be taken into account that 200 a, for example, compared to 1 Ma, is a very small fraction which is difficult to realize when the measurement results are resolved. Furthermore, CO2 is dissolved in the ocean water in addition to its presence in the atmosphere and is bound in many minerals and in all organic life forms. There are interrelationships between all these CO2 deposits. It is therefore not surprising that there are open questions in this respect. For example, values between 200 and 300 ppm have been measured for the CO2 content of the ambient air in the last 800,000 a and changes in ambient temperature of about 5˚C have been reported for the same period, e.g. [2]. Since the CO2 content of the atmosphere has increased by 100 ppm in the last 200 a, one should expect that the average temperature of 1800 to 2000 also increases by 5˚C.
For the last 550 Ma the CO2 portion in the atmosphere has been given approximately [7]. It can be seen that, for example, during the Saharan Ice Age (before 420 - 450 Ma) [8] the CO2 content was around twelve times higher than 300 ppm and that it has fallen continuously from five times the value before 200 Ma to 300 ppm. Several ice ages are also indicated in this period. The relation of the CO2 content to the prevailing climate therefore requires further explanation. The climatic changes that have taken place on our planet concern large periods of time of at least some 105 a. The recent increase of the CO2 portion in the atmosphere amounts however only 200 a. It therefore seems reasonable to distinguish between this increase and climate changes. In the following article we will try to realistically assess the role of CO2 in this context. It is not necessary to refer to past periods of the earth’s history, but three generally accepted data sets from the recent past are used, which are considered to be relatively certain. The significance of chemical reactions and the associated energy conversions, enthalpies of reaction, and the position of carbon dioxide in our environment are studied through thermodynamic considerations. In this context, the role of so-called renewable energies in our environment is also critically examined. It is shown that the problem of a global warming of our environment must be seen even more critically than is generally assumed.
2. The Carbon Dioxide Problem
As already mentioned, the carbon dioxide content in the atmosphere, xCO2, has not exceeded a value of approx. 300 ppm for 800,000 years. However, it has risen sharply in the last 200 years. The Mauna Loa Observatory measured 406 ppm in February 2017 [9]. The situation is shown graphically in Figure 1 for the last 2000 years to the present (black curve).
Numerical values for the carbon dioxide portion in the air are represented by crosses. For the period from 1010 to 1978, data are available for an adjustment curve to the results of carbon dioxide share determinations in the atmosphere by the analysis of ice cores [10] (blue crosses in Figure 1). Since in the first years (0 to approx. 1800) hardly a change of the carbon dioxide portion in the air is to be noticed, for the beginning of the curve the same value as with 1010 years, was used (black cross in Figure 1). The data were further supplemented by seven values from the Keeling curve (1982-2018) (red crosses in Figure 1). Figure 1 also shows the development of the world population, zW, since the birth of Christ (magenta curve) [11]. A certain similarity of the curve can be seen. The correlation coefficient, R, between both curves is R= 0.9707 and confirms a correlation between CO2 content in the atmosphere and world population. All calculations listed here were performed with the software Mathematica [12].
For the time of the strong changes of the carbon dioxide portion in the air beginning with the year 1800 up to today one observes even a strengthened correlation to the population development. As a result, an almost perfect correlation is obtained between carbon dioxide content in the air and the increase in the world population, characterized by a correlation coefficient of R = 0.9946.
For the period from 1800 to 2020 there is a linear relationship between,
, and, zW (
, R2 = 0.9999).
Measurements of global air temperature show that it has actually risen since 1850 [13]. Figure 2 therefore shows the correlation between the increase in ambient temperature and the increase in CO2 concentration for the years 1850 - 2017. The correlation coefficient is R = 0.91005.
The functional relationship between temperature, T, and
can also be approximated by a straight line (
, R2 = 0.999923). Apparently there is a contradiction between the statements that the CO2 concentration 800,000 years had no influence on drastic climate changes, while in the last 200 years there seems to be an influence. The following considerations are intended to clarify this issue.
![]()
Figure 1. Development of the proportion of CO2 in the air and in the world population over the last 2000 years.
![]()
Figure 2. Temperature change as a function of the CO2 content in the air for the last approx. 150 years.
3. The Chemical Reaction
At this point the presentation of chemical reactions is reminded. As an example we use the combustion of methane.
,
This example shows that combustion reactions of organic material are connected with CO2 production. Under standard conditions, an enthalpy of reaction (reaction heat) of
is released during this reaction. This amount of heat is available to heat the environment. Table 1 shows the standard molar enthalpies of combustion for various substances as well as the amounts of heat produced by the corresponding chemical reactions per mole of carbon dioxide formed, DCHM. Hexane can be considered as a substitute for petrol and decane for diesel.
![]()
Table 1. Standard molar enthalpies of combustion, ΔCH∅, and enthalpy formed per mole of carbon dioxide ΔCHM for various substances.
It can be seen that the amount of heat available for the heating process per mole of carbon dioxide formed varies greatly. Therefore, the conclusion that the same amount of carbon dioxide also makes the same contribution to heating the environment is wrong. Rather, it must be stated that every exothermic process contributes to increasing the environmental temperature. The representation of
in the atmosphere as a function of time proves that climate changes in the past took place at almost constant
, and ice ages at a very high
. The CO2 cannot be responsible for these. In the last 200 years, however, a strong increase in the CO2 content in the atmosphere has been observed, which is also associated with an increase in temperature in the atmosphere. Since all vital processes are associated with the combustion of organic matter, the steep increase in the CO2 content of the atmosphere and thus the warming of the earth’s atmosphere is due to the increasing energy consumption of mankind.
If the warming of the atmosphere in the recent past is accepted as a real experimental finding, two aspects can be considered, both of which are based on the fact that an increase in temperature is due to exothermic processes. These aspects are (a) the nature of the heating process and (b) the speed at which it takes place.
To (a): Any process that releases heat causes an increase in temperature in its environment. In addition to combustion processes that produce carbon dioxide, the following must also be taken into account e.g. the combustion of hydrogen, heating with electric current or the generation of frictional heat. There is therefore no point in using electricity, which is supposedly derived from renewable energy sources, in processes that generate heat. Therefore, carbon dioxide, as a product of many chemical reactions, plays a significant role in heating the environment. The decisive factor here is the amount of heat produced per molecule of carbon dioxide during a combustion process (Kirchhoff’s law).
To (b): Since we are dealing with a non-equilibrium process when heating the environment, which is characterized by the heat transport, the speed of the heat supply (development) and release must play a decisive role. From the curve of the temporal course of the carbon dioxide content in the atmosphere, see Figure 1 (Hockey bat curve), it can be seen that the increase (speed of increase) has greatly increased since about 1800. Figure 3 shows the measured temperatures, T, (in ˚C) as a function of time, t, (in 10−3 years, zero = Christ’s birth) for the years 1850 to 2017 [13].
The correlation coefficient between the two quantities is R = 0.830335. It therefore suggests that different influences must be considered for the temperature change in the last approx. 150 years.
The temperature curve can be modelled with the following equation (black curve in Figure 3, R2 = 0.99992)
(1)
The speed of the temperature rise with the time vT = dT/dt is therefore given as
(2)
The measured values therefore indicate that the warming of the atmosphere will be accelerated in the coming years.
The relationship between the increase in ambient temperature and the concentration of carbon dioxide in the environment and in the world population is clear from the previous observations. This illustration illustrates, representative of all exothermic processes in our environment, that compared to earlier times, energy consumption and the associated carbon dioxide emission rate have increased enormously in recent times. An influence on the earth’s surface temperature is therefore not unexpected. Combustion processes, however, are only a part of all heat-generating processes, as we have seen.
Our observations so far have shown that the enthalpies of reaction coupled with the life processes and the speed of their generation are responsible for temperature changes in the atmosphere and not the CO2 molecule itself. Since the connection between the rise in the ambient temperature and the likewise increased
![]()
Figure 3. Temporal temperature curve in the years from 1850 to 2017.
CO2 content in the ambient air seems to exist, it must also be explainable. The essential aspect becomes clear by the following qualitative consideration.
4. Qualitative Considerations to Compare the Energy Contributions to Global Warming in Three Different Years (1800, 2014, 20XY)
In the following considerations we replace the role of carbon dioxide by the term fossil fuels. The replacement of fossil fuels by renewable energies is seen as a contribution to reducing global warming. The aim of these qualitative considerations is to show that replacing fossil fuels with so-called renewable energies does not automatically lead to a reduction in the temperature increase of our environment. The conditions are shown in the simplified energy scheme (Scheme 1) for the years considered as examples (1800, 2014, 20XY). The year 1800 is used as comparison year (blank value), since it was shown that the temperature increase of the atmosphere caused by mankind and its strongly increased energy consumption becomes noticeable from this time on.
The different contributions to the energy balance are marked solar energy ,
or ES, (yellow colour), reflected share of solar energy
and ER, without influence on global warming, (gray colour), all forms of energy which increase the global temperature through natural processes, EN, (blue colour), all forms of energy leading to the rise in global temperature through human activity, EM, (red colour), contributions of the greenhouse effect to global warming, ET, (green colour), contribution of fossil fuels to the rise in global temperature,
and EF, (brown colour). The energetic situation of the years 1800 and 2014 is shown in more detail in Scheme 2.
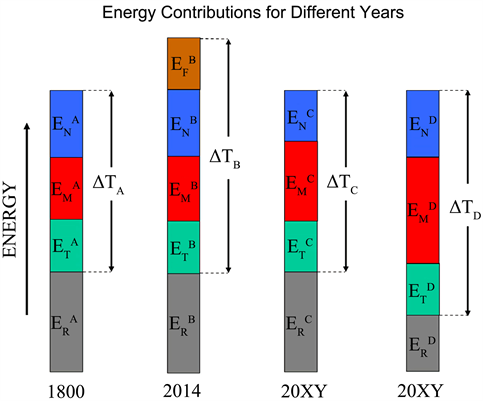
Scheme 1. Symbolic representation of the total energy balance of the earth in the years 1800, 2014, 20XY.
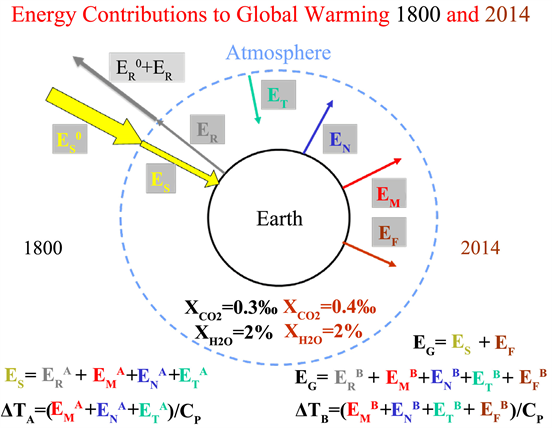
Scheme 2. Energy contributions to global warming for 1800 and 2014.
Here arrows in the appropriate colours have been used to indicate the different energy contributions. It must be remembered that, for reasons of energy conservation, the energy used by mankind comes from two main sources. One source is the direct use of solar energy and the other is the use of fossil fuels. There are some other energy sources that can be included in these two categories, such as water energy, which is a consequence of solar energy due to evaporation and condensation. Other energy sources such as tides or volcanism cannot be influenced by humanity and exists independently of humanity. But they can be used like the tides. Their contribution to the overall energy balance can be considered as included in EN and EM.
Further considerations are based on the following points:
1) It is assumed that the solar energy ES, which affects the Earth in the years under consideration (1800, 2014, 20XY) is the same. In 1800:
. Associated with this is a temperature increase in the atmosphere ΔTA,
(Kirchhoff’s law). CP is the heat capacity of the system (atmosphere).
2) In 2014, the contribution to total energy, EG, caused by the use of fossil fuels,
, is taken into account (
). We will neglect in the following considerations that part of the fossil energy which is emitted into space and therefore does not contribute to the warming of the atmosphere. The following applies:
. It is irrelevant for the considerations if one assumes that the following applies:
,
,
. The additional energy consumption caused by mankind which contributes to the temperature change is completely in
. If we simply assume that the greenhouse effect is caused by water vapor and carbon dioxide, we find that it was caused in 1800 by 2% H2O (14˚C) und 0.3‰ CO2. In 2014 it will be 2% H2O and 0.4‰ CO2. Assuming that the contribution of both gases to global warming is proportional to their concentration, with the same proportionality factor P (P= 1), the difference in energy contributions
. Additionally, water vapor is much more effective than CO2. The maximum absorption coefficient for water vapor is 700 times higher than for carbon dioxide (
(
),
(
)) [14]. Therefore, the approximation
is also justified.
Decisive for the increased temperature rise, ΔTB, in the atmosphere is the additional energy input through the use of fossil fuels. The approach of using as few fossil fuels as possible is therefore correct. Whether or not it reduces the temperature rise in the atmosphere is not mandatory, as the following considerations for the year 20XY show.
3) In the cases C and D for the year 20XY shown in Scheme 1, there is no use of fossil energy sources,
. However, the energy consumption of mankind was the same as in 2014 or even slightly increased. This energy and its corresponding share, EU, which contributes to the warming of the atmosphere (
). It must be provided from other sources. There are two possibilities shown in Scheme 1. In case C, EU is achieved by a reduction of EN (
). This means a reduction of the blue arrow in Scheme 2. Because of
,
, and
, und
continue to apply. We receive in case C:
case C:
(without influence on global temperature)
.
The additional consumption of EU energy does not cause an increase in temperature compared to 1800. The use of renewable energy is therefore successful in terms of avoiding a global rise in temperature.
In case D for the year 20XY, the energy EU is taken from the reflected energy, ER, shortening the gray arrow (
).
case D:
.
In case D, despite the abandonment of fossil fuels, the ambient temperature has risen, and replacing fossil fuels with solar energy has not prevented global warming. The simultaneous occurrence of both cases C and D is of course also possible.
Since the cases C and D discussed are the interplay of many natural processes, it is very difficult to decide which case is appropriate in a concrete situation. An accurate and comprehensive analysis, based on many different data, is required. It goes beyond the scope of these considerations. The following consideration can possibly be regarded as a suggestion.
A part of our environment should be used for the production of renewable energy, e.g. an area for the production of solar energy or an area with air pressure differences for the production of wind energy. Without the energy production the area changes after a certain time into a relatively stable state with the energy E0 at the temperature T0. If energy is taken from the system for use, a state with the energy E1 at T1 occurs. Since energy was taken from the system,E0 > E1 and T0 > T1 apply. If T1 is now above the mean temperature Tm (T1 > Tm) measured in this area, the energy emitted into space by radiation is reduced by the production of renewable energy. The unfavorable case D in Scheme 1 is present. The opposite is the case in T1 < Tm. In this case, the affected area can even absorb energy from other areas to reach the mean temperature. The favorable case C in Scheme 1 is present.
In 2014, human energy consumption was 505 EJ. This energy is sufficient to heat the earth’s atmosphere (14˚C) up to a height of 1 km by 0.8˚C. The energy is used for the heating of the earth’s atmosphere. This example underlines that the energy consumption of mankind is responsible for the rise in ambient temperature. Combustion processes that produce CO2 are responsible for a considerable portion of the increase in temperature, but they do not make a significant difference to an electric heating system that emits the same amount of heat to the environment.
For example, the amount given for energy consumption does not take into account the temperature increase caused by the heat flow from living organisms (body temperature 37˚C) to the ambient temperature (14˚C). The amount of energy emitted by a human being per day is approx. 2500 kcal. With a world population of 6.5 billion people, 25 EJ per year therefore accumulate. One sees that also this amount with 5% of the above-mentioned energy consumption of mankind is not insignificant. However, a part of this amount as well as the part that other living beings contribute is included in the above energy consideration in the size EM for the year 1800.
If, for example, one wants to avoid a 2˚C increase in the environmental temperature over a period of 30 years, one can by no means ignore the fact that human activities can cause an annual temperature increase of almost one degree. Until about the year 1800, energy sources not influenced by human activity and, to a lesser extent, human activities generated an average temperature of about 14˚C. Due to the industrial revolution the energy consumption by mankind has increased considerably. Decisive for the calculation of the temperature increase caused by the energy consumed by mankind is its amount and the speed of the energy input. Regarding the origin of energy, two cases must be distinguished. Firstly, does man use for his purposes only those forms of energy which occur anyway in the dynamic equilibrium of energy, i.e. produce the average temperature around 1800 of 14˚C, or secondly, are additional sources of energy used or is the rate of input of a form of energy changed. In the first case, the actions of mankind would only have a very small influence on the temperature of the environment. In the second case the influence is considerable. The use of fossil fuels belongs without doubt to the second category. For the use of so-called renewable energy sources, the answer seems at first glance to be the first category (all forms of energy will end up as heat). However, a closer look is necessary.
If the energy comes from the amount of energy that the average temperature of the environment produces, it can even lead to a short-term reduction in temperature. Since the energy balance of the environment is a dynamic equilibrium determined by the supply, removal and in our case human use of the energy, the speed of the different currents, which is caused by potential differences, must also be taken into account in addition to energy conservation. Each energy source must be carefully studied in terms of its influence on the ambient temperature. In principle, it must be noted that this energy may have contributed to the dynamic equilibrium in the environment before it was used. A time delay occurs due to its use in the renewable energy system (it only becomes effective at a later point in time). During this period, however, the environment may return to the value of dynamic equilibrium by absorbing additional radiant energy or by reducing radiation. The speeds of radiation and radiation in comparison to the delay period are therefore decisive.
- The natural isotope decay contributes to the dynamic equilibrium. Nevertheless, nuclear power must be assigned to the second category, since the nuclear reaction in the reactor is accelerated.
- Photovoltaic plants also belong to the second category. At rest, the plant has the ambient temperature in dynamic equilibrium. When it is in operation, it extracts additional energy from sunlight which previously did not contribute to the temperature in dynamic equilibrium, i.e. was radiated. However, when the additional energy is used, heat is generated which contributes to the temperature increase. (It would also be conceivable but not very likely (temperature equilibrium) that the photovoltaic system would cool down its surroundings).
- To operate a wind turbine, a region that was in dynamic equilibrium (p, T is the same everywhere) must be brought into a state in which it breaks down into two subregions that differ in pressure. Such a transition cannot happen by itself. It must be caused by an additional energy source (initiation) which has a potential difference to the system under consideration so that an energy production can take place (application). A simplified thermodynamic analysis of the problem is shown in Figure 4.
The internal energy of the gas in the states S (start) and E (equilibrium) is equal (2nd Gay-Lussac’s law). Among an infinite number of possibilities, three ways for the transition between S and E are depicted (1 = red, 2 = blue, R = black, reversible). They can be used in both directions, S to E and reverse, and calculated simply, wi = −pidVi, qi = CidTi (Ci = heat capacity). Two cycles for work production are discussed as an example, α) initiation: E → B → S, application: S →
![]()
Figure 4. Pressure (p), molar volume (V) diagram of an ideal Gas. (A, B = transition states, Ti = temperature, ui = internal energy, wi = work, qi = heat).
A → E and β) initiation: E → A → S, application: S → B → E). The resulting heat for both circular processes, Δqi, is
. (3)
Depending on the cycle chosen, as well an addition of heat or a depletion of heat in the system is possible, see Equation (3). What really happened cannot be predicted, especially in view of the fact that an infinite number of different cases exist besides cases α) and β). These examples show that when pressure differences are used to obtain mechanical energy, conditions exist which are associated with very different amounts of heat. The main point of this analysis is that the transition of a gas from an initial pressure to a final pressure is essentially realized by process variables that depend on the chosen path for the transition. The analysis shows that wind turbines can have both a positive and a negative influence on the ambient temperature. What actually is the case cannot be predicted and depends on the specific circumstances during operation.
5. Conclusion and Summary
A mathematical analysis of data considered to be reliable has shown that the increase in carbon dioxide concentrations in the atmosphere observed over the last 200 years is accompanied by an increase in the mean ambient temperature. Since this rise in temperature coincides with the period of growing industrialisation, it is obvious that it was caused by mankind. This man-made climate disturbance must be clearly distinguished from climate change. There is a connection between man-made climate disturbance and an increase in the CO2 concentration in the atmosphere, which is a part of the greenhouse effect. Its proportion in the atmosphere has increased by 0.1‰ from about 1800 to today. This influence on the ambient temperature is therefore very small compared to a possible increase of about one degree by the annual energy consumption of mankind. The energy required for industrial development is primarily generated by burning fossil fuels, which necessarily produce carbon dioxide as a reaction product. The temperature rise observed in the environment is therefore a consequence of the additional energy input into our environment when exothermic reactions are used to generate energy. The irradiated solar energy was in dynamic equilibrium with all energy-changing processes taking place on Earth before about 1800. This dynamic equilibrium has recently been affected by a second dynamic equilibrium, the input of additional energy that might be termed a climate disturbance. Only the climate disturbance can be influenced by our human actions. The conclusion to cover the energy demand of mankind not by fossil fuels but by renewable energies does not necessarily lead, as we have seen, to a reduction of the temperature rise in the environment. It must be carefully examined whether the use of renewable energy can actually contribute to preventing the warming of the environment. Safety can only be achieved by using energy sparingly. Nevertheless, the use of the most renewable energies reduces air pollution compared to fossil energy sources. The development of new technologies should deliver results in terms of energy consumption that come as close as possible to the theoretical efficiency of the process and ensure the economical use of natural resources. If new products are created, it is important to avoid not necessary packing material. Especially the remanufacturing of waste products is a main point in the development of new technologies. It saves energy and raw materials. It is also important to avoid large distances between the sources of raw materials and the place of their manufacturing. The sustainability of new technologies should be an important factor for their application. Mankind, has the possibility and the obligation to work for the preservation of the entire system of our planet. This requires fundamental changes. An economy based on constant growth can only be tolerated if this growth is based on the complete reuse of materials whose production was particularly energy-intensive. Energy savings must be achieved compared to the original manufacturing process. Since all processes involve energy conversions, it must be strictly examined whether a new process is necessary for the preservation of our world.
NOTES
*For the generation of our grandchildren, for Raven, Laura, Tim, Florian, Lilly, and Robert.