Adsorption and Kinetic Study of Activated Carbon Produced from Post-Consumer Low-Density Polyethylene (LDPE) Wastes ()
1. Introduction
In an effort to rid the environment of polymeric wastes, there is wide attention towards converting these wastes materials into usable form. Polymeric wastes are organic material with high percentage of carbon which can be converted into value added activated carbon. Activated carbons are carbonaceous materials that are synthesized through the pyrolysis of materials containing a high carbon content and low inorganic content [1]. Activated carbons have good adsorbent properties with a wide range of applications in the removal of species (contaminants) by adsorption from the liquid or gas phase [2].
In the preparation of activated carbon, the choice of precursors is influenced by factors such as cost, availability and renewability of the material, amount of nutrient, and organic content of the material. Commercial activated carbon is often obtained from the pyrolysis and subsequent activation of high-cost starting materials such as coal and petroleum, which seems to be quite expensive and at the same time poses environmental pollution issues. In an attempt to lower the cost of production, there is a global effort by researchers towards utilizing renewable and less-expensive precursors for the preparation of activated carbon. Such precursors include wood, agricultural byproducts, coal, synthetic resins, forest wastes, and industrial wastes [3].
However, previous studies have shown that AC is obtained from agricultural byproducts and forest wastes as an alternative for commercial activated carbon [4]. Examples of such wastes/byproducts include: plywood and chipboard wastes, scrap tyres [5], grain sorghum [6], pistachio-nut shell [7], molasses [8], coconut shells [9], waste apricot [10], rubber wood sawdust [11], oil palm fiber [12], sugar beet bagasse [2], rice straw [13], bamboo, rattan sawdust [14], pecan shell [15], palm shell [16], coconut husk [17], urban sewage, paper mill sludge [18], herb residues [19], Jatrophacurcas shell [20], and grape seeds [21].
The concept of preparing AC from post-consumer wastes is gradually evolving, and is aimed at achieving a facile, low cost and new environmentally friendly technology for both polymer recycling and the synthesis of carbonaceous substrates. The polymeric wastes to be used in this study are low-density polyethylene (LDPE) wastes. Polyethylene (PE) is the most common plastics with an annual global production of about 80 million tonnes [22]. PE has found major applications in packaging such as plastic bags, plastic films, containers, etc. According to its density and branching, PE is most commonly classified into high-density polyethylene (HDPE) and low-density polyethylene (LDPE) [23]. LDPE has a density in the range of 0.910 - 0.940 g/cm3, and is characterized with a high degree of both short and long chain branching which is responsible for its desirable flow properties. It has a lower tensile strength and high ductility [24]. It is suitable for containers that are rigid and also used in plastic film applications such as film wraps and plastic bags. In 2013, the global LDPE market had a volume of almost US$33 billion [24].
The choice of this precursor is informed by the fact that they are used in all forms of packaging, thus, the wastes are regularly seen in waste bins and refuse dumps. These wastes are not readily degradable; thus, they occupy valuable landfill space and constitute serious environmental problems. Moreover, one of the shortcomings associated with its degradability is that unless it is treated specially, it does not biodegrade easily [25]. Hence, the need to get rid of them in an environmentally-friendly way.
In this study, post-consumer LDPE nylon wastes are used to synthesize activated carbon using pyrolysis and chemical activation. The reaction conditions: carbonization temperature, time, and concentration of the chemical activating agents were varied. The effects of variations on the produced carbons were investigated by studying their physico-chemical properties. This is followed by process optimization and model validation. Subsequently, adsorption and kinetic studies were carried out via the removal of manganese, chromium, and cobalt ions from simulated water solutions.
2. Materials and Methods
2.1. Raw Materials, Chemicals, and Preparation of Samples
Nylon wastes of LDPE were obtained from various refuse dump sites in Ile-Ife, Osun state, Nigeria. Plate 1 shows a piece of post-consumer LDPE waste used as a precursor in this study.
The precursor wastes were washed with water and dried at room temperature for 24 hrs. They were shredded into pieces and put into the reactor. All chemicals used for this work were of analytical grades and they include potassium hydroxide (KOH), hydrogen tetraoxosulphate (VI) acid (H2SO4), potassium iodide (KI), hydrochloric acid (HCl), starch soluble, iodine crystals, sodium thiosulphate (Na2S2O3∙5H2O), potassium per manganate (KMnO4), cobalt (II) chloride (CoCl2), and potassium dichromate (VI) (K2Cr2O7).

Plate 1. A precursor waste of low-density polyethylene (LDPE).
2.2. Design of Experiment
The design of the experiment was performed using Design Expert software package, version 10.0.1 (Stat-Ease Inc., Minneapolis, MN, USA) and is used to evaluate the coefficients of the regression model equation and their statistical significance. The range of concentrations of the chemical activating agents, carbonization temperature and time were between 0.5 - 2.0 M [1], 400˚C - 500˚C [3], and 45 - 60 mins [26] respectively as shown in Table 1. The central composite design (CCD) was used to obtain (nineteen) 19 random experimental runs which include: five (5) centre points, six (6) axial points, and eight (8) factorial points.
2.3. Pyrolysis Procedure and Chemical Activation of Produced Carbons
Pyrolysis was carried out under a flow of nitrogen gas at the different corresponding temperatures and time. Samples (carbonized char) were removed from the reactor and crushed, followed by rinsing with large volume of distilled water. This is followed by sieving with a screen mesh of 106 µm in order to obtain smaller particles with increased and uniform surface area for efficient chemical activation of the raw materials. The carbonized char was then chemically activated using hydrogen tetraoxosulphate (vi) acid (H2SO4), and potassium hydroxide (KOH) at different concentrations depending on the factor levels as shown in the designed experiment. Chemical activation was carried out using a muffle furnace at 550˚C for a period of 30 mins. The chemically activated products were crushed and washed repeatedly with large volume of distilled water in order to remove excess activating agent and residual inorganic matter. Subsequently, they were dried and stored in a closed container for characterization.
Activated carbon yield of each sample was determined using the method adopted by [1].
2.4. Physico-Chemical Analysis of Activated Carbon
The physico-chemical tests were done using standard procedures. The moisture content was obtained using the oven-drying test procedure [27]. The apparent density of each activated carbon sample was determined according to the method adopted by [28] using a graduated measuring cylinder. Ash content was determined according to standard procedure [29]. The iodine value experiment was also performed according to ASTM standard method [30]. The experiment was carried out in triplicates and their average values recorded.
![]()
Table 1. Factor levels for the experimental design.
2.5. Adsorption Studies
50 ppm of potassium per manganate (KMnO4), 50 ppm of potassium dichromate (VI) (K2Cr2O7) and 100 ppm of cobalt (II) chloride (CoCl2) solutions were separately prepared in 1 L volumetric flask using distilled water. About 0.25 g of AC sample was added with 50 mL of each simulated water solution and the resulting mixture was agitated with the rotary shaker at 150 rpm for 60 min. The mixture was subsequently filtered with Whatman No.1 (18.5 cm) filter paper, and the absorbance of the filtrate obtained for each of Mn2+, Cr2+, and Co2+ ions were determined using UV-Visible spectrophotometer at wavelengths 545.5 nm, 431 nm, and 351 nm respectively. The absorbance was used to obtain the remaining concentration (Cf) of the adsorbate in each case by means of the standard calibration curve.
The percentage removal is expressed in Equation (1) as:
(1)
where C0 and Cf are the initial and final concentrations of the adsorbate in solution respectively.
2.6. Optimization of Reaction Conditions and Model Validation
Statistical analysis for the optimization of AC obtained from LDPE wastes was carried out by setting yield and bulk density to be in a range, moisture content and ash content were set to be minimum, and iodine value and adsorption performance were set to be maximum. This was done in order to have both acid and base optimized AC.
Model validation was done by repeating the experimental procedure for both pyrolysis and chemical activation step at the optimized factor levels for concentration, temperature, and time. The physicochemical properties of the optimized AC produced were investigated and the error was obtained using Equation (2):
(2)
2.7. Characterization of LDPE-H2SO4 and LDPE-KOH
Fourier Transform Infrared (FTIR) analysis was used to determine the type of functional groups in the produced optimized carbon. About 0.1 g of the sample was mixed with 1 g of potassium bromide (KBr), spectroscopy grade (Merk, Darmstadt, Germany), in a mortar. Part of this mix was introduced in a cell connected to a piston of a hydraulic pump with a compression pressure of 15 kPa/cm2. The mix was converted to a solid disc which was placed in an oven at 105˚C for 4 hours in order to prevent any interference with any existing carbondioxide or water vapour molecules. Subsequently, it was transferred to the FTIR analyzer (Nicolet: S5, thermo scientific, Helios Omega, USA) to obtain the spectrum [31]. The peaks were identified by comparing with those in literature.
Scanning Electron Microscopy (SEM) analysis was also used to study the surface morphology of the optimized carbons. The topographical images of the sample were captured by SEM machine (ASPEX 3020 Type-I, Japan). About 0.1 g sample was sticked to the mounting plate and was fastened to the stage using screw. Sample is below the top of the drawer. The sample drawer was held in snug with the right hand, the lever pulled down with the left hand and held snuggly for about 20 - 30 mins. At a pressure of approximately 5 × 10⁵ torr, vaccum pump starts and the drawer held up [32]. Magnification was increased to the desired factor. Moreover, brightness/contrast and spot size were adjusted for optimum resolution and signal. The images and spectra obtained were saved.
2.8. Adsorption and Kinetic Studies of AC
Batch adsorption studies were carried out to evaluate the adsorption capacity of the optimized AC. A weighed adsorbent sample (0.25 g) of optimized AC was added into 100 mL KMnO4 aqeous solution having an initial concentration of 50 ppm, at pH 6.5 occurring at room temperature. The aqueous samples were put in the rotary shaker for continuous agitation at 150 rpm. Adsorption, equilibrium, and kinetic data were obtained by analyzing the remaining KMnO4 concentration in the batch reactor at pre-set intervals of 15 mins using UV-visible spectrophotometer until equilibrium was achieved. The adsorbent dosage and initial KMnO4 concentration adsorption uptake on the adsorbents were studied by varying the adsorbent dosage from 0.25 to 1.00 g and initial KMnO4 concentration from 50 to 125 ppm. For reliability of results, the experiments were repeated for three times with an uncertainty value of about ±9% obtained.
The adsorption capacity was evaluated using Equation (3):
(3)
where Co (mg/L) is the initial concentration of KMnO4 in contact with adsorbent, Ct (mg/g) is the final concentration of KMnO4 after the batch adsorption procedure at any time t, M (g) is the mass of adsorbent and V (L) is the volume of the aqueous solution.
Four (4) two-parameter isotherm models were used in this study. These are Langmuir, Freundlich, Temkin and Dubnin-Radushkevich isotherm models. The linear forms of the isotherm models as shown in Table 2 were fitted into the adsorption data to obtain the adsorption parameters, correlation coefficients, and also used to explain the statistical significance of the parameters on the adsorption behaviour of the system.
Kinetic Studies
In liquid-solid adsorption process, the kinetic models help in describing the rate of solute uptake which is usually a function of the residence time. The kinetic study of metal ions on adsorbent is carried out using the pseudo-first and second order kinetics. The mechanism of diffusion of liquid-solid processes is explained using the intraparticle diffusion model [40]. The pseudo-first order model, pseudo-second order model, and the intraparticle diffusion models were employed in this study.
![]()
Table 2. Adsorption isotherm models and their significance.
Source: Self. Where qe represents the equilibrium adsorption capacity of solute per unit mass (mg/g), Ce the equilibrium concentration per unit mass of adsorbate in bulk solution (mg/L), kL is the constant that relates to the free energy of adsorption (L/mg), qm denotes the maximum adsorption capacity (mg/g); Kf is the Freundlich constants representing the adsorption capacity of the carbon, n represents the adsorption intensity which is a function of the system’s characteristics; A and B are the temkin parameter isotherm constants, B is the molecular interaction parameter, b relates to the heat of adsorption, T (K) is the absolute temperature, and R is the ideal gas constant (8314 J∙mol−1∙K−1); β is the free sorption energy per mole of the adsorbate as it moves to the surface of AC from an infinite distance within the solution (kJ2∙mol2), and ε is the polanyi potential (J∙mol−1).
Pseudo-first order model: This is often expressed as:
(10)
where qt represents the adsorption capacity per unit mass at any time t (mg/g) and k1 is the pseudo-first order rate constant (1/min). Integrating Equation (10) and applying appropriate boundary conditions (att = 0, qt = 0; and at t = t, qt = qt) gives:
(11)
Pseudo-second order model: The differential form is expressed by Equation (12):
(12)
Upon integration of Equation (12), and then applying boundary conditions leads to Equation (13):
(13)
(14)
where
(mg∙g−1∙min−1) is defined as the initial adsorption rate as t → 0 and k2 is the pseudo-second order rate constant (g/mg∙min).
Intraparticle diffusion model: One major assumption associated with this model is that the rate-controlling step is the process involving film diffusion. The amount adsorbed at time t is directly proportional to the square root of the time of contact. This is expressed in Equation (15):
(15)
where qt represents the amount of adsorbate at time t and Kdiff (mg∙g−1∙min−1) is the intraparticle diffusion constant. The interceptC provides information about the thickness of the boundary layer. Higher values of the intercept lead to stronger effect of the boundary layer.
3. Results and Discussion
3.1. Thermal Decomposition of LDPE
The thermal decomposition of polymers involved both physical and chemical processes, the extent of which depends on the nature of the material, the degree of crystallinity (molecular packing) and the glass transition and crystalline melting temperature. LDPE is a carbonaceous polymer with no heteroatom, having about 60% crystallinity, glass transition temperature (Tg) of −25˚C, and a crystalline melting temperature in a range of 109˚C - 125˚C [25].
During pyrolysis of LDPE, there is a breaking of the main chain bond at a random location resulting in the formation of monomer units and free radicals. LDPE starts to cross-links at temperatures around 202˚C, and decomposes at around 292˚C. Consequently, the products of thermal decomposition of LDPE under inert atmosphere include a wide range of alkanes and alkenes such as ethane, ethene, propane, propene, butane, but-1-ene, and hex-1-ene.
The depolymerization process involves decomposition by random chain scission; a multistep radical chain reaction, which includes the initiation, depropagation, branching, and termination steps. Depolymerization of LDPE involves both the intramolecular and intermolecular hydrogen transfer and the unzipping reactions. The intramolecular hydrogen transfer involves the transfer of a hydrogen atom within a single polymer chain as illustrated in Equation (16).
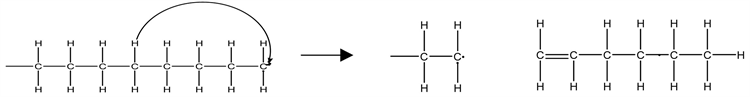 (16)
(16)
The intermolecular hydrogen transfer involves the transfer of a hydrogen atom between polymer chains whereby a radical abstract a hydrogen atom from the polymer to form a new radical which breaks up to form an unsaturated polymer. This is illustrated in Equation (17):
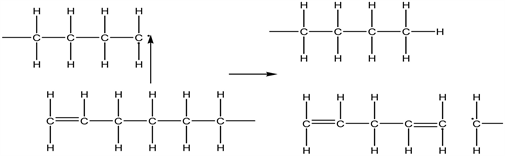 (17)
(17)
The unzipping process usually does not require hydrogen transfer. The mechanism is shown in Equation (18).
 (18)
(18)
The activated carbons produced from acid-activated and base-activated LDPE wastes were designated LDPE-H2SO4, and LDPE-KOH respectively. The chemical activating agents used on the carbon samples act as both oxidizing and dehydrating agents and help to promote the formation of both cross-linked and oxygen-containing carbon structures.
The various AC samples were characterized and their adsorption uptake was evaluated. The results obtained are shown in Table 3 and Table 4 for both acid- and base-activated precursors respectively.
![]()
![]()
Table 3. Table of results showing the interactive effects of concentration, temperature, and time on the physico-chemical properties and adsorption capacities of LDPE-H2SO4.
![]()
Table 4. Table of results showing the interactive effects of concentration, temperature, and time on the physico-chemical properties and adsorption capacities of LDPE-KOH.
3.2. Interactive Effects of Temperature, and Time on AC Yield
The yield of AC from LDPE was found to significantly depend on the pyrolysis temperature and time. It was observed that both linear and quadratic terms of temperature and time of LDPE (B, C, B2, C2) were found to be significant to the model due to their very low F-values of <0.0001, <0.0001, 0.0138, and 0.0195 respectively.
The overall model F-value of 17.57, its low standard deviation value of 0.58, and high R-Squared value of 0.9462 are a pointer to the high confidence level and significance of the model with respect to yield. This agrees with Betiku and Adepoju [41] where it was reported that the higher the F-value and the lower the P-value of any model term, the more significant will be the model. The coefficient of determination (R2) determines the goodness of fit of the model and a minimum value of 0.80 is required [41].
Figure 1 shows the 3D surface plot detailing the interactive effect of temperature and time on yield. It was observed that at temperature of about 410˚C and time of around 46 mins, an optimum yield of 26.38% is obtained. At higher temperatures and higher time, the yield was found to significantly decrease. An increase in pyrolysis temperature further enhances both elimination and dehydration reactions within the polymer molecules, thus leading to evolution of volatile matter. Thus, as both pyrolysis temperature and activation time increases, the % yield decreases as shown in Figure 1. This agrees with previous work done by Gonsalvesh et al., [26] whereby it was reported that an increase in activation time from 30 - 120 mins leads to a reduction in the yield of carbon synthesized from polystyrene (PS) precursor from 48% to 33%.
The obtained yield for LDPE was found to be higher than the values reported by Qiao et al., [42] where a carbon yield of 9% - 18% was obtained from resin polyvinyl chloride precursor. However, it falls within the range reported by László et al., [43] whereby carbon yield in the range of 17% - 21% were obtained from different PET samples at different temperatures and time.
The relatively low yield of LDPE can be attributed to its low-density in nature, and its relatively low molecular weight when compared to other polymers with higher molecular weights like PS, and PVC.
![]()
Figure 1. 3D Plot showing the effects of time and temperature on the yield of LDPE.
3.3. Effects of Concentration, Temperature, and Time on Moisture Content of AC
AC with a minimum amount of moisture content is generally desirable and this occurs at lower concentration of about 0.6 M and activation time of 58 mins as shown in Figure 2.
The ANOVA Tablefor the moisture content of LDPE-H2SO4 is shown in Table5. The linear terms A, B, and C and quadratic terms A2, C2 are quite significant due to their respective p-values of 0.0071, 0.0127, 0.0456, 0.0396, and 0.0466.
The model F-value of 4.24, low standard deviation value of 0.40 and adequate R-squared value of 0.8091 all points to the significance of the model and can be used to navigate the design space. The 3D surface plot shown in Figure 2 indicates that at lower concentrations and higher carbonization temperature, AC with low moisture content is obtained.
The moisture content values obtained for both acid and base-activated LDPE were found to be similar and increases as the concentration of the chemical activating increases. The values agree with previous work done by Adibfar et al. [44] where they reported that moisture content of AC produced from H2SO4-activated PET was 2.7%. However, the values are slightly higher than those reported by Al-Othman et al., [1] where carbons produced from agricultural and municipal solid wastes at different temperatures and concentrations of ZnCl2 are reported to have moisture content values ranging between 0.16 and 0.76%. This higher moisture content value could be attributed to the nature of the activation agent.
![]()
Figure 2. 3D surface plot showing the interactive effect of concentration and temperature on the moisture content of LDPE-H2SO4.
![]()
Table 5. Analysis of variance results with respect to moisture content of LDPE-H2SO4.
3.4. Effects of Concentration, Temperature, and Time on Bulk Density of AC
The bulk densities of LDPE-H2SO4 and LDPE-KOH wastes were found to be within 0.411 - 0.481 and 0.401 - 0.476 g/cm3 respectively. These values were lower than those reported by László et al., [43] where the densities of PET-carbons produced at ambient temperatures but with different heat treatment ranges from 1.267 - 1.818 g/cm3. The obtained values are however, slightly higher than those of [44] where 0.20 - 0.33 g/cm3 were observed for different chemically activated samples. These differences in figures are a strong indication that the densities of carbons are largely influenced by factors such as particle size distribution, method of treatment/activation, the type and concentration of the chemical activating agents. Moreover, it was generally observed that the bulk density slightly increases as concentration of the chemical activating agent increases. That is to say, the higher the concentrations of activating agents used, the higher the moisture content of the produced carbons and the higher their bulk densities. However, an optimum value is reached such that a further increment in concentration of the activating agent does not affect the bulk density of the AC produced.
3.5. Effects of Concentration, Temperature, and Time on Iodine Value
The interaction between concentration and temperature is shown in Figure 3. It
![]()
Figure 3. 3D Surface plot showing the interactive effect of concentration and temperature on the iodine value of LDPE-H2SO4.
can be deduced that higher iodine values are obtained at concentrations > 1.0 M and temperatures > 440˚C.
At lower concentrations, the iodine value was relatively low due to insufficient amount of activating agent to react with the carbon to create the internal porosity. However, at higher reaction conditions, the microspore structure of the carbons is fully developed. The plot shows that iodine number increases as activation temperature and concentration increases. Moreover, it was observed that LDPE-KOH has higher iodine values than LDPE-H2SO4. This is in consonance with the findings carried out by Adibfar et al., [44] where it was reported that AC from KOH-activated PET has a relatively higher iodine value of 984 mg/g compared to H2SO4-activated PET sample reported to have 670 mg/g. In the study of heat effects on some synthesized carbon, László et al. [45] reported iodine value of 402 mg/g for AC obtained PET while Gonsalveshet al., [25] reported iodine adsorption capacities of 650 to 970 mg/g of AC produced from polystyrene (PS) precursor.
However, the reported values of [44] and other related works are relatively slightly lower than the obtained values in this study. The difference in values has to do with the nature of the polymeric precursor used in each study. Although, LDPE produced a low yield of AC, it was found to be highly porous as reflected in its iodine value determination.
The ANOVA Tables showed in Table 6 and Table 7 explains the statistical significance of the model terms on iodine value of AC produced from LDPE wastes. The linear terms A, B, C and quadratic terms A2, B2 are significant and can predict the model statistically. This implies that all three factors of concentration, temperature, and time play significant role in the surface chemistry and the development of the porosity of the carbons. The model F-values of 4.32 and 6.92 implies the models are significant, coupled with their good R-Squared values of
![]()
Table 6. Analysis of variance results with respect to iodine value determination of LDPE-H2SO4.
![]()
Table 7. Analysis of variance results with respect to iodine value determination of LDPE-KOH.
0.8120 and 0.8738 respectively. The precision values indicate an adequate representation of the model, and thus the model can be used to navigate the design space.
Table 8 represents a summary of the test of significance and final equations in terms of coded factors with respect to iodine value for the AC produced.
The relative impact of the factors is measured by comparing the factor coefficients and it is observed from the model equations of LDPE-H2SO4 and LDPE-KOH that the quadratic terms A2 have higher co-efficient of 79.68 and 98.52 respectively. This indicates that A2 is the most significant model term in the iodine value determination of AC. Thus, the concentration of the chemical activating agent used best predicts the iodine value.
3.6. Interactive Effects of Concentration, Temperature, and Time on the Adsorption Rate of Carbon from Mn7+, Cr6+ and Co2+ Solutions
The adsorption capacities of AC produced from LDPE-H2SO4 and LDPE-KOH using different simulated water solutions each containing manganese, chromium, and cobalt ions were investigated. Table 2 and Table 3 shows that carbons produced from LDPE has adsorption capacities ranging between 68% - 77%, 58% - 66%, 69% - 77% for Mn2+, Cr2+, and Co2+ respectively. The change in the initial purple colour of manganese, and bluish-pink colour of cobalt to both colourless solutions at equilibrium is as a result of the reduction of Mn7+ and Co2+ to Mn2+ and cobalt metal in their respective solutions. For the chromium ions, a mild change in colour from yellow to light yellow was visually observed; this reflects the relatively lower adsorption capacity of the carbon for the effective reduction of chromium (Cr6+ to Cr3+ ions) compared to manganese and cobalt ions.
In all cases, it was observed that AC produced at concentrations of 1.4 - 2.0 M and at temperatures above 450˚C have higher adsorption performance. In other words, increase in carbonization temperatures and concentration of chemical activating agent helps to develop and widen the pores of the carbon and makes its surface available for adsorption.
The interactive effect of concentration and time on the adsorption performance was investigated using the 2D contour plot shown in Figure 4. A maximum adsorption rate of 66% was seen to occur at the reaction conditions of 1.7 M KOH and 57 mins.
Table 9 shows the effects of the interactions of the model parameters on the adsorption uptake of the produced carbons.
![]()
Table 8. Summary of the final equations in terms of model parameters for iodine values.
![]()
Figure 4. 2D Contour plot showing the interactive effect of concentration and time on the adsorption rate of LDPE-KOH for the removal of Cr2+.
![]()
Table 9. Summary of the final equations in terms of model parameters with respect to Cr2+ adsorption uptake.
It was shown that the linear terms A, B, and C, and all quadratic terms A2, B2, and C2 are significant for the effective adsorption of ions from aqueous solutions.
3.7. Optimization Studies and Model Validation
Optimization studies were carried out and the model was validated using a set of experiment operated under optimized reaction conditions. The desirability of the models was very close to unity (1). Table 10 shows the conditions of optimization and obtained results used in the validation of the model. The optimized reaction conditions for LDPE-H2SO4 are 1.21 M, 478.90˚C, and 60 mins. Under these conditions, the yield was found to be 21.27%, 1.21% moisture content, 0.4118 g/cm3 bulk density, Iodine value of 814.98 mg/g; % removal of Mn, Cr, and Co were found to be 76%, 66%, and 77% respectively. On the other hand, the optimized conditions for LDPE-KOH are 1.00 M, 446.50˚C, and 51.09 mins. The results obtained under these conditions are a yield of 24.01%, moisture content of 1.01%, bulk density of 0.3862 g/cm3, iodine value of 988.69 mg/g, 76% Mn removal, 64% Cr removal, and 76% Co removal.
![]()
Table 10. Optimization and model validation results.
The error was obtained as the difference between the statistically predicted response and the actual response. The percentage error was calculated using Equation (3).
3.8. Fourier Transform Infrared Spectroscopy Analysis (FTIR) Results
Figure 5(a) and Figure 5(b) show the FTIR spectra of both LDPE-H2SO4 and LDPE-KOH produced under optimized reaction conditions respectively. Measurements were done over the range of 4000 - 400 cm−1 and peaks were assigned to the functional groups with reference to their respective wave numbers. In the functional group region (1500 - 3000 cm−1), the sharp needle-like peaks between 1634 - 1651 cm−1 represent the C=C stretching vibrations [46]. The bands at 2920 - 2997 cm−1 are the sp3 -CH bonds. The peaks between the region 3258 - 3303 cm−1 represent the sp2 C-H stretching vibrations. It also suggests the presence of O-H stretching vibrations associated with intermolecular H-bonding [47] obtained as a result of chemical activation of the porous carbons.
In the fingerprint region (1500 - 600 cm−1), the peaks at 1399 cm−1 and 1408 cm−1 from Figure 5(a) suggests the presence of a strong S=O stretching vibration associated with a sulphate group (
) and/or the presence of O-H bending vibrations associated with carboxylic acid [47]. Both of these bonds can be attributed to the sulphuric acid activation of the carbon. However, the peaks at 1101 cm−1 and 1288 cm−1 in Figure 5(b) suggest the presence of C-O bond which is likely as a result of base activation of the carbon. The FTIR analysis shows that the synthesized materials are purely rich in sp3 and sp2 carbon bonds. It also reveals the presence of oxygen on the surface of the produced carbons.
3.9. Scanning Electron Microscopy (SEM) Analysis
SEM analysis was carried out on both LDPE-H2SO4 and LDPE-KOH optimized sample products in order to observe the surface physical morphology of the derived carbons. Plate 2 shows the visual carbon sample obtained from LDPE-H2SO4.
The micrographs of the carbons are shown in Figures 6(a)-(d).
The images show the presence of holes, cave openings and pores on the surface of the carbon. Moreover, there is extensive porosity introduced by chemical
![]()
Figure 5. FTIR Spectrum (a) LDPE-H2SO4 (b) LDPE-KOH.
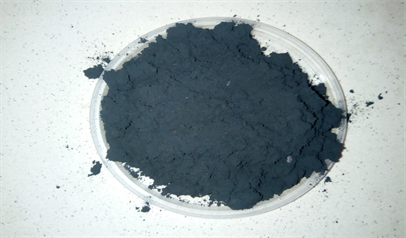
Plate 2. AC produced from LDPE-H2SO4.
activation in both carbon structure. This leads to an increase in the number of sites that are available for adsorption; and thus, promoting the interfacial capacity of the carbons for adsorption of inorganic ions.
3.10. Adsorption Isotherm Studies
The isotherm data was analyzed and fitted to four different sorption models: Langmuir, Freundlich, Temkin, and Dubnin-Radushkevich isotherms. The characteristics parameters for each isotherm and their respective correlation coefficients were evaluated and represented in Table 10. The isotherm graphs are shown in Figures 7(a)-(d). From results obtained, the maximum adsorption monolayer capacity of the Langmuir isotherm model (QL) decreases from 53.1915 to −7.5873 mg/g as the adsorbent dosage is increased from 0.25 g to 1.00 g. When higher amount of mass of adsorbent is used, the model fits almost perfectly except in the case of the Langmuir adsorption of 0.50 g adsorbent mass where the R2 was obtained to be 0.0443. In addition, the analysis of the equilibrium data shows that the adsorption process is a favourable one as the separation factor RL values are between 0 and 1. Curko et al., [48] reports that for any adsorption process, the process can either be: irreversible at RL = 0, favourable at 0< RL < 1, or unfavourable at RL > 1. The high values of the Langmuir constant KL indicate that the AC has a large surface area and pore volume; thus, a high adsorption capacity.
The Freundlich model fits the data than the other isotherms due to its relatively higher R-squared values as shown in Table 11. It has higher correlation
![]()
Figure 7. (a) Langmuir Adsorption Isotherm of LDPE-H2SO4; (b) Freundlich Adsorption Isotherm of LDPE-H2SO4; (c) Temkin Adsorption Isotherm of LDPE-H2SO4; (d) D-R Adsorption Isotherm of LDPE-H2SO4.
![]()
Table 11. Adsorption rate law parameters and correlation coefficients for LDPE-H2SO4.
coefficients of 0.9986 and 0.9969 at an adsorbent dosage of 0.25 and 0.75 g respectively, thus, suggesting that an optimum amount of adsorbent mass is needed for the adsorption study. Values obtained for (1/n) andKf shows that there’s an energy distribution on the adsorption surfaces, and the interaction between manganese molecules and the adsorbent in the course of adsorption is sufficient.
The Temkin isotherms also fits the adsorption data with R2 values ranging from 0.9944, 0.8454, 0.9808, and 0.8757 for 0.25, 0.50, 0.75, 1.0 g of adsorbent mass respectively. The positive value of constants A andB indicates that the interactions between carbon and manganese molecules involve an adequate distribution of binding energies and that the adsorption process reduces linearly with coverage [49].
The equilibrium values were also tested with the D-R model, and adsorption values were obtained for Qm (mg/g), and E as shown in Table 11. The model was found to be a good fit with respect to the obtained correlation co-efficient.
3.11. Kinetic Studies
Kinetic models were used to analyze the kinetic data generated from the experiment, and to explain the adsorption mechanisms. The kinetic conditions are: 0.75 g adsorbent dosage, pH 6.5, KMNO4 adsorbate concentration of 100 mg/L, and a 150 revolution per minute (rpm) agitation rate. The data obtained are shown in Table 12.
The linearized forms of both the pseudo-first order (Equation (11)) and pseudo-second order models (Equation (14)) were used to obtain graphs shown in Figure 8(a) and Figure 8(b) respectively, and also to evaluate the rate law parameters. The kinetic rate constants K1 and K2 were found to be 0.0380 min−1 and 0.0023; with correlation coefficients of 0.9548 and 0.9850 respectively. These high R-squared values confirm the possibility of the applicability of both models to the sorption process. The pseudo-second model helps in the evaluation of equilibrium amounts of manganese ions obtained at equilibrium and the initial adsorption rates (h) as t tends to zero. The relatively higher K2 and R2 values of the pseudo-second order reaction help to confirm that the adsorption of manganese ions onto the surface of the synthesized porous carbon follows a pseudo-second order kinetics.
![]()
Table 12. Kinetic rate law parameters and their corrrelation coefficients for LDPE-H2SO4.
Note: “-” denotes not applicable.
![]()
Figure 8. The kinetic graphs showing the rate of adsorption of manganese ion by LDPE-H2SO4 (pH6.5, adsorbent dosage 0.75 g/100 mL of adsorbate concentration) (a) Pseudo-first order (b) Pseudo-second order.
![]()
Figure 9. Plot showing intraparticle diffusion mechanisms for Mn7+ Adsorbed onto LDPE-H2SO4 (C0 = 100 mg/L, room temperature, pH = 6.5, adsorbent dosage 0.75 g).
The intraparticle diffusion model illustrates the diffusion mechanisms involved during the sorption processes. The graph in Figure 9, represents a plot of the number of ions adsorbed as a function of t1/2 under the conditions of reaction. It can be deduced from the plot that more than one step is involved in the diffusion process [49]. The first step is the external surface or instantaneous adsorption stage which lasted for a period of 36 mins. The next stage in the adsorption process occurs where intraparticle film diffusion determines the kinetics of the process. The carbon macropore structures are assumed to be relatively larger than the size of manganese molecules. Consequently, the adsorbate molecules experience film diffusion resistance on both the carbon surface and the large macropores. The intraparticle film diffusion model explains the kinetics of manganese adsorption on porous carbons and it shows that the kinetics occur from a period of 36 min up to approximately 120 mins. The diffusion rate constant Kp was obtained from the slope of the line in the second stage and was found to be 0.62 mg/g∙min1/2, while the correlation coefficient was obtained as 0.9318. The third (final) stage is the equilibrium stage where intraparticle diffusion starts to slow down due to extremely low manganese concentrations in the solutions.
4. Conclusions
This study has confirmed the suitability of producing low-cost activated carbon from wastes of LDPE that have been found to be ubiquitous and non-biodegradable. These wastes are a good precursor for the production of AC, and also suitable as an adsorbent for the effective removal of inorganic ions from solutions. The optimization studies were carried out by studying the effects of variation of the model parameters (reaction conditions). The model parameters and overall model were found to be statistically significant. Optimized reaction conditions for LDPE-H2SO4 were found to be: 1.21 M, 478.90˚C, and 60.00 mins while that of LDPE-KOH was 1.00 M, 446.50˚C and 51.09 mins. FTIR results reveal the presence of oxygen-rich compounds such as hydroxyls, aldehydes and carbonyls, which is as a result of introduction of chemical activating agents to the surface of the carbons. This chemical activation process was found to increase the porosity of the produced carbons as obtained from the SEM analytical results. Adsorption and kinetics studies were carried out by varying the effects of adsorbent dosage, contact time, and initial adsorbate concentration. The adsorption studies showed that the Freudlich isotherm model perfectly fits the equilibrium data obtained at an adsorbent dosage of 0.75 g, pH 6.5, and agitation rate 150 rpm. The acid-activated carbon was found to have better adsorptive properties in aqueous solutions than the base-activated carbon. The pseudo-second order model provides the best correlation for the data obtained and agrees with the dynamic behavior for the sorption of Mn7+ onto the AC.
More surface modifications can be done to effectively introduce some tailored surface properties on the carbon surface in order to further enhance the adsorption process and reduce the equilibrium time. The use of Nuclear Magnetic Resonance (NMR) (T1, T2, and PFG-NMR) techniques to probe the structural and diffusion behaviour of the porous carbons will be done in subsequent studies.
Acknowledgements
Olajumoke Alabi-Babalola will like to acknowledge the Petroleum Technology Development Fund (PTDF), Nigeria, Carmine D’Agostino, and the University of Manchester, United Kingdom for supporting her research activities.