Genetic Variation in Salt Stress Response and Germplasm Resource Evaluation among Lycium Accessions ()
1. Introduction
Soil salinization is a growing problem for agriculture worldwide, costing US$ 27.3 billion per year in lost revenue [1] [2]. Soil salinity is claiming about three hectares of arable land from conventional crop farming every minute, and more than 800 million hectares of land (c. 6% of the world’s total land area) is affected by excess salt concentrations [3] [4]. At the same time, irrigated cultivated farmland is also threatened by secondary salt, which accumulates in irrigated soils as water evaporates. In this case, the challenge of feeding 9.3 billion people by 2050 is forcing agricultural production into marginal areas, and providing sufficient food for this growing population cannot be achieved without a major breakthrough in crop breeding for salinity tolerance [5] Based on their tolerance to saline conditions, land plants can be divided into two major groups: halophytes and glycophytes. Halophytes refer to plants that survive to reproduce in environments where the salt concentration is around 200 mM NaCl or more, constitute about 1% of the world’s flora [1] [4] [6] [7]. By contrast, the majority of agricultural products, including major cereals, are produced from glycophytes, which are highly sensitive to salt stress [8]. It is reported that while external salt concentrations (40 - 100 mM NaCl) severely inhibit photosynthesis in glycophytes [3], many halophytes maintain or have enhanced photosynthesis at these salt concentrations [6]. Given the limited range of genetic diversity in stress tolerance within traditional crops, identifying or exploring the salt response genes and mechanisms of halophytes, facilitated by studying natural variation in salinity tolerance among plant species, will undoubtedly bring out selecting traits and target genes for breeding salt-tolerant glycophytic crops [4] [9] [10].
Wild Lycium is one of the pioneers and community-building plants in both desert and salinity soil of Chinese northwest region, so belonging to halophytes plant. Cultivated Lycium species, especially L. barbarum, were well known for their medical and health-care functions, such as anti-aging, improving eyesight, and anti-fatigue effects [11] [12] [13] [14]. Recently, Lycium fruits, known as goji or wolfberry, have become increasingly popular in the western world because of their nutritional properties [15]. One study conducted in China has shown that Lycium is the most valuable economic plants that explanting from its native habitats to the east coastal saline zones [16]. Certainly, Lycium has become an important industry for farmers in northwest China to get rid of poverty and become rich [15]. Considering their great economic, ecological and medical values, as well as their tolerance of dry, leanness and saline-alkali habitats, Lycium is one of the excellent materials for conducting basic research of salt-tolerant mechanism and salinity land improvement [17] [18].
There are approximately 80 species of Lycium (Solanaceae) plants in the world, and seven species and three varieties are found in China [18]. Natural variation among Lycium accessions provides a rich genetic resource for addressing plant function and adaptation to diverse environmental conditions. Genetic variation within a species holds great potential to identify regulatory mechanisms that are not easily uncovered through mutant screens [19]. So far, a novel ethylene-responsive transcription factor (LchERF), and a cytosolic ascorbate peroxidase gene from Lycium chinense Mill has been shown enhanced salt tolerance by overexpressing in tobacco, respectively [20] [21]. A salt stress-responsive betaine aldehyde dehydrogenase has been isolated and characterized in Lycium ruthenicum Murr [22]. The gas exchange, photosynthetic pigments, and chlorophyll fluorescence responses to neutral (NaCl) and alkali (NaHCO3) salt stresses were evaluated in Goji berry (Lycium barbarum L.) from Qinghai region, China [23]. While an increased potassium content and expression of genes encoding potassium channels may underlying Arbuscular Mycorrhizal Fungus rhizophagus irregularis-mediated salt resistance in Lycium barbarum [24], potassium transporter LrKUP8 is essential for K+ preservation in Lycium ruthenicum, a salt-resistant desert shrub [25]. Given these studies were conducted either with a single gene or with a single species [16] [26] [27], our understanding of the genetic mechanisms underlying Lycium plant’s salt-tolerance remains rather poor.
China is ranked the third major country of saline and alkali land in the world, with an area of 100 million hectares of saline and alkali cultivated land. China’s saline-alkali land is mainly distributed in northwest, north, northeast and coastal areas [28]. Planting Lycium that adapted to saline-alkali soil can both improve salt-affected land and increase local farmers’ income. In this way, 20 Lycium accessions, which including the contemporary dominant varieties, but also the farm varieties and semi-wild species collected across the country, were evaluated for their salt stress response. Our aim is not only bringing out target mechanisms for salinity-tolerant crops breeding, but provides the theoretical basis and practical guidance for the vegetation restoration and the saline-alkali land improvement in Chinese northwest region.
2. Materials and Methods
2.1. Plant Material and Treatments
Twenty genotypes of Lycium, including both natural accessions and cultivars, were obtained from National Wolfberry Engineering Research Center, Ningxia Academy of Agriculture and Forestry Sciences, Yinchuan, China (Table 1). Plant materials are annual cuttings, planting in Wolfberry Germplasm Repository (38˚38'49"N, 106˚9'10"E and altitude 1100 m) of this institute. For detail, 7 - 8 cm length cuttages of young shoots were cut with 5 × 20 holes of one-time hole tray. At least 50 cuttages of each genotype were cut to ensure the abundant uniform seedlings. During the procedures, the hole trays were placed in plastic greenhouse, ensuring both the high temperature and the high humidity (watered by sprinkler irrigation system everyday). About 5 weeks later, transplant healthy and uniform seedlings from hole trays to plastic pot (10 × 20 cm), which contain 350 g nursery substrates (matrix soil: field soil: sand: sheep manure = 18:5:2:1). There was one seedling per pot, and more than 20 pots for each genotype. A plate was placed under the pot bottom in avoiding of solution overflowing (Figure 1). During the seedlings recovering period, watering the seeding one time
![]()
Table 1. The Lycium materials and their natural habitats.
Note: HZH (L. dasystemumvar. rubricaulium), BF (L. chimesevar. potaninii), YN (L. yunnanens), ZHG (L. chinens) and HG (L. ruthenicum) belonging to the various natural accessions, while NQC-1, MQ-1, YG, HGB, ZB, NXHG, NQ-5, NQ-2, BT, DMY, M1, NQ-7, NQ-1, XMY and BH belonging to the different cultivars for L. barbarum species.
![]()
Figure 1. Procedures of asexual cutting, growth and NaCl treatment for lycium seedlings. ((A), (B)) photograph of 5 × 20 holes of one-time hole tray, (C) asexual cutting seedlings, (D) plastic greenhouse, (E) plastic pots used both for transfer of seedlings from trays and salt treatment, (F) phynotypes of normal growth seedlings, and (G) seedlings exposed to 300 mM NaCl for 15d.
per 3 days, making sure that the nursery substrates completely soaked, and the same amount of water application for each pot as well. As soon as the seedlings were completely recovered and growth normal, the materials were devided into two uniform groups, in which one group were used as NaCl treatments (watering 200 mL 300 mM NaCl per pot per time) and the other as control (watering the same amount of water per time). The amount of NaCl solution or water for each pot is determined by preliminary experiments under our study conditions. NaCI application 5 times at a 3-days interval, and after 15 days, the leaves were collected as for further analysis.
2.2. Analysis of Permeability of Cell Membranes
The permeability of cell membranes was determined in the leaf discs. Briefly, 10 (about 0.09 g) small leaf discs were punched on clean fresh leaves with a hole puncher and placed in a 10mL centrifuge tube, in which 5 mL deionized water (dH2O) was added previously. After small leaf discs settlement to the bottom of tubes with vacuum assisting, the conductivity was measured using a conductivity meter at room temperature (L1). Then completely transferred the samples together with water from centrifuge tubes to a 10 mL glass tube. After cover the tube plug, the glass tube was boiled in boiling water for 10 min. Untill the tube temperature cooled to room temperature, the conductivity (L2) was measured again. (L1/L2) × 100% was used to represent the conductivity of the leaves.
2.3. Determination of Chlorophylls Content
Foliar chlorophylls content was analysed by a spectrophotometric method, according to a commercial kit instruction (Suzhou komin Biotechnology Co. Ltd., China). Briefly, take fine powder (ca. 50 mg) to 10 mL glass tube, add 0.5 mL of distilled water and a 0.025 g reagent. After which, regulate the volume to 5 mL with extract solution (anhydrous ethanol:acetone = 1:2). The foil packaged glass tubes then maintained in dark conditions after room temperature at least 3 h, ensuring the leaf tissues at the bottom of the tube completely bleaching. The supernatants were used to measure absorbance values at 663 nm and 645 nm wavelengths, respectively.
2.4. Determination of Malondialdehyde (MDA) Content
A spectrophotometric assay was utilized to determine MDA content according to a commercial kit instruction (Suzhou komin Biotechnology Co. Ltd., China). Briefly, addition 0.05 mL extract buffer to 0.05 g sample powder in a 1.5 mL centrifuge tube, and then extract on the ice for several hours. After centrifuged at 10,000 r for 10 min under 4˚C, the supernatant was maintained on ice for following analysis. Making 0.3 ml supernatant mixed with 0.9 ml reagent in a 2 mL centrifuge tube. Then heating the tube by a 95˚C water bath for 30 min (the tubes were tightly closed to prevent moisture loss). After quickly iced to room temperature, centrifuged for 10 min at 12,000 r, 25˚C. The supernatant was used to measure the absorbance at 532 nm and 600 nm wavelength, respectively, and the content of MDA was calculated.
2.5. Analysis of Betaine Content
Betaine content was measured by a spectrophotometric method, according to a commercial kit instruction (Suzhou komin Biotechnology Co. Ltd, China). Fresh Lycium leaves were first heated in 105˚C for 30 min, and then dried to obtain constant weight in 70˚C. After grinding into powder, sieving them through 40 mesh screens. Addition 0.1 g reactive carbon to 0.1 g sample, and addition 5 mL dH2O, rotating turbulence for 1 min. After which, extraction for 30 min at 95˚C, oscillated during the period. Centrifuged 15 min at 12,000 r, 25˚C. Mixed 4 ml supernatant with the same volume redwood salt (pH = 1.0). At the same time, dissolved 4 mg pure commercial betaine in 4 mL dH2O as the standard. After reaction 3 h at 4˚C, centrifuged for 15 min at 10,000 r, 25˚C, and then discarded the supernatant. The sediment was washed by 1 mL 99% ether, and then centrifuged for 10 min at 8000 r, 25˚C. Place the tub in fume hood to let the ether drying naturally. After completely dissolved the sediment by 2 mL 70% acetone, centrifued for 5 min at 8000 r, 25˚C. The supernatant was used to measure the absorbance at 525 nm wavelength.
2.6. K+/Na+ Determination
Dry ashing was utilized to measure the ion content with reference to Zhang et al. [29], by anatomic absorption flame spectrophotometer. Briefly, 0.25 g sieving powder were carbonization in a small porcelain crucible. During the procedure, the fire extent changed gradually from small fire into big fire. After the samples colour changed to gray, it is moved to horse fell furnace to ashing for 6 h under 500˚C. Taking out the samples after cooling, and add 1 mL of concentrated HCl, as well as washing porcelain crucible for several times using a few dH2O each time. Metered the washing liquid to a 25 mL volumetric flask. After the precipitation appeared, the supernatant was used to measure both K+ and Na+ content. The drying KCl and NaCl were used to draw the standard curve.
2.7. Analysis of Reduced Glutathione (GSH) Content
GSH content was determined by spectrophotometric assays. Briefly, addition 1 mL 5 mM EDTA-TCA to 0.1 g leaf tissues in a 1.5 mL centrifuge tube, which was ground into powder in liquid nitrogen previously. After extracted in ice for several minutes, centrifuged 15 min at 12,000 g. Taking out 0.25 mL supernatant to a new 1.5 mL centrifuge tube, plus 200 mM pH 7.0 phosphate buffer 0.5 mL and DTNB 0.05 mL. After reaction for 5 min in room temperature, the absorbance was measured at 412 nm wavelength.
2.8. Statistical Analysis
Preliminary data analysis was performed with Excel 2003, while significant difference analysis was determined with SPSS 19.0 software. RStudio software (1.0.136) was used to determine the principal component analysis and cluster analysis of the physiological indexes, as well as constructing heat maps. Taking into account the genetic diversity among the varieties, the changing value between the stress treatment and its own control value of each variety was used as the evaluation index, rather than the absolute value of stress treatment.
3. Results
3.1. Genetic Variation of Lycium Physiological Response to Salt Stress
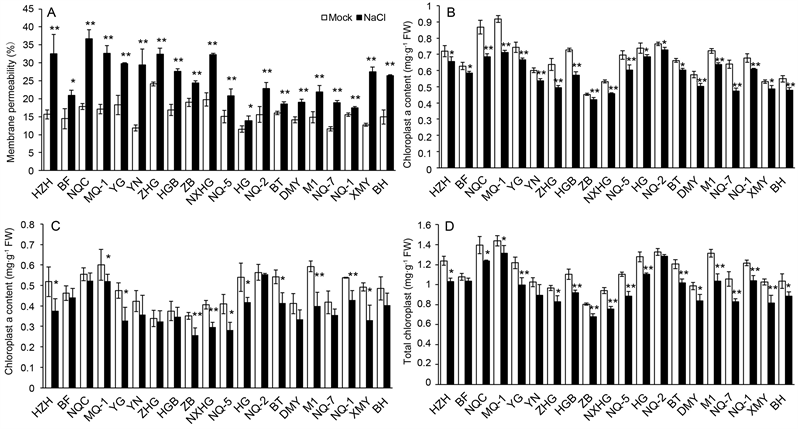
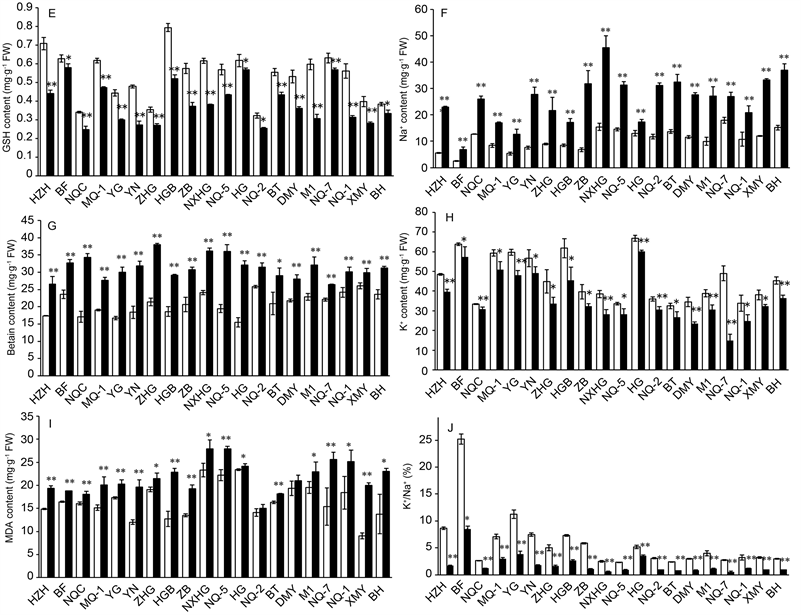
It is shown that compared with their controls value, all of the varieties consistently present an increase in leaf Na+ but a decrease in leaf K+ under salt stress (300 mM NaCl) (Figure 2). Na+ content enhanced at a range of 33.08% - 367.65%, while K+ content declined by a range of 7.48% - 69.73%. As a result, K+/Na+ ratio also decreased at a range of 32.43% - 82.35%. Salt stress enhanced betaine by 14.80% to 107.15%, while decreased chlorophyll a, chlorophyll b, and total chlorophyll from 4.24% to 26.10%, from 1.60% to 32.92%, and from 3.46% to 21.72%, respectively. Salt stress induced an increase of MDA in the range between 3.31% and 120.85%, an increase of the relative permeability of plasma membranes in the range between 13% to 147.88%, but a decrease of GSH by 7.81% to 48.65% compared with their control values. The coefficient of variation (CV) ranged from 16.36% to 88.63% (Table 2).
![]()
Figure 2. Physiological response to salt stress in lycium leaves. Taking into account the genetic diversity among the varieties, the changing value between the stress treatment and its own control value of each variety was used as the data for creating the heatmap, rather than the absolute value of stress treatment. The heatmap was constructed by RStudio software (1.0.136).
![]()
Table 2. Variation of the physiological indexes changes in comparison with their respective control values in lycium leaves under NaCl treatment.
SD: STDEV; CV: STDEV/ mean value; MP, Ca, Cb, Ct, MDA, Bt, K+/Na+ and GSH means membrane relative permeability, chlorophyll a, chlorophyll b, total chlorophyll, betaine K+/Na+ ratio and reduced glutathione, respectively.
It is clear that the changing extent of each of these physiological indexes displays great quantitative variation among Lycium natural accessions or cultivars (Sppl. Figure 1), reflecting the abundant genetic diversity. This characteristic creates a wide selection space for the screening of anti-salt Lycium germplasm resources, and conducting salt resistance basic research as well. Taking into account the genetic diversity among the varieties under normal conditions, the changing value between the stress treatment and its own control value of each variety was used as the evaluation index, rather than the absolute value of stress treatment in the following section. The ecological significance of the observed variation is not clear, however, as the physiological profiles of the accessions selected for this study cannot simply be linked to their geographical dispersion.
3.2. Correlation Analysis among Different Physiological Indexes
The correlation analysis showed that there were different degrees of correlations between those physiological parameters (Figure 3). It is indicated that there was an extremely significant negative correlation between MDA content and GSH content (P < 0.001), a significant negative correlation between Na+ content and K+/Na+ ratio (P < 0.01), and cell membrane relative permeability was significantly negative correlated with GSH (P < 0.05). This indicates that the stress of 300 mM NaCl for 15 d may result in a decrease of GSH and other antioxidant substances, so both increase the degree of membrane lipid peroxidation and the membrane permeability.
Among all the positive correlation, the indexes to reach the extremely significant level (P < 0.001) are between chlorophyll b content and total chlorophyll content, as well as between the total chlorophyll and GSH content, while the correlation between GSH content and K+/Na+ ratio has reached a significant
![]()
Figure 3. Correlation analysis of different physiological indexes. The red colour refers to positive correlation, while the blue colour presents negative correlation. ***means P < 0.001, **means P < 0.01, *means P < 0.05. MP, Ca, Cb, Ct, MDA, Bt, K+/Na+ and GSH represents membrane relative permeability, chlorophyll a, chlorophyll b, total chlorophyll, betaine, K+/Na+ ratio and reduced glutathione, respectively. The significant difference analysis was determined with SPSS 19.0 software.
positive correlation at P < 0.01 level. Between cell membrane relative permeability and MDA, between chlorophyll a and K+ or Na+ content, between the chlorophyll b and K+ or Na+, or GSH content, between total chlorophyll and the content of K+, or K+/Na+, as well as between betaine content and K+/Na+ all present a significant positive correlation at P < 0.05 level. The rest of the correlations between other indicators are not significant. It is clear that the correlation coefficients between different indexes vary greatly, among which GSH, K+/Na+ and total chlorophyll have a significant correlation with more than four of the remaining nine redexes, respectively.
3.3. Principal Component Analysis of Different Physiological Indexes
Consideration of the exsisting correlation between various salt resistant-related physiological indexes, which resulting in the information overlap in a certain extent [24], so translate the original indexes into a less number but more comprehensive indexes and conducting comprehensive analysis (means principal component analysis, PCA), can reasonably and systematically reflect the differences of salt resistance among various wolfberry germplasm. Contribution percentage and eigenvalue are the main basis of principal component (PC) selection. We translate the 10 physiological indexes into 10 new PCs, in which the eigenvalues for the first four principal components PC1, PC2, PC3, and PC4 are 3.169, 2.026, 1.398 and 1.081, respectively (Table 3). Given all of the eigenvalue greater than 1, and the cumulative variance contribution percentage reached 95.36%, shown the first four PCs containing the vast majority of messages, thus can be utilized to evaluate the salt-tolerant strength of Lycium at physiological level. Therefore, in order to achieve the aim of dimensional reduction, the above 10 physiological indexes can be replaced by these four independent PCs. The greater the absolute value of the eigenvector of each PC, the greater the representativeness of the variable.
In PC1, the eigenvector represented by K+/Na+, total chlorophyll content, chlorophyll a content, chlorophyll b content and K+ content were 0.350, 0.342, 0.335, 0.317 and 0.311, respectively, which were positively correlated with PC1. The eigenvector represented by Na+ content, membrane relative permeability, betaine content, malondialdehyde content and GSH content are negatively correlated with PC1. In PC2, the eigenvector of GSH content and betaine content were large, respectively 0.663 and 0.403, which were positively correlated with PC2. The eigenvector of malondialdehyde content was −0.555, which was negatively correlated with PC2. Because the absolute values of the eigenvector of GSH, betaine and malondialdehyde contents in PC2 are large, they together constitute the main factors of the variance variation of PC2. In PC3, the eigenvector represented by K+ content, Na+ content and chlorophyll a content is large, respectively 0.621, 0.492 and 0.447, which are positively correlated with PC3. The indicators, that negatively correlated with PC3, had very small eigenvector
![]()
Table 3. Eigenvalues of the component matrix, correlation matrix and its variance contribution and cumulative variance contribution.
VCP: variance contribution percentage; CCP: cumulative contribution percentage; MP, Ca, Cb, Ct, MDA, Bt, K+/Na+ and GSH means membrane relative permeability, chlorophyll a, chlorophyll b, total chlorophyll, betaine K+/Na+ ratio and reduced glutathione, respectively.
values, so can not enough to represent the main factors of variance variation in PC3. In PC4, the absolute value of the eigenvector represented by chlorophyll b and membrane relative permeability were both greater than 0.5 and negatively correlated with PC4. Given the absolute value of other indicator feature vectors, that positively correlated with PC4, was smaller, they can not enough to represent the main factors of variance variation in PC4.
The score of each PC factor (Table 4) was obtained by using RStudio data processing software, and the ranking was conducted according to the score, which could well reveal the capacity of different Lycium germplasm resistance. According to the different contribution percentage of variance of each PC, the proportion of the totaleigenvalues extracted from the eigenvectors of each PC was taken as the weight in the comprehensive evaluation, and an integrated model function of PC was established that apply to select of anti-salt germplasm resources of Lycium.
where F is the final comprehensive evaluation score of each kind of Lycium. By using this mathematical model, comprehensive evaluation and ranking were conducted on the salt resistance of 20 different Lycium germplasm. As can be seen from Table 3, the germplasm of lycium ranked the top 5 in comprehensive scores were Heiguo, Ningqi No. 2, Beifang, Beitiao and Ningqi No. 1, while the last 5 were Ningqi No. 7, Xiaomaye, Yunnan, Hongzhi and Huangguo.
![]()
Table 4. Scores of the principal components from 20 varieties of wolfberry leaf physiological parameters.
3.4. Clustering Analysis
Twenty Lycium germplasm were analyzed by Rstudio, and they are devided into four types (Figure 4). The type I include Heiguo, Ningqi No. 2 and Beifang, refered to the high-degree salt tolerance; the type III include Zibing, Xiaomaye, Hongzhi and Yunnan, belonging to the sensitive genotype; the type IV only include Ningqi No. 7, belonging to the most sensitive genotype. The remaining varieties belonging to type II, including most of the varieties, refers to mid-resistant varieties.
4. Discussion
Genetic variation among Lycium accessions provides a rich genetic resource for addressing plant function and adaptation to environmental stress [15]. In this study, all of the 20 Lycium varieties increased both Na+ and betaine content, but decreased both K+ content and K+/Na+ ratio under salt treatment compared with their control value, indicating that Lycium evolved a tissue tolerance mechanism to accumulated Na+ (compatible solute synthesis are important processes for tissue tolerance). The other common physiological response is an increase in MDA, and the relative permeability of plasma membranes, while a decrease in chlorophyll a, chlorophyll b, and total chlorophyll. So Lycium also evolved an
![]()
Figure 4. The cluster of the 20 lycium accessions. RStudio software (1.0.136) was used to determine the cluster analysis. The Roman numerals are shown here represent the corresponding varieties as described in Table 1.
osmotic stress tolerance mechanism, just like soil draught-derived stress [30]. Given salinity is a common feature of arid and semiarid lands, Lycium plants have evolved mechanisms to tolerate the low soil water potential caused by salinity, as most glycophytes and halophytes do [3]. Moreover, in consideration of compatible solutes synthesis need cost energy [31], Na+ generally accumulation in leaves, especially in vacuolar, may act as an osmoticum for Lycium plants in acclimation to salt stress. In this case, the synchronously increased betaine concentration accompanying Na+ may act as a compatible solute, to coordinate the increase in the osmotic pressure in the other subcellular compartments to maintain cell volume, due to the concentration of K+ did not increase.
There is both a stomatal and non-stomatal limitation for photosynthesis caused by salt, and the latter has been proposed to originate from excessive accumulation of Na+, Cl− and reactive oxygen species (ROS), and deficiency of K+, inside the cytosol [32]. The content of photosynthetic pigments can well represent photosynthesis capacity, because when photosynthesis is expressed on a unit chlorophyll basis, rather than a leaf basis, a reduction due to salinity can usually be measured [3]. Wu et al. have found that in both wheat and barley, relative chlorophyll content index correlated strongly with the overall plant salinity tolerance (evaluated in glasshouse experiments). It has been shown that there is an intimate relationship between chloroplast function and ion regulation in halophyte plants growing on saline soils [33], in which K+ retention in leaf mesophyll as an element of salinity tissue tolerance [34] [35]. The authors also showed that mesophyll cells in glycophytic species loses 2-6-fold more K+ compared with their halophyte counterparts. This decline was reflected in a reduced maximum photochemical efficiency of photosystem II, chlorophyll content and growth [33]. In addition to reduced K+ efflux, the more tolerant species also exhibited reduced H+ efflux, which is interpreted as an energy-saving strategy allowing more resources to be redirected towards plant growth. The available literature indicates that halophytes can overcome the stomatal limitation by switching to CO2 concentrating mechanisms and increasing the number of chloroplasts per cell under saline conditions. Furthermore, salt entry into the chloroplast stroma may be critical for grana formation and photosystem II activity in halophytes but not in glycophytes. A meta-analysis suggested that the leaf mesophyll cell cytoplasm of halophytes (largely occupied by chloroplasts) contains 100 - 200 mM NaCl [6], and isolated halophyte chloroplasts exposed to high salt (100 mM NaCl) and low K (50 mM KCl) were better able to maintain photosynthesis than glycophyte chloroplasts [35]. In the present work, we have found that there exists a significant positive relationship between K+ content and chlorophyll a or total chlorophyll content, and between K+/Na+ ratio and chlorophyll b or total chlorophyll content, respectively, in lycium leaves following NaCl treatment.
It has been shown that ROS signaling plays a key role in salt response, together with essential Na+ transport systems [4] [36]. The increasing level of ROS in a green tissue under saline conditions results from the impairment of the photosynthetic apparatus and a limited capability for CO2 assimilation in a conjunction with plant’s inability to fully utilize light captured by photosynthetic pigments [10]. The Salt Overly Sensitive (SOS) signaling pathway can be regulated by ROS signaling, ex. SOS1 mRNA stability is mediated by oxidative stress [37], SOS2 interacted both with CAT2 (CATALASE 2) and CAT3, indicating SOS2 is a key node linking H2O2 signaling and salt response [38]. The expression of genes involved in ROS metabolism is upregulated in stele and phloem tissue, the findings of Jiang et al. [36] are consistent with a previous report that ROS are involved in the regulation of xylem-sap Na+ concentrations. It has been shown recently that H2O2-induced root Ca2+ and K+ fluxes correlate with salt tolerance in both barley and wheat [39]. The excessive ROS leads to the activation of a broad range of ion channels including Na+-permeable non-selective cation channels (NSCCs) and outward rectifying efflux K+ channels (GORK), thus results in a disequilibrium of the cytosolic ions pools and a perturbation of cell metabolic processes. Niu et al. [40] found that pumpkin-grafted cucumber plants increase their salt tolerance via a mechanism involving the root-sourced respiratory burst oxidase homologue-dependent H2O2 production, which enhances Na+ exclusion from the root and promotes an early stomatal closure. In the present study, an increase in MDA and the relative permeability of plasma membranes, but a concurrently decrease in GSH, may imply that salt stress exerted a ROS burst in all of the 20 different Lycium varieties. As a result, ROS acts as a second signaling molecular, may be mediated not only Na+ transport and accumulation in Lycium leaves, but also the whole plant response [21]. As a traditional Chinese medical plant, the capacity of ROS scavenging may be determined Lycium plants antioxidant ability, at last their health-care and medical function [13]. In this case, the varieties that bare a relatively lower MDA and relative permeability of plasma membranes, but a relatively higher GSH have a great salt tolerance capacity.
Germplasm resource evaluation has been carried out on the majority of fruit tree species, especially with respect to the study of fruit traits [41]. Up to now, there are many studies on the comprehensive evaluation of fruit quality traits of Lycium, but due to the challenges in controlled seedling growth and accurate treatment, studies on evaluation of germplasm resources in response to abiotic stress have been relatively scarce [29]. It is well known that the principal component analysis can demonstrate the effect of each factor in form of diversity. Through principal component analysis and targeted selection of indicators according to different breeding purposes, can not only avoids resource waste but also speeds up the breeding process, and thus has been widely used in various plants. Based on the comprehensive evaluation that combining principal component analysis with cluster analysis, the order of the salt tolerance of 20 Lycium accessions was obtained, in which Heiguo and Ningqi No. 7 localized at the two terminals. The comprehensive characters of different varieties obtained in this study are basically consistent with the actual performance of these varieties in natural habitats or fields. According to a recent study conducted in leaves of two main cereals wheat and barley by Wu et al. [42], our assay for evaluating salinity tolerance in Lycium plants is feasible. In the future, with the genome sequence of Lycium published, genome-wide association analysis will be conducted to isolate salt tolerance loci, which will greatly advance the salt resistance breeding process of Lycium plants.
In conclusion, our work reveals a large genetic variation in physiological profiles in Lycium leaves in response to salt stress. An effective comprehensive evaluation method for the salinity tolerance of Lycium plants was established from the physiological aspects (including branches cutting and NaCl treatment), which provides a reference for the basic research of the molecular mechanisms of Lycium plants in response to salt stress in the future, and also providing valuable guidance for the improvement of saline-alkali land and the rational utilization of Lycium germplasm resources. By describing a significant genetic variation of salt response, this work fulfills a prerequisite for future quantitative genetics analyses of this trait.
Acknowledgements
This work was jointly supported by the Project of Agricultural Breeding of New Wolfberry Varieties in Ningxia (2013NYYZ0101), the Project of Technology and Corporation of Ningxia Academy of Agriculture and Forestry Sciences (DW-X-2018014), and the Self-option and Foundation of Ningxia Academy of Agriculture and Forestry Sciences (NKYJ-18-16).
Contributions
ZM, WA and YZ designed the research. PX and YY performed experiments. PX conducted data analysis. YY conducted greenhouse work. ZM and PX wrote the manuscript.
Appendix