Portraying and Analysing Urban Shrinkage in Greek Cities—The Case of Larissa ()
1. Introduction
Urban shrinkage is a phenomenon that can encompass regions, cities, towns, or sections of metropolitan areas that are experiencing dramatic reductions in their economic and social base as well as their entire population ( Gospodini, 2012), ( Pallagst et al., 2013). In the case of Greek cities, the spatial impacts caused by the economic crisis of public debt (2009-) are particularly important since Greek cities had never in the past been experiencing urban shrinkage. New conditions of shrinkage produce spatial entities of obsoleteness, usually characterized by the term “non-productive space” ( Newman & Kim, 2017), while simultaneously making obsolete the roles that residents once had in them ( Gospodini, 2006). On the other hand, these abandoned structures can potentially be reclaimed, based on their probable use, as “micro-clusters” ( Capdevila, 2014) promoting local circulation of information and knowledge, and social enhancement ( Tranel & Handlin, 2006) or “natural nodes of a green city network” ( Frazier & Bagchi-Sen, 2015). In the broadest sense, these abandoned structures, “land use alternation patterns” ( Lee et al., 2018), may provide a particularly fertile ground to streamline the overall quality of the surrounding built environment.
For the purpose of this study, across the full spectrum of non-productive spaces, the concept is getting anchored in vacant commercial properties. Even though in Greece retail trade is the key pillar of the porosity of the urban tissue ( Gospodini, 2012), the ground reality is stark. Commercial vacancies retain the stigma of economic crisis and remain unhelped by municipal and governmental apathy amid the broader neglect of small enterprises. Interestingly, these empty lots can reflect upon the municipal policy challenges on the way to a sustainable urban economic environment and promoting neighborhood live ability ( Manika & Gospodini, 2016).
Even though conceptualizing urban shrinkage is not “uncharted territory”, we realized the pressing need to dig deeper into the spatial impacts of commercial vacancies and provide actual numbers and real patterns. As a first step, we incorporate “firmography” ( Maoh & Kanaroglou, 2013) principals and methods. Hence, we adopt a conceptual reflection of crude rates, basic demographic equations, to the studying of firms’ cycles of activation and obsolescence. In the second step, that is benefitted from the first, we shed light on a dynamically over time portraying of the spatial distribution of commercial vacancies, via spatial statistic methods. More specifically, kernel density was adapted to estimate and contributing to analyzing plot spatial patterns. In the last step, we endeavor to decipher changes in the place of residence of economically sound firms during the period considered. This mobility of economically sound firms within the urban fabric is the emblem of our concept put into practice.
2. Literature Review
As documented in recent history, the causes of urban shrinkage may vary but can be grouped as follows:
· Suburbanization leading to degradation of inner-city areas (see Lever, 1993), ( Nuissl & Rink, 2005), ( Couch et al., 2005);
· Economic Transformations in the industrial sector, as witnessed in European and US cities in the 80s (see ( Gospodini, 2012), ( Haase et al., 2012));
· Economic restructuring and its underlying potentials, as happened in East European countries in the 90s (see Pallagst et al., 2009);
· Demographic reasons in developed regions, and processes for settling economic and political immigrants ( Mykhnenko & Turok, 2008);
· Climate change, environmental disasters or radical changes in the political and administrative system (see Großmann et al., 2013);
· Potential Economic crises due to forces of globalization and other structural causes of the effects of various macro-process interactions at the local level ( Gospodini, 2012), ( Moss, 2008), ( Pallagst et al., 2009).
Types of non-productive spaces, viewed as the first spatial signs of urban shrinkage, can be categorized related to their origins into:
· vacant built residential volume ( Rieniets, 2009), ( Bontje, 2004);
· offices and shops “dropping to pieces and vacant” (as Frederick Law Olmsted quoted), ( Haase et al., 2016), ( Gospodini, 2012);
· urban brownfields or abandoned railway sites ( Haase et al., 2016);
· unused or underutilized open spaces ( Saraiva et al., 2017);
· (massive) spaces followed by perforation and demolition ( Cunningham-Sabot & Fol, 2007).
In urban planning terms, non-productive spaces’ impact reflecting on the shocks of building dereliction to the sense of local community and the vitality of neighborhoods. In inner-city areas of Greek cities, a chain of vacant shops, offices, and houses can be observed in the former lively commercial streets ( Gospodini, 2012). Much has been written about vacant commercial properties and their study is intertwined with many different definitions. As an illustration, the most common definitions and approaches can be incorporated in “firmography” ( Maoh & Kanaroglou, 2013), ( Mejia-Dorantes & Martín-Ramos, 2013), “demography of the firms” ( Giannetti & Velucchi, 2006), ( Wissen, 2005) or “business demography” ( Markowicz, 2014). Key pillars of the linkages between them are “Retail Location Theory” ( Brown, 1993) or theories based on “the mobility of firms” ( Mejia-Dorantes & Martín-Ramos, 2013), ( Froment, 2015).
It is argued that a firm’s decision to locate or relocate anchored from certain economic criteria to maximize profits and select an attractive or affordable area. Studying locating and movement of firms, in parallel with the potential contributions of the resulting abandoned structures has a recent manifestation of urban shrinkage, can draw on for new ideas on analyzing this phenomenon.
3. Characteristics of Study Area
Many Greek cities can be described as shrinking since the 2011 financial crisis, affecting their economic and social well-being by the emergence of vacant commercial spaces ( Manika, 2018). The city of Larissa is typical such a case, due to four significant characteristics:
1) The first concerns the morphological pattern of the city. More specifically the urban fabric of Larissa is characterized by the typical morphology (streets, squares, city blocks) of modern Greek cities, the result of post-war housing development patterns in Greece;
2) Its median population size for a permanent population equal to 145,000 according to the 2011 census, a city that represents the largest group of Greek cities except for Athens, Thessaloniki and Piraeus;
3) The lack of a specific economic identity like for instance tourism Greek cities;
4) Larissa is a typical Greek city in terms of shrinking signs—exhibiting thousands of closing enterprises, series of vacant shops in previously high commercial streets, office buildings abandoned, even whole areas abandoned, and a dramatic decline in building activity. At the same time, in line with all Greek cities, Larissa exhibits spatial rearrangements of the population; relocation of households in other neighborhoods in search of lower living costs ( Gospodini, 2012).
4. Methodology and Data
In view of the fact that this paper has a quantitative and exploratory nature, we show analytically changes in economic activity of the study area, by sector and by year. This analysis is prompted and benefited from firmography approach. Hence, as a first step, we apply crude mortality and birth rates. The crude mortality rate is used for the businesses that closed the year of examination and the crude birth rate for the businesses that opened the year of examination and given by the following equations based on Eurostat Statistics explained platforms (https://ec.europa.eu/):
(1)
(2)
The concept is that crude rates capture the voice and presence of the emerging economic transformation of the city. This paper endeavors to foster effective and fruitful regeneration policies for shrinking areas. Thus, we make efforts to overcome the leaky pipeline of studying economic sectors only as an entity. Hence, in some cases, the emphasis is shifting to distinguish specific sectors of commercial activity based on their contribution to the vibrancy of the urban landscape and their role in the economic identity of the city ( Long & Huang, 2017), ( Mehta, 2007).
The second step in our analysis is a spatial statistic approach based on kernel density. Kernel density allows the analysis of point events by utilizing their spatial concentration in a two-dimensional form ( Zhao et al., 2017). The output area shows the intensity of events as a function of their density in the geographical area ( Adolphson, 2010), ( Srinurak et al., 2016). The method was applied based on existing businesses, as point data, for all sectors for the years 2008 to 2014. The raster datasets produced were sorted in such a way that the differentiation between the classes is noticeable in each case. The selection of the bandwidth was based on the amount of information and detail needed. Therefore, the spatial shrinkage of the economic activities of the study area and the reduction of their spatial intensity are observed.
The next step, for the accurately retracing of urban shrinkage, is to analyze the mobility of firms. It was necessary to group the city streets into specific categories, based on 1) the current General Urban Planning of Larissa and 2) the commercial density of streets. The index used ( Manika, 2018) applied per segment of each axis between nodes is expressed by the formula:
(3)
The data used comes from (a) the Greek Ministry of Finance, (b) the Chamber of Commerce, Larissa. The data, due to the complexity of the urban shrinkage phenomenon, present topological variability (i.e. point, linear, polygonal data). The commercial activity data relates to businesses operating in Larissa during the period 01/01/2008 to 31/12/2014 (either every month of this period or only for a month). 2008 was used as the starting point for the survey as it was a year when the effects of the economic crisis were not yet visible in the city’s commercial landscape. So this year’s picture can be the basis of time-tracking and comparison. From the primary data set were selected businesses that (a) operate within the city and (b) belong to the private sector and have a specific legal status (individual, public limited, limited partnership, private equity). 2014 represents the end of the first phase of the shrinkage phenomenon in Greek cities ( Manika, 2018).
The categorization of land use data was based on NACE Rev. 1 “Statistical Classification of Economic Activities in the European Community” in force since 2008. The two commercial databases are complementary to each other. That is when the information at road-level is sufficient the data of the Ministry of Finance is used and when the point information is needed the Chamber of Commerce database is used since the Ministry could not provide such data. At the same time, data from the Ministry of Finance’s database were used, where possible, to assess the validity of the Chamber of Commerce data before it was used. The database created the appropriate digital backgrounds (road axis and city blocks) and point databases. The procedure followed was that of geocoding, whereby the desired cartographic information was produced using information describing sites such as postal addresses and an address locator. Through this process, most of the businesses immediately acquired spatial reporting. Other businesses were manually matched with the help of location programs (such as Google Maps and Google Earth).
5. Surveying and Documenting Economic and Spatial Shrinkage
The city of Larissa in the period under study is facing a plethora of economic transformations. These transformations concern reductions in 1) the average annual taxable income of natural persons and 2) the total commercial activities of Larissa. Subsequently, based on the available data and the principles of business demography, 1) the city’s economic identity and 2) its gradual transformation through the spatial analysis of its economic activities were mapped.
5.1. Economic Shrinkage
To better analyze changes in economic activity, by sector and by year, we use crude mortality and birth rates, based on the principles of business demography. Therefore, the crude mortality rate is used for the businesses that closed the year of examination and the crude birth rate for the businesses that opened the year of examination.
For the purpose of this study, specific sectors of commercial activity were distinguished based on their contribution to the vibrancy of the urban landscape and their role in the economic identity of the city ( Mehta, 2007), ( Long and Huang, 2017). These sectors are presented in detail in the graphs below.
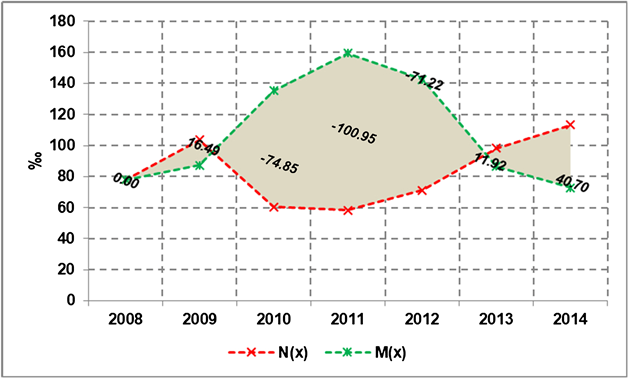
The graphs visualize the percentage change of each sector during the examined period. In particular, the red and green lines represent the crude mortality rate and the crude birth rate respectively. The difference between the two lines shows their variance. The y-axis of the diagram shows the percentage changes and the x-axis is the examined years. The variation of percentage change rates per year corresponds to the exact number of differences, as they appear between the two lines. The evolution of the below graphs is important as it provides a detailed overview of the percentage changes in the various sectors during the relevant years under examination.
Specifically for the manufacturing sector, according to Graph 1, there is a continuous decrease in the number of businesses throughout the period considered. The first significant decline is in 2009. The rate of decline was slightly better in 2010 but since 2011 and for the next two years the industry is experiencing a particularly high peak in 2013. 2014 is an attempt to offset this negative picture. These percentages are particularly affecting the business sector of the economy as manufacturing activity maintains a large number of “satellite” businesses and professions. Finally, it has been observed that sustainable economic
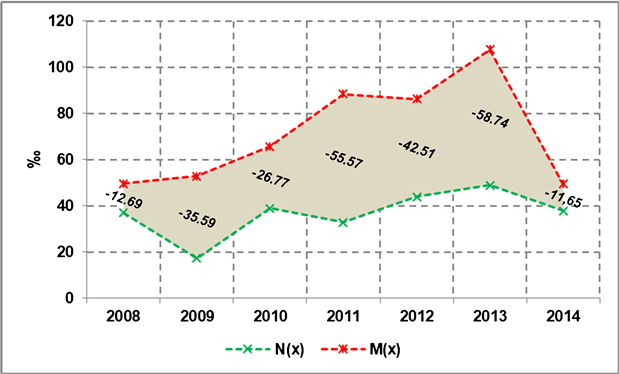
Graph 1. Manufacturing sector (Source: Greek Ministry of Finance (own processing)).
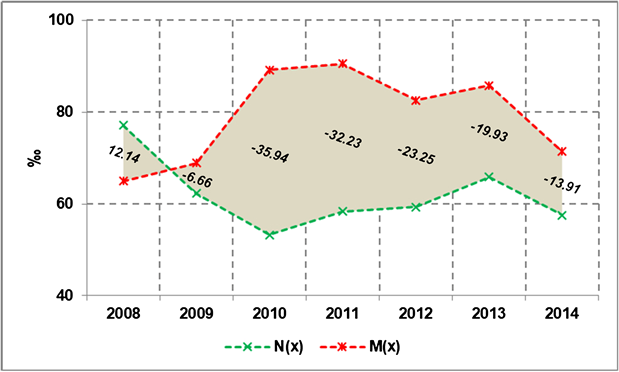
Graph 2. Wholesale and retail trade; repair of motor vehicles, motorcycles and personal and household goods (Source: Greek Ministry of Finance (own processing)).
growth and macroeconomic stability conditions are achieved where the economy has transformed and upgraded the manufacturing system of this sector ( Kitson and Michie, 1997), ( Pitelis and Antonakis, 2003).
Regarding the wholesale and retail trade, as shown in Graph 2, there was a relative increase in business in 2008 alone, with a downward trend in 2010 from a peak in 2010. The decline is mainly due to small businesses, which are also the largest proportion of Larissa’s businesses, with significant impacts on the economic and social life of the city, as they stimulate the local community, bringing the smaller streets to life by restraining the social fabric and creating new employment opportunities.
The declining trend of the wholesaler and retail industry, throughout its business cumulatively, despite moving at high levels, seems to be gradually being controlled over time. Responsible for this can be the resilient forces of the industry that are attributed to relative stability by one of the wholesale trade and the other by specific subcategories of retailing. More resilient, that is, firms with a lower sales decline, are the categories of essentials (food retailers and supermarkets) as opposed to those of market durable consumer goods (home appliances).
The accommodation and catering industry, according to Graph 3, is particularly resilient over the period considered. As this sector in the case of Larissa mainly consists of catering services, its growth in specific years since 2012 and after which the financial crisis is strongly visible in all businesses in the city, can be attributed to the fact that businesses of this type do not require a large start-up capital while their operation is aimed at achieving fast and opportunistic profit ( McFarland and McConnell, 2013), ( Laniyonu 2017). At the same time, it is an industry that caters to specific consumer needs with cafeterias functioning as places of gathering and socializing, significantly replacing public spaces. The rise of the “coffee industry” is not only a phenomenon in Larissa, nor even just Greece. It is an image that is found in many European and American states, with Europeans finding coffee in the various cafes an affordable part of their daily lives and Americans a luxury they can afford in times of crisis, a time in which they have restricted their needs in other categories of retail ( Laniyonu, 2017), ( Papachristos, Smith et al. 2011). The arts, entertainment and, recreation industry, following its first year of growth, shows a relative balance, with its downward trend in the coming years. In 2014, however, new start-ups in this sector are more than the write-offs, as shown in Graph 4, so the future of the industry in the city of Larissa is promising.
The education sector is characterized by strong fluctuations in its examination period. From the stability of its population in 2008 and its small increase in 2009, it is facing a period of significant decline, as shown in Graph 5, as residents’ income reductions have a direct impact on their education or willingness
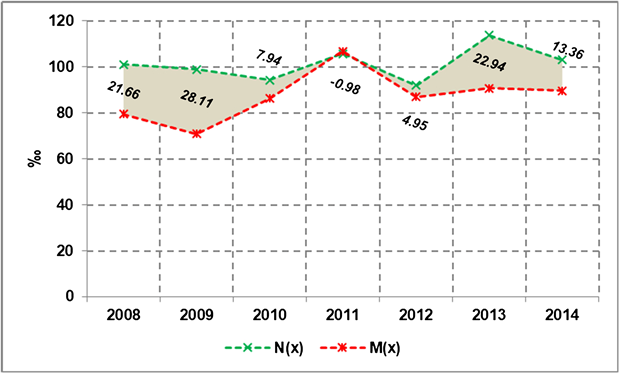
Graph 3. Hotels and restaurants services (Source: Greek Ministry of Finance (own processing)).
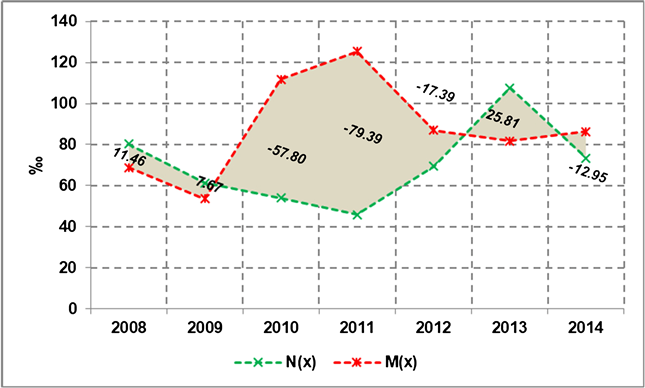
Graph 4. Arts and entertainment activities (Source: Greek Ministry of Finance (own processing)).
to provide private education for their children. The situation has been reversed since 2013, when new start-ups, following the incentives of the various National Strategic Reference Framework programs in the corresponding period, outnumber its write-offs.
The construction industry has been a mainstay of the city’s economy for some time, corresponding to what is still the case in Greek reality, as a significant part of its workforce was employed directly or indirectly by its occupations. From Graph 6, we observe significant growth of the sector in 2008, the last year of its upward trend which followed the development of private building activity and the prospects created by the companies of the construction sector in the National Strategic Reference Framework (NSRF) programs project assignments of the period 2007-2013. Since 2009, the sector’s performance has been strongly declining, culminating in 2011.
In an attempt to analyze the course of the industry, its two categories must be considered separately. In the case of the private sector, this decline may be explained
Graph 5. Education (Source: Greek Ministry of Finance (own processing)).
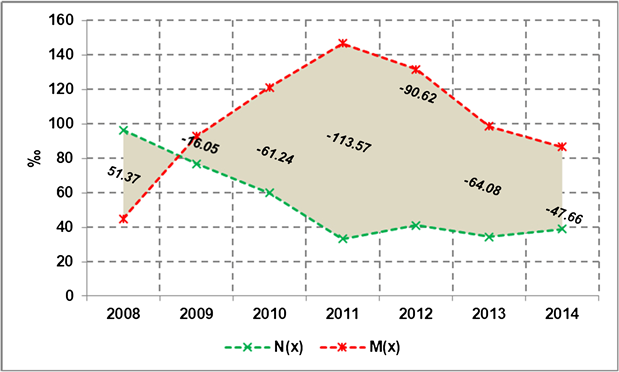
Graph 6. Construction (Source: Greek Ministry of Finance (own processing)).
by the significant increase in construction materials prices and construction costs, the decline in mortgage lending and the large surplus of new unsold buildings dominating the city real estate market as a result of the strong building development of previous years ( Manika, 2018).
Similarly, in the case of the sector focusing on public works, its downward trend is primarily explained by the reduction of funding opportunities provided by the Community Support Framework for the regions of Greece and the resulting reduction in public works auctions. Another important factor, are the discounts of over 40% (on average) given to public works in a desperate survival effort of the companies and the opportunity is given to the large contractors during the period under consideration, who enjoy the advantage of access to banking financing due to their good creditworthiness to participate in large-scale projects. This possibility deprived the possibility of survival by the medium and small size contracting companies that dominate Larissa.
It is thus observed that the city’s economic base is declining while at the same time facing severe transformations. The country’s economic uncertainty during the study period could not leave the city’s economic activity unaffected. In conclusion, it can be said that reductions in sectors such as construction and wholesale and retail are directly related to the disposable income and purchasing power of citizens and industries such as education, the arts, entertainment and recreation that tend to identify with a relative sense of luxury so they are the first hit. On the contrary, there is an increase in the complementary economic activities of citizens (insurers, brokers) and in private sector initiatives that are coming to fill the gaps in the public sector in areas such as health in times of economic downturn and in areas such as focusing on specific issues of consumer habits.
5.2. Spatial Shrinkage
The abandonment of a city’s residences or businesses, whether it be the departure of a small number of people or large populations, does not reduce the physical dimension of the city as abandoned shells remain. However, it creates a perforation of vacant urban spaces, in terms of the vitality of the areas, where the unused shells, vacant shops or houses, are gathered ( Hollander, Hartt et al., 2018).
Up to this point, “static” (not spatial) statistical analysis over time confirmed the decline of the city’s economic base and the strong economic transformations of this period. However, to analyze the phenomenon of urban shrinkage, it is necessary to refer to businesses spatially, to examine their patterns and distributions.
The method was applied based on existing businesses, as point data, for all sectors for the years 2008 to 2014. The raster datasets produced were sorted in such a way that the differentiation between the classes is noticeable in each case. Therefore, the spatial shrinkage of the economic activities of the city of Larissa and the reduction of their spatial intensity are observed. More specifically, based on Map 1, the year 2008, we can distinguish:
1) An area of increased intensity of existing businesses, consisting of the urban units of Agios Achilles and parts of Agios Nikolaos and Agios Konstantinos;
2) An area of considerable intensity of existing businesses in parts of the urban units of Agios Nikolaos, Agios Konstantinos, Agios Athanassios and Agioi Saranda;
3) Areas of considerable but lower intensity at the boundaries of the urban units of Agios Achilles with that of Ampelokipi, at the boundaries of Agios Achilles and Agioi Saranda, and the sectors of Agios Athanassios and Philipoupoli;
4) Areas of low intensity located on principal roads or squares.
Over the years, however, as shown in Map 1, the picture in 2008 has changed markedly. Significant variations are observed during the period between 2008 and 2014. Map 1 presents the applications of kernel density in 2008, 2010, 2012, and 2014. These years are selected as they highlight the following three important study parameters: 1) the reduction of the intense of the spatial pattern of economic activities in total, 2) its spatial shrinkage, and 3) the elimination of its
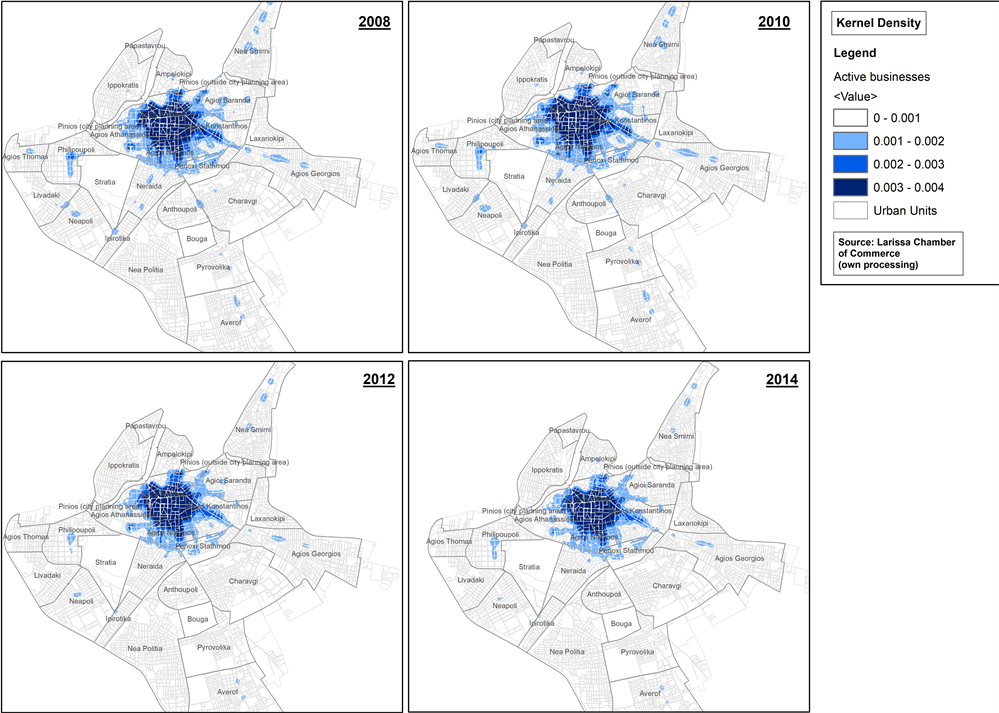
Map 1. Application of kernel density (2008-2014).
strong local hotspots in the respective neighborhoods.
More specifically:
1) The area of increased intensity is gradually shrinking;
2) In the same context and area of significant intensity, it gradually loses a large proportion of its area and acquires a more perforated urban vacancy;
3) Of the significant intensity areas identified in 2008, most are lost over time. Excluding cases of Agios Achilles and those found in the areas of Agios Athanassios and Philipoupoli which are maintained but with reduced intensity. Of course, during the examination period some areas of significant intensity were created as a result of the spatial reduction of areas of increased and significant intensity of existing businesses or as residual imprints of their larger extent. These areas, an attempt by economically viable businesses to remain active in the area, were not sustainable over time as most of them were maintained for only one or two years;
4) Areas of low intensity on principal roads or squares are weakened and gradually lost.
So the economic crisis seems to have a decisive impact on the spatial footprint of all businesses, either by shrinking the areas of greater intensity or by weakening or even eradicating low-intensity areas.
The application of kernel density confirmed the spatial shrinkage of the economic activities of the city of Larissa through changes in business concentrations and their intensity. However, to identify areas that show similar temporal changes in the number of businesses that assemble and the spatial patterns of concentration of businesses that close, the spatial patterns of the business change over time was shown, for the period 2008-2014 (Map 2).
The percentage change in business activity is characterized by a slight and moderate decline, high-decline in city blocks is limited. So the images found are two. The first concerns the area contained the traditional center and is characterized by a mosaic of city blocks that exhibit a variety of variations between medium percentages, low and zero.
The second image concerns the less central districts dominated by city blocks with strong negative changes as well as low increases in business activity. That is to say, several areas of negative change are observed, as well as two areas of positive change in the urban units of Philipoupoli and Neraida (Map 2). Negative change areas have been identified since 2008 and become more intense and larger over time, as do their neighboring city blocks. These changes involve business write-offs, relocations, or even changes in their business. The latter is identified by the variations of changes per city block of individual sectors and the creation of write-off areas and new registrations.
5.3. Movements per Axis
Particularly important for the study of the spatial dimension of urban shrinkage is the examination of changes in the place of residence of economically sound
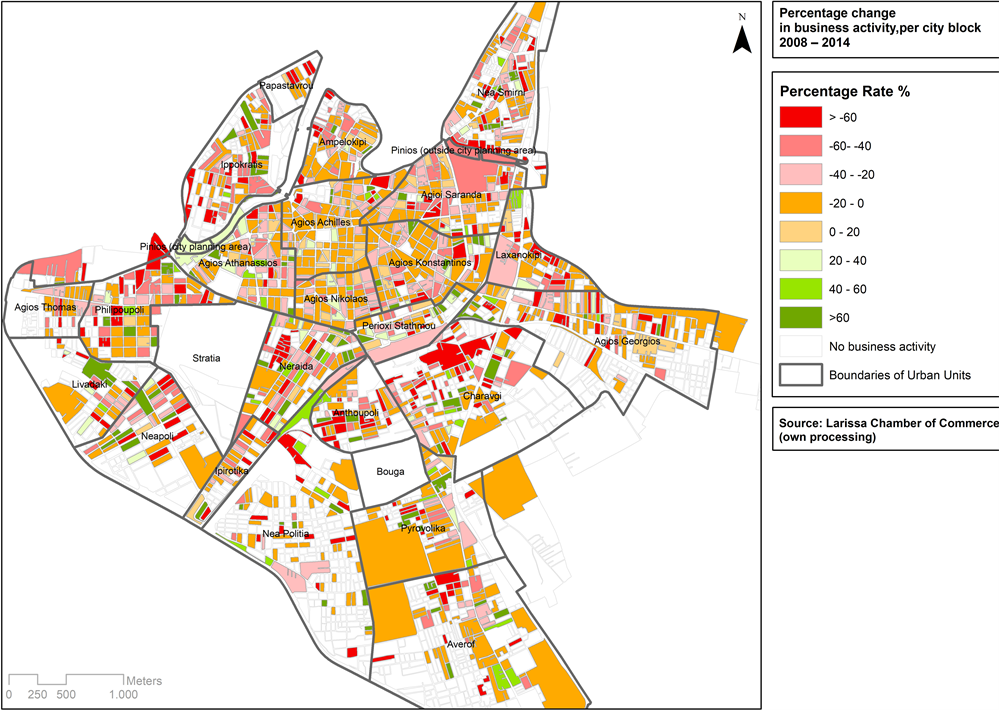
Map 2. Percentage change in business activity, per city block (2008-2014).
businesses during the period considered. The data used were those of the Ministry of Finance and provide information on the place of business of the company at the start and the year of its establishment, its location at the time of its last movement, and the year of business, respectively.
To analyze the movements, it was necessary to group the city streets into seven categories, as shown in Map 3. In particular, categories K1, K2, K3 include the roads belonging to the respective K1, K2, K3 central reception areas of the current General Urban Planning of Larissa and Category A roads which are following the same G.U.P. (General Urban Plan) belong to areas of pure residence. Category Π includes Larissa-Athens, Larissa-Thessaloniki ring roads, Trikala-Karditsa ring road, and Konstantinou Karamanlis Avenue which although part of the ring road due to the city’s diffusion, has now lost its basic features. The last section of the ring in the northeast of the city has been auctioned but has not yet begun construction. Finally, category E1 includes roads “exits” of the city and especially parts of these roads within the city limits, and similarly to E2 the sections that are continuations of parts of the previous category that extend outside the city limits.
As there are cases of roads crossing more than one of the former areas of G.U.P. Map 3 was used to allow them to be assigned to only one of the categories under consideration. The category that comprises the bulk of the concentration of the commercial activities of each street based on the previous map thus constituted the dominant characterization of that street. The data from the Larissa Chamber of Commerce was used for the map as they provide information on the exact business address at the beginning of the year. The index used (street commerciality index or commercial density of a street ( Browning et al., 2010), as described in the methodology and data, and applied (Map 4) per segment of each axis between nodes is expressed by the formula:
(3)
As for all businesses, it can be seen from Table 1 that the study period, 2008 to 2014, was dominated by two movement flows of financially sound businesses.
1) The first and largest in the population of the flow (50.54% of total traffic, 1212 movements in total 2398) relates to movement originating in Category A roads. The largest in the population of this flow (58.66% of this traffic, 711 movements in total 1212) relates to movement originating in Category A roads and destination roads of the same category, which is, traveling along the same
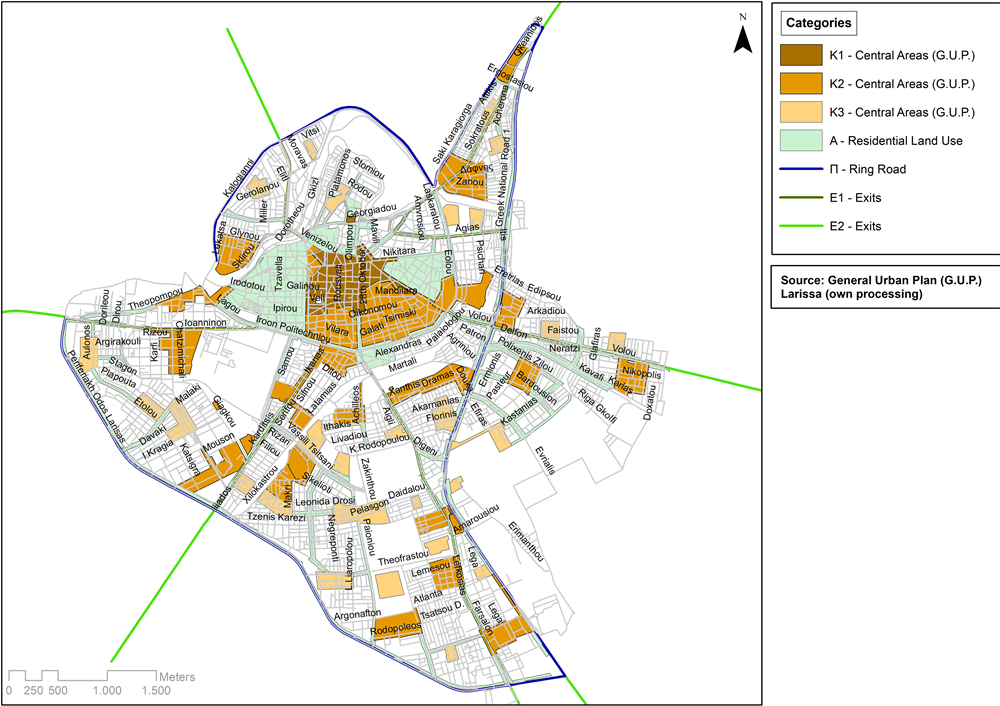
Map 3. Street categorization.
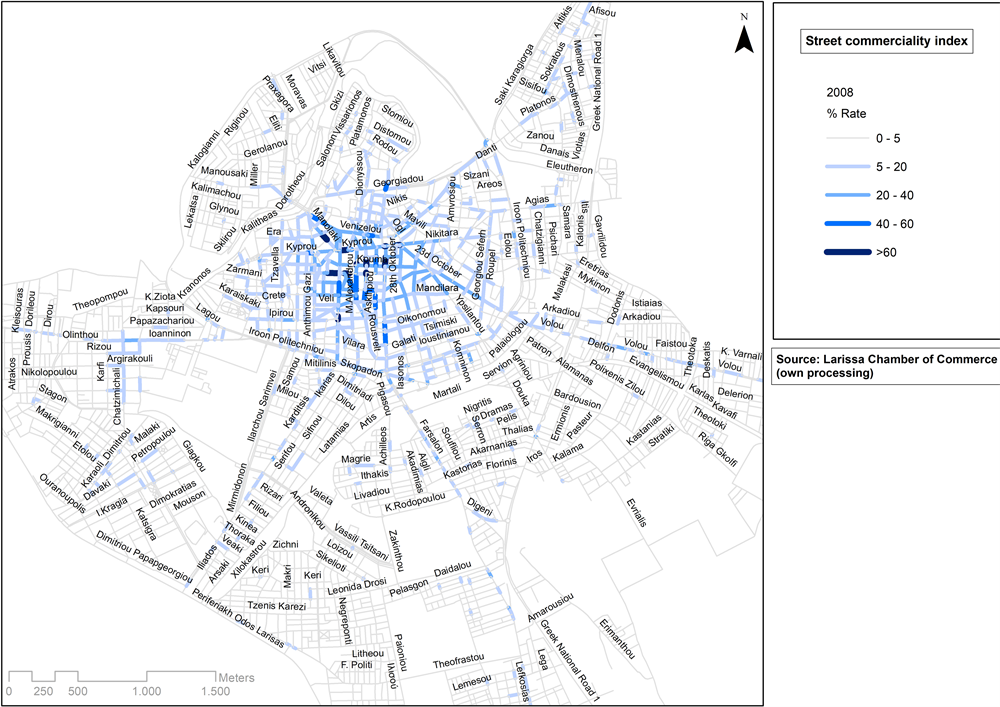
Map 4. Application of street commerciality index (2008).
![]()
Table 1. Movement flows of financially sound businesses, 2008-2014.
Source: Greek Ministry of Finance (own processing).
road or on roads, starting points, and destination, same commerciality. This can be interpreted on the one hand as most businesses when relocating do not want to move away from the original headquarters of their activities to maintain their customer base, and on the other hand that the majority of the roads belong to this category. A small proportion of the traffic also originating in Category A-roads was in the direction of K1 and K2 and K3 roads. That is to say, starting with Category A roads, shifts to more central and more commercial roads are likely to follow the fall in rental prices in the central districts.
2) The second major flow concerns the movement of businesses from category K1 to roads of the same category or roads of category A.
These movements can be accomplished in two ways. Whether they concern:
a) Arc movements on Category A-roads adjacent to Category K1. That is, businesses that chose to move very shortly from their original location and intended for the same centralized streets but perhaps more favorable positions (e.g. corner shops or larger stores) to maintain and possibly increase their clientele.
b) Relocations to less centralized business units for businesses based on floors rather than ground floor stores, so they are not interested in increasing their clientele from the point of view of the store or its location. Instead, they prefer locations in areas with increased parking availability or lower rental properties.
At the same time, some small flows of business traffic are also identified from the K2 and K3 roads in almost identical ways to the source category or Category A roads.
Finally, it can be seen in Graph 7 that most of the flows made during the study period involved businesses are mostly young, under 5 years old, to gain their market share in the city. More specifically, more than 35.5% of these businesses are up to 5 years old while 15% of them are up to 1 year old until their move.
In conclusion, therefore, businesses’ flows during the study period can be grouped into two categories:
a) Movement from Category A roads to roads of the same category or a lesser
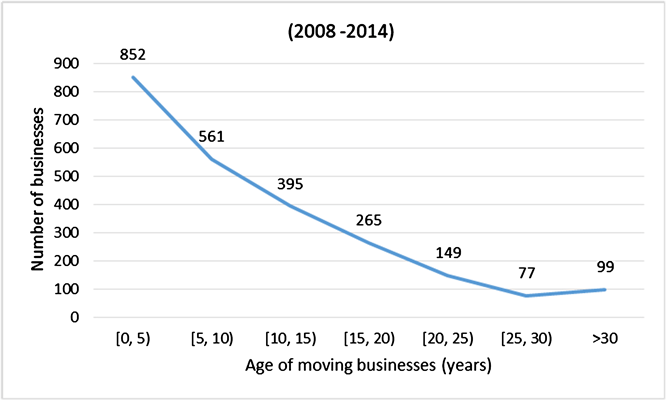
Graph 7. Age of moving businesses, Source: Greek Ministry of Finance (own processing).
extent on the main roads of categories K1 and K2.
b) Movement from central roads (K1, K2) mainly on roads of the same category and to a lesser extent on A roads.
Moving businesses are mostly young, under 5 years old, in an effort to gain as strong as possible a good market position. Finally, the role of the price of renting business in a decision to move to a financially sound business is decisive, as it is one of the biggest overheads of the business and affects its financial prospects.
6. Results
The implication of the aforementioned triangle methodological framework shows that the economic base of the city of Larissa is shrinking while it is undergoing intense transformations. The economic uncertainty of the country in the time of crisis could not leave the economic activity of the city unaffected. Reductions in sectors such as construction and wholesale and retail which are directly related to the disposable income and purchasing power of citizens are the first to be affected. Industries such as education, the arts, entertainment, and recreation tending to be identified with a relative sense of luxury also suffered from the crisis.
On the other hand, there is an increase in the complementary economic activities of citizens (insurers, brokers) and in private sector initiatives that are coming to fill public-sector gaps in sectors such as health during times of economic downturn, or in the focus-related sector of specific consumer habits.
The application of kernel density showed the geo-economic trends of the economic shrinkage in Larissa. Vacant commercial lots, as a function of their location, had a decisive influence on the spatial footprint of Larissa’s economic base. In the period of crisis, this spatial footprint reduced its size, and its main form converted from solid and compact to perforated and fragmented. The resulting empty lots determinant the non-productive areas which behavior as contemporary urban shrapnels sprawled disproportionately within the fabric. Low commerciality areas in Larissa operated as “magnet” of urban shrinkage and tend to overcome the difficulty the threshold of viability in social and economic terms.
We can identify two main trends of the urban shrinkage in Larissa. On one hand, the urban shrinkage is identified through the creation of the spatial perforation form and the parallel intensity reduction of high-commerciality areas. On the other hand, urban shrinkage is observed through the weakening or even elimination of low-commerciality areas. It was immediately obvious that the highest percentage of the declining amount of businesses concentrated in low-commerciality areas. These transformations can be interpreted not only by business write-offs but also by movements of economically sound businesses during the study period. We observed significant flows of movement especially of new businesses (less than 5 years) from less to more central axis or more privileged positions.
The empirical part narrated here underlies the assumption that hotspots of spatial and economic shrinkage signs at the city level are firstly recognized in smaller, low commercial streets, perpendicular or parallel to the traditional high-streets and the ring road. These areas need to receive added scrutiny by local governments and seems to be the ideal locus for spatially located policies with benefit proliferating at social and economic scale.
Hotspots of spatial and economic shrinkage signs in Larissa’s traditional downtown area are limited because movements of economically sound businesses fill again the vacant lots, reducing their vacancy duration. It became obvious that a shift of public realm from central to low commerciality areas is needed.
7. Conclusion
Non-productive commercial lots, the catalyst for a negative domino effect, are a crucial problem anchored in the emerging new economic urban landscapes in Greek cities caused in the Crisis Period. The concepts of shrinking cities and business demography are at the center of several current urban planning debates. In light of these debates, vacant lots are analyzed given economic terms but have been plagued by little consensus on their contextualize relationship with urban morphology. Managerially, this study offers insight into a triangle methodological framework structured on surveying, portraying, and documenting economic shrinkage. Responds to this challenge, we analyze the economic transformation based on economic and spatial statistics methods. In parallel, we map and categorize movement per axis of economically sound businesses during the period considered. These “flows” of businesses reveal several salient points of the function of their location which are as manifold as the vitality and the cohesion of their surrounding area. A combination of these processes reveals the ideal locus for implementing adequate regeneration and renaissance policies. This framework can act as an urban observatory of a better and dynamic understanding of the evolution of the shrinkage phenomenon. It may addresses to (i) urban planners for supporting decision-making and implication of adequate regeneration strategies toward more efficient urban planning and (ii) investors, for the evaluation and management of selected areas depending on the trends of the shrinkage phenomenon. For a better in-depth study of the issue in the future, it is important to examine the economic and spatial dimensions of urban shrinkage combined with additional parameters. Population data, income, or real estate values can be considered as indicative parameters. Nevertheless, the study of urban shrinkage is important and has gained increased attention lately. This increasing trend was further supported by the COVID-19 outbreak crisis, the lockdown measures, and their expected impact on the economy of cities or certain sectors of economic activity.
Acknowledgements
This research was generously supported by IKY (State Scholarships Foundation) Fellowships of Excellence for Postgraduate Studies in Greece-Siemens Program.