Assessment of Soil Loss in the Mirabah Basin: An Overview of the Potential of Agricultural Terraces as Ancestral Practices (Saudi Arabia) ()
1. Introduction
Nowadays, the watershed of Mirabah wadi is a real headquarters where various processes of water erosion happen starting from the first forms of ravines to the spread of mass movements and landslides. These processes are considered among the most dangerous on a global scale. Thus, in this work we intend to monitor land losses in the Wadi Mirabah basin. It is an exoreic stream belonging to the lower semi-arid domain. Wadi Mirabah and its tributaries drain an area of 28.3 km2 from the Southern slopes of Souda mountain (2800 m on the Southern slope); the slopes are That mountain (2186 m), and the Western slopes of Nahran mountain (2673 m) (Figure 1). To do so, an empirical model was chosen, that of Wischmeier, very widely used worldwide, but scarecely applied in the watersheds of the mountains of Asir (Saudi Arabia).
The Wischmeier equation will be applied with great precautions for various reasons. First, because of the criticism that was made around its application outside its field. In fact, this equation was initially designed to be applied at the plot
![]()
Figure 1. Map of the Mirabah watershed (upstream).
scale in different physical conditions. Second, because of the specificity of the region. However, although all these criticisms are based on solid arguments, its effectiveness in terms of quantification of soil losses caused by diffuse runoff is undeniable given the good results provided by many multidisciplinary researchers. This watershed was chosen for several reasons. First, because it is subjected to the spectacular action of water erosion and then because it was not studied geo-morphologically in order to quantify earth losses related to diffuse erosion. This latter, was only studied hydrologically and the focus was on its ability to cause a concentration of runoff and sometimes occasional floods that are too destructive. The growing threat of land degradation is reflected in steep slopes, the power of landforms, the low density of vegetation cover, the predominance of plastic outcrops, and the density of the river system, which is in the order of 10.5 km/km2 and it may exceed 14.5 km/km2 in some places. Despite these very eroding conditions, farmers have succeeded in integrating efficient techniques to stabilize slopes and better manage water resources.
In this context, ancestral cultural techniques that are both ecological and economical has ben developed and resulted in an efficient management of risks and resources. This translated the awareness of the inhabitants concerning the growing risk of land degradation on the slopes of Wadi Mirabah. In order to solve this erosion problem, we propose here to apply the Universal Equation (USLE) in a detailed way in order to estimate land loss during a normal year, during a humid year and also during a dry year. This would help in the optimization of the results of this empirical model on one hand and to apprehend the part of the aggression of the rains associated with the rigor of the slope in the course of the erosive processes on another hand. Nevertheless, the calculated loss only applies to the soil loss during the last three decades since the equation is based on the map of the land covered during 2018 compared to that of 2017 as well as the rainfall series used from 1978 to 2017. Concerning the previous period, the database remains incomplete and does not allow a good application of the empirical model that could have been used to compare the pace of land degradation.
2. Physical Presentation of the Watershed
2.1. Topography
The watershed of Wadi Mirabah is located West of the city of Abha. It drains with its tributaries an area of 28.3 km2. On the North side it is delimited by the Southern slopes of Jebel Souda (2800 m), from the East by Nahran mountain (2673 m) and from the West by That mountain (2186 m) (Figure 1). This watershed has a very rugged topography, prominent ridges that oppose deep and narrow valleys, but all are carved in a Precambrian basement. The ridges that emerge in projections cut the Watershed into 6 micro-basins that are different from a morphometric, hydrologic and hydrological point of view. The cutting into sub-basins will make it possible to identify emitting sectors in sediments.
2.2. Geology
The watershed of the Mirabah wadi is largely formed by outcrops of volcanic rocks (granite, basalt and Jabbro…) and metamorphic rocks (mainly marble and shale which is very localized and discontinuous) associated with some outcrops of sandstone sedimentary rocks. The intrusions of volcanic rocks are very old of Precambrian age, sometimes massive, generally faulty and dislocated. In fact, new clay constituents of the gibbsite, illite and smectite types were produced from granite following the very early preferential alteration of feldespath. These rocks are considered among the least unstable elements on the slopes, especially the steeper slopes. In addition, the gradual weakening of the granitic basement is explained by the old erosive action that was preceded by a long period of mechanical and chemical weathering associated with a high density of faults and cracks. This situation has allowed, over time, the preferential intrusion of precipitation waters to further destabilize the overlying heterogeneous rocky compartments.
2.3. Morphometry and Hydrological Indices of the Watershed of Wadi Mirabah
Morphometric and hypsometric indices as well as the competence of the hydrographic network are considered among the primordial factors involved in the current erosive dynamics. As a result, the watershed area shows very favorable morphometric and topographical conditions for the concentration of runoff water estimated at one hour and 29 minutes according to Giandotti’s formula. As a result, the watershed area shows very favorable morphometric and topographical conditions for the concentration of runoff water estimated at one hour and 29 minutes according to Giandotti’s formula.
We have chosen this formula, because of its efficiency in the prediction of floods in the mountain basin. It was customized for use in agricultural watersheds [3]. Because the Mirabah basin is largely rural, we decided to choose this equation in order to determine and to measure the response basin to a rain event. Referring to Giondotti formula, the time needed for water to flow between the upstream and the basin outlet is calculated as follows [3]:
With:
A = Area of the basin in km2;
J = slope m/m;
L = Length of the main basin in km.
Thus, the concentration of runoff can turn in a very short period of time into a real flood since the majority of torrents leave the very high areas in the form of flush. Referring to the general hypsometric curve, the difference in elevation, the specific altitude difference, the average altitude and the overall slope index, this watershed shows a very strong relief and a clearly collected shape with a compactness index of the order from 1.128 (Table 1 and Figure 2). One of the criticisms of the Universal Earth Equation (USLE) that it does not take into account the hydric and hydrological aspects involved in the manifestation of erosive processes, yet they can determine the violent behavior of rivers that are responsible for the mobilization of impressive amounts of sediment on the impluviums, especially the least developed ones.
The situation is even more complex if sub-watersheds are considered (Figure 3). A more detailed study of the different tributaries will make it possible to determine the share of each sub-watershed in the mobilization of sediment salong the impluviums.
Two clearly individualized groups of sub-watersheds were identified. The first group includes the two upstream sub-watersheds with a rigorous hypsometric curve, a strong relief, and steep rock faces (Figure 4). These conditions are capable of generating waterfalls and a torrential flow, especially during occasional heavy rains.
The other four sub-basins of the middle and lower reaches are the least contrasted and the least rugged and the most elongated (Figure 4 and Table 2). The
![]()
Table 1. Morphometric and hydrologic parameters of Mirabah wadi.
Source : Personal work based on the topographic map of Abha at 1/250,000.
![]()
Figure 2. Hypsometric curve of the watershed of the Mirabah wadi with a strong slope break.
![]()
Figure 3. Sub-basins map of Mirabah Wadi.
![]()
Figure 4. Hypsometric curves classification of the sub-watersheds of the Mirabah. Source: Personal work based on the topographic map of Abha at 1/250,000.
watershed has an average slope of 36.5˚ the strongest slopes are the most widespread. About 70% of the total area is marked by steep slopes that vary between 24˚ and 62˚ and 20% of the area with very steep slopes is between 62˚ and 88˚. However, the representation of the weakest slopes with values lower than 9˚ is very little on the upstream course of the Mirabah wadi (Figure 5). It should always be noted that the slope acts not only by its rigor but also by its length and especially by its shape. The sides with a convex slope, in particular without a sufficiently thick colluvial mantle, are considered among the most privileged sectors for the opening of multiple channels and the development of small gullies [1] - [6]. The contrast is more pronounced given the situation in the sub-watersheds in terms of their ability to cause catastrophic floods.
2.4. Aspects of Vegetation
For the most part, the watershed is occupied by an old scrub or degraded forest vegetation cover. Dense on the high slopes and sometimes in the form of bushy tufts two meters high. In majority of the foothills, a mixture of deciduous trees
![]()
Table 2. Morphometric and hydrologic parameters in different sub-basins of Mirabah Wadi.
Source: Personal work based on the topographic map of Abha at 1/250,000 with Arc Gis program.
![]()
Figure 5. Frequency slopes in the Mirabah basin. Source: Resultats of geotraitement of the MNT under Arc Gis.
predominates, inclouding the Juniper which occupies the wettest slopes [7] [8] [9]. Deep soils with a balanced texture can significantly maintain a moisture content largely sufficient for the plant cover, formed by Juniper in the first place and oleasters and prickly pear in the second place (Photo 1 and Photo 2).
However, it should be noted that this vegetation cover is in a very serious state of degradation due to the persistence of long dry periods [10] and the irresponsible behavior of the inhabitants who have largely exploited their wood in the construction of the roofs of traditional houses. Slaughtering and devastating
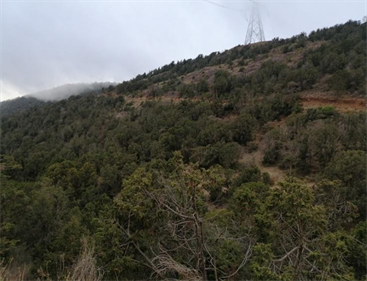
Photo 1. Natural vegetal cover in Mirabah basin predominantly Juniper. Source: The date taken, February, 2019.
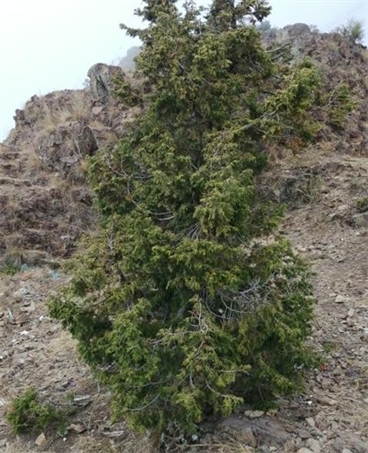
Photo 2. Natural vegetal cover in Mirabah basin predominantly Juniper. Source: The date taken, February, 2019.
herds have also led to frequent drying out of the old forest cover, which has seen a significant reduction in area in recent decades. Thus, the weight of climate change weighs heavily on this ecosystem of severe sensitivity that has prevented any regeneration of this natural vegetation cover [10] Evidence of this is the predominance of slopes strewn with desiccated juniper trees even in state protected areas. In fact, the presence of petrified Juniper trees in the heights of Hidjjaz and its surroundings at a depth of several meters proves that the paleo-climatic conditions have been more favorable than at present.
2.5. Localized Developments on the Main Rivers
Developed slopes account for less than 7% of the total watershed area. Only the proximal slopes of scattered habitats benefited from the emplacement of dry stone cords and retaining walls. Lands that are below the intensely cracked and unstable rock escarpments have attracted the attention of local actors or priority intervention. The dry stone cords are found biologically supported through certain plant species, including acacia, Tamarix and juniper. These ancestral methods were set up in order to preserve the agricultural terraces along the river of Wadi Mirabah against the resumption of certain erosive phenomena [9]. These slope techniques have a dual function both productive and preservative and are considered among the most relevant since they act positively against the adverse effects of torrential rains (Photo 3).
Through the horizontality and the flatness, the terrace allows the absorption and the good internal transfer of the water. As for the retaining walls, they favor the continuous fattening of the terraces by the decantation of overflow silt without preventing the flow of excess water downstream during occasional heavy rains. This protects better dams located further downstream against rapid siltation.
3. Application of the Universal Equation in the Wadi Mirabah Watershed to Quantify the Land Loss
It is very difficult to separate the action of diffuse erosion from that of concentrated

Photo 3. Example of the slopes of the Mirabah wadi shaped into benches. Source: The date taken, February, 2019.
erosion in the Wadi Mirabah watershed. This difficulty has its origins from the age and complexity of the erosive manifestation because of the interaction of multiple factors. The purpose of this application is far from being an exact quantification of land loss, but rather a rough approximation of areas affected by degradation and a delineation of potentially erodible areas due to the advent of stormy rains following long dry periods. Special emphasis will also be placed on the condition and behavior of agricultural lands as a function of the rate of water erosion since they constitute a heritage that is in a real threat. Thus, the interest of this research was to valorize the results of the Universal Equation to better preserve these terraces which have ensured a certain stability of the slopes. Among the criticisms made of this model is that it does not highlight the privileged areas of deposition, such as slope breaks, and the lobes of the convex meanders of rivers [11]. However, the main sources of uncertainty in the present research are mainly related to the K factor, which does not reflect the reality of the different compartments of the soil due to lack of a detailed soil map. Furthermore, several difficulties are present when carrying out certain analyzes such as the determination of physical and chemical characteristics as well as the dominant clay spectrum in the different soil compartments. Thus, the K index of soil erodibility was roughly estimated on the basis of a soil map sketch in the Abha region and some field tests. The Universal Equation of Earth Losses is expressed by the multiplication of 6 factors related respectively to the potential erosivity of the rains (R), the erodibility of the soils (K), the active slope by its length and its value (LS), land use (C) and erosion control (P). It was possible to apply the Wischmeier model thanks to a geo-processing performed under Arc Gis. In fact, all the parameters of the equation have a spatial variability but a very small temporal variability, except for the precipitation in the first place and the occupation of the soil in the second place. To take into account the variable aspects of precipitation, three scenarios were chosen. The first one for a dry year, the second one for a wet year and the third one for a normal year. The objective was to estimate the share of rainfall in the current erosive dynamics. But, as far as occupation is concerned, the comparison was not possible due to the lack of data related to the ancient land use in the region.
4. The Results of the Modeling of the Different Parameters of the USLE Equation
4.1. Factor (R): The Potential Erosivity of Rainfall
This factor defines the aggression of rainfall on the soil layer as a function of intensity, frequency, duration and spatial and temporal variability. This parameter requires a detailed rainfall analysis, but its feasibility remains dependent on the availability of measurements at the Wadi Mirabah watershed scale. Thus, due to the lack of rainfall data and an instant rainfall recorder, the modified Fournier index based on the station’s average annual rainfall was used and the average monthly rainfall for the month was the most humid. The index was expressed in a logarithmic form of 4 stations located on the edge of the watershed:
With: Pi: monthly precipitation; P: Annual rainfall.
After geo-processing under Arc Gis, the rainfall erosivity index at the scale of the large watershed was calculated according to the modified Fournier formula and interpolation was used to obtain the spatial distribution [12]. The erosivity index ranging from 5 to 24 during a normal year was used. During a wet year the index varies from 108 to 216, which proves the aggressive and torrential nature of the occasional rainfall that is occurring on the Western slopes of the Abha region.
The accentuation of this factor is always reported in the Eastern part that has the highest sectors of the zone (Figure 6 and Figure 7).
In contrast, during a normal year, this index does not exceed 24 and the rains are of the drizzle type with very fine drops and which last several days. It is a persistent and penetrating rain and it forms the useful rain which generates a
![]()
Figure 6. Erosivity rainfall in the Mirabah basin in a rainy year.
![]()
Figure 7. Erosivity rainfall in the Mirabah basin in a dry year.
few stream of water and ensures an ideal moisture of the topsoil and a better feeding of groundwater (Figure 8).
Inter-annual variability and the aggressive nature of precipitation are largely controlled by the combined effect of orographic and convection related to thermal rise. A simple observation of the daily rainfall of two stations closest to the watershed (Abha and Khamis Machit) clearly shows a more marked and undeniable frequency of heavy rains.
4.2. Factor (k): Soil Erodibility: (K in Tonnes/ha−1∙MJ−1∙mm−1 ha/year)
This factor expresses the vulnerability of the soil through the potential suitability of each soil compartment to be eroded by rain. This ability depends on the physical and chemical properties of the soil (grain size, structural stability, porosity, organic matter content) [13] [14] [15] [16]. Following the complexity in
determining this index, Wischmeier proposed a nomogram to evaluate this index more accurately.
![]()
Figure 8. Erosivity rainfall in the Mirabah basin in a normal year.
This approach, which required exhaustive sampling in the different soil compartments of the watershed, was not possible because of several logistical constraints. For this reason, the estimation of this factor was made on the basis of careful observation of the 1: 250,000 Abha soil map and direct observation in the field. The map obtained shows an erodibility index varying from 0.02 to 0.1. It was extremely high in the extreme Southeast and the extreme Southwest of the basin. Furthermore, 50% of the soil compartments showed sensitivity of the order of 0.08, which was much higher than the estimated average sensitivity. Our main observation was thus, that the sectors with the highest soil losses are the areas formed by the most erodible soil types (Figure 9).
4.3. Factor (LS): Value and Length of Slope
The LS is one of the most important factors in the study area given the high elevations in this watershed and its rugged topography. At its very high slope, the value of the flow of water is greater than that of the watershed. The calculation of the factor and its spatial representation was a preliminary pretreatment in two stages. The first was the development of DEM, which has been used to obtain the
![]()
Figure 9. Slope map of the Mirabah basin.
slope map (Figure 10). The second step consisted of a division of the different sections of the streams in the direction of the flow to complete the length of each pixel obtained. Each pixel had a length and an angle of inclination. The different values obtained by pixel defined the spatial distribution of the final factor (LS) as defined by Wischmeier (Figure 11).
4.4. Factor (C): The Index of Land Occupation
It is a key factor that integrates the effects of vegetation cover and the effects of agricultural and agro-sylvo-pastoral practices. The values of this index were based on vegetation type and crop type, recovery rate, stage of vegetation development, rate of organic residues maintained on the soil surface, land use patterns, plowing techniques and different aspects of grazing. The less accessible highlands are left for the natural vegetation dominated mainly by juniper. The rest of the slopes proximal to the inhabitants are shaped into terraces of culture on both sides of the main watercourse of Mirabah.
These terraces are associated with biological techniques and dry stone cords to ensure better preservation of cultivable lands depending on the place. After
![]()
Figure 10. LS factor map in the Mirabah basin.
modeling this factor, it turned out that the vegetation cover showed a very weak protection of the slopes in the downstream part of the watershed (Figure 11).
In the areas located on both sides of the main watercourse but also in areas with a very high density of drainage. Whilst, the protection seemed to be ideal on the high slopes East and Northeast, this may be explained mainly by the high density of vegetation cover.
4.5. Factor (P): Means of Protection of the Watershed
The spatial representation of this factor was made with reference to geo-referenced 2018 Google Earth images and careful observation of the terrain. The values of this index varied from 0.01 on the best protected slopes and 1 on the least protected ones (Figure 12). All slopes overlooking the main valley are shaped into benches supported by dry stone cords and retaining walls. The index increases to its maximum 1 on the slopes devoid of all means of defense against water erosion.
5. Results of Assessment Soil Loss and the Functional Impact of Agricultural Terraces
Once all the terms of the equation were computed and converted to raster
![]()
Figure 11. Map of C factor value in the Mirabah basin.
format, it was then possible to multiply the six-raster layers to have the spatial distribution of the land loss. Nevertheless, our results and figures should be interpreted with great caution. Indeed, there are many reservations towards the use of this equation outside its original scope of application where the local physical conditions were totally different from those of our field of study.
We must always clarify when these measurements are not sufficiently argued in the various researches. The choice to make three modelizations had as objective a better valorization of the contribution of this equation in relation with the strong variability of the rains. The three maps obtained from the soil loss showed a similar spatial distribution between dry years, wet years and normal years. This same spatial configuration can be explained by the rainfall gradient from Northeast to Southwest under the influence of orography, always in the same direction as during a dry or humid year.
As a result, the lands most threatened by the highest losses were those on the main watercourse of Mirabah Wadi, a little more on its right bank and around the descendant tributaries of That mountain. During a normal year the highest losses reach 78 tons/hectare/year (Figure 13). The most serious losses can reach
![]()
Figure 12. Map of P factor value in the Mirabah basin.
150 tons/hectare/year during a wet year and only 50 tons/hectare/year during a dry year (Figure 14 and Figure 15).
It turned out thus, that the aggressiveness of the rains and the steepness of the slope were at the origin of the strong degradation of the lands. These two factors occur in a combined way mainly in areas with a sandy texture and which is easily prepared for the mechanical actions of water erosion (shearing and undermining) (Photo 4).
Also, to the different aspects of the climatic changes, which are confirmed from one decade to another despite the ambiguities, and uncertainties that still linger on this subject. However, the threat is even less worrying in the terraces of ancestral cultures located on both sides of the main stream. The most affected sectors are the slopes not exploited by the farmer society, mainly the steeper slopes and the less benefiting from the protective works.
This implies that there is a good preservation of ancestral cultural practices by the farmers and a good maintenance of this agricultural heritage. It should be noted that more than 85% of the total area of terraces is considered stable and only 15% of this area is affected by processes of water erosion to different degrees,
![]()
Figure 13. Soil loss during a normal year in the Mirabah basin.
including the terraces on the banks of the tributaries of the course upstream of Mirabah wadi (Figure 16).
The maintenance of these ancestral techniques will significantly reduce the premature clogging of the Mirabah Dam, located further downstream. It is considered also the best rainwater harvesting technique in the southwest of Saudi Arabia. But many of them are very worn and poorly maintained which was originally of dieback of Juniperus Procera on certain slopes of Souda mountain [8] and also Mirabah basin.
To achieve slope stability, a participative strategy must be carried outas quickly as possible in Mirabah basin aims to rehabilitate terraces and implement rainwater harvesting techniques.
6. Conclusions
At the end of this work, we have been able to study the potential sensitivity of the watershed. The results of the modeling, done three times for three different years of rainfall, confirm that we are in the presence of a watershed of high sensitivity to water erosion. All the synthesis maps are a document of help to the
![]()
Figure 14. Soil loss during a rainy year in the Mirabah basin.
![]()
Figure 15. Soil loss during a dry year in the Mirabah basin.
![]()
Photo 4. Signs of soil degradation in the upstream portion of the Mirabah basin. Source: Shooting date February, 2019.
![]()
Figure 16. State of degradation in the agricultural terraces in the Mirabah basin.
local actors in order to develop a participatory planning policy more adapted to the local particularities. However, this quantification of land loss based on an empirical model is only a preliminary test, but not exhaustive in that it does not cover the problem of land degradation in its various facets. Only pickling and small scratches affecting the soil film have been taken into consideration.
As a result, it has not been possible to develop a more precise knowledge of the part of the other erosive mechanisms engendered by concentrated flow and mass movements. But also, on the loss of soil before the seventies and the lack of rainfall measures specific to the study area. In addition, this equation does not take into account the interactions between the intervening factors. It comes in the form of a product and involves the various factors by their statistical weight and not by their causal link and according to their inter-annual variability. Therefore, it should be used with caution without trying to extrapolate it systematically.
However, we have to mention that land degradation is not limited to the superficial action of runoff since mass movements’ landslides and solifluxions also have a role of capital importance. A more detailed and closer-to-reality quantification based on multiple models will be required to obtain a comprehensive, qualitative and quantitative approach to the erosive manifestation that has affected one of the oldest pedestals in the world. At present, plutonic and metamorphic rocks have been exhumed to enormous depths under the effect of the long erosion process but without neglecting the effects of neotectonic alterations.
Acknowledgements
The authors extend their appreciation to the deanship of scientific research at King Khalid University.