The Impact Factors of Thai Jasmine Rice Export to International Market ()
1. Introduction
Asia is the key resource of rice production in the world because Asian livelihood is highly dependent on rice for food and economics. Over 90 percent of rice production in the world is produced and consumed in the Asia-Pacific region (Krishnapong, 2017). Most of the rice production is mainly for domestic consumption. The major rice exporter is Thailand, India, and Vietnam. Currently, Thailand has 78.99 million rai of rice plantation area nationwide, which yields annual paddy output of 30 - 32 million tones or equivalent to 20 million tons of rice (OAE, 2016). Thailand is the world’s top of rice production base and export to other countries worldwide (Krishnapong, 2017). Thai Hom Mali rice or Jasmin rice became the world-renowned rice. In 2017, Hom Mali rice picked up the world’s best rice 2017 winner at the eight World Rice Conference (Bangkok post, 2017). According to the rice trade situation in Thailand from 2015 to 2019 showed in Table 1 it is found that Thailand export rice value in 2015 is 1,477,869 tons and decreased to 1,336,238 tons in 2016 and increased continually in 2017-2019 (1,385,027, 1,535,633, 1607, 356 tons, respectively) (Information Technology and Communication Center Ministry of Commerce, 2020).
Although Thai rice export value has been increasing, Thailand still is a second of rice production volume in the world (Ma, 2018).
According to the report, Thai Jasmin rice trends to be positive. It is an interesting issue to study the impact factor affecting export value to maintain the export market and to find out the recommended policy to develop Thai rice export in international market.
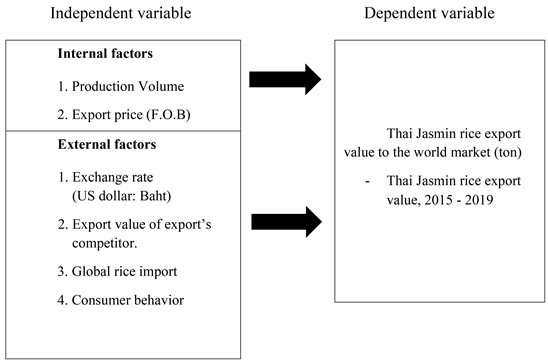
2. Research Conceptual Framework
3. Research Method
3.1. Collecting the Data
The data used in this study include:
1) Secondary data: the data based on rice export value and trade situation of rice in Thailand and the keys competitors in the world and Chinese market.
![]()
Table 1. Thai jasmin rice export quantity, 2015-2019.
Source: Information and Communication Technology Center, Office of the Permanent Secretary Ministry of Commerce, Thailand.
2) Statistical Data: trade statistics and also the specific statistical data in rice export.
Both secondary and statistical data are collected from the government and private department, International Trade Center, The United Nations Bank and Agriculture Organization (FAO), and The Association of Rice Exporters, etc.
3.2. Statistical Analysis
The collective data are analyzed by the SPSS program to perform a Multiple Linear Regression analysis to find the relationship between the dependent and independent variables (Lind, Marchal, & Wathen, 2008). The dependent variable divided into internal and external factors. Internal factors include production volume and export price (F.O.B) and external factors include exchange rate, export value of export’s competitor, global rice import and consumer behavior. The independent variable is Thai Jasmin rice export value to the world market.
In the model summary table, the table provides R and R Square to measure the quality of the prediction of the dependent variable and the proportion of variance in the dependent variable which can be explained by independent variables.
In this research is interested in statistical significance of each of the independent variables. If p < 0.05, the study can conclude that the coefficients are statistically significantly different to zero. It means that there is a significant correlation ship between dependent and independent variables. The p-value is located in the “sig.” column.
3.3. Inferential Statistics
Multiple Linear Regression—the statistical procedure to predict the values of a response (dependent) variable from a collection of predictor (independent) variable values—is used in this research to model the relationship between the internal and external factors and also the marketing mix factor and Thai Jasmin rice export value in 2015-2019.
4. Results
4.1. An Analysis of Multiple Linear Regression between Internal Factors and Thai Jasmin Rice Export Value in 2015-2019
The result revealed that internal factors regarding production volume and export price can explain 30.8 percent (R2 = 0.308) of variation in Thai Jasmin rice export value. The Standard Error of Estimate (SEE) is 26119.99625.
Considering in Table 2 showed that sig of Thai Jasmin rice production volume is 0.039 (sig. 0.039 < 0.05). It is indicated that there is a significant correlation ship between rice production volume and rice export value as per the hypothesis.
Sig of export price is 0.033 (sig. 0.033 < 0.05). It is indicated that there is a significant correlation ship between export price and rice export value as per the
![]()
Table 2. The multiple linear regression analysis results between internal factor and Thai Jasmin rice export value, 2015-2019.
R2 = 0.308, Adjusted R2 = −0.087, S.Eest = 26119.99625, F = 0.779, sig. 0.573.
hypothesis.
An equation for the relationship is:
Thai Jasmin rice export value = 206546.962 + 17646.572 (Thai Jasmin rice production volume) + 13,083.828 (export price).
It can conclude that both production volume and export price influence Thai Jasmin rice export value.
4.2. An Analysis of Multiple Linear Regression between External Factors and Thai Jasmin Rice Export Value in 2015-2019
The result revealed that external factors regarding exchange rate, export value of exporting competitors, and consumption behavior can explain 51.8 percent (R2 = 0.518) of variation in Thai Jasmin rice export value. The Standard Error of Estimate (SEE) is 21792.04430.
Considering in Table 3 showed that sig of exchange rate is 0.046 (sig. 0.046 < 0.05). It is indicated that there is a significant correlation ship between exchange rate and rice exportvalue as per the hypothesis.
Sig of export value of exporting competitors is 0.021 (sig. 0.021 < 0.05). It is indicated that there is a significant correlation ship between export value of exporting competitors and rice export value as per the hypothesis.
Sig of rice import value in the world market is 0.040 (sig. 0.040 < 0.05). It is indicated that there is a significant correlation ship between rice import value in the world market and rice export value as per the hypothesis.
Sig of consumption behavior is 0.035 (sig. 0.035 < 0.05). It is indicated that there is a significant correlation ship between consumption behavior and rice export value as per the hypothesis.
An equation for relationship is
Thai Jasmin rice export value = 326225.170 + 9974.886 (exchange rate) + 33021.862 (rice import in the world market) + 10692.170 (export value of exporting competitors) + 52326.838 (consumption behavior).
According to the equation can explain that the regression coefficient (B) is 52326.838 it means that if the consumption behavior increase 1 unit the export value will increase 52326.833 unit. It can conclude that external factors includes
![]()
Table 3. The multiple linear regression analysis results between external factor and Thai Jasmin rice export value, 2015-2019.
R2 = 0.518, Adjusted R2 = −0.243, S.Eest = 21792.04430, F = 1.884, sig. 0.218.
exchange rate, export value of exporting competitors, rice import value in the world market, and consumption behavior influence Thai Jasmin rice export value.
4.3. An Analysis of Multiple Linear Regression between Internal and External Factors and Thai Jasmin Rice Export Value in 2015-2019
The result revealed that internal and external factors can explain 79.9 percent (R2 = 0.797) of variation in Thai Jasmin rice export value. The Standard Error of Estimate (SEE) is 21592.71187.
Considering in Table 4 showed that sig of Thai Jasmin rice production volume is 0.025 (sig. 0.025 < 0.05). It is indicated that there is a significant correlation ship between rice production volume and rice export value as per the hypothesis.
Sig of export price is 0.032 (sig. 0.032 < 0.05). It is indicated that there is a significant correlation ship between export price and rice export value as per the hypothesis.
Sig of exchange rate is 0.045 (sig. 0.045 < 0.05). It is indicated that there is a significant correlation ship between exchange rate and rice export value as per the hypothesis.
Sig of export value of exporting competitors is 0.047 (sig. 0.047 < 0.05). It is indicated that there is a significant correlation ship between export value of exporting competitors and rice export value as per the hypothesis.
Sig of rice import value in the world market is 0.040 (sig. 0.040 < 0.05). It is indicated that there is a significant correlation ship between rice import value in the world market and rice export value as per the hypothesis.
Sig of consumption behavior is 0.043 (sig. 0.043 < 0.05). It is indicated that there is a significant correlation ship between consumption behavior and rice export value as per the hypothesis.
![]()
Table 4. The multiple linear regression analysis results between internal and external factor and Thai Jasmin rice export value, 2015-2019.
R2 = 0.797, Adjusted R2 = −0.257, S.Eest = 21,592.71187, F = 1.475, sig. 0.410.
An equation for relationship is:
Thai Jasmin rice export value = 591042.750 + 29611.293 (Thai Jasmin rice production volume) + 27531.023 (export price) + 15792.051(exchange rate) + 11048.795 (rice import in the world market) + 3653.491 (export value of exporting competitors) + 40843.639 (consumption behavior).
According the study result can conclude that there is a strong correlation ship between internal and external factors and Thai Jasmin rice export value in 2015-2019.
In conclusion of internal factors influencing Thai Jasmin rice export value to the world market, according to an analysis from Table 2 found that independent variable of Thai Jasmin rice production volume in the multiple linear regression equation showed 0.039 of sig value and sig value of export price is 0.033 which is lower than 0.05. It indicated that production volume and export price influence export value.
Moreover the equation showed the regression coefficient (B) which are 17646.572 and 13083.828, respectively, it means that if the production volume increases 1 unit the export value will increase 17646.572. Similarly, if the export price increases 1 unit, the export value will increase 13083.828 unit. While, the others dependent variable in external factors did not show in the equation. It means that there is no significant correlation ship.
The conclusion of external factors influencing Thai Jasmin rice export value to the world market, according to an analysis from Table 3 found that independent variable of exchange rate in the multiple linear regression equation showed 0.046 of sig value, and the sig value of export value of exporting competitors, import value in the world, and consumption behavior are 0.021, 0.040, and 0.035, respectively, which are lower than 0.05. It indicated that exchange rate, export value of exporting competitors, import value in the world, and consumption behavior influenced export value. In addition, the equation showed the regression coefficient (B) which is 52326.838. It means that if the consumption behavior increases 1 unit, the export value will increase 52326.838. The equation also showed the standardized regression coefficient (β) which is 0.927 that conform to the observation result from Jasmin rice exporter which express that most of the consumer demands to consume Jasmin rice the most.
5. Conclusion and Discussion
From the empirical result of this research it can conclude that the factors affecting Thai Jasmine Rice export vale are as follow; the expected result in relationship between export price and export value, implying that the increase in export price decreases export value which is corresponded with Xu, 2016. Thailand is facing with the high competition in rice export with some exporter such as China and Vietnam which have the lower export price. Since China is the largest rice producing country; the remaining of domestic consumption is export. Sonthaya, 2016 also reported that Vietnam’s comparative advantage grew stronger during this period (driven by high market share and retention rates), while Thailand did not grow as fast because of the lower price of export which is corresponed with Pisanwanich, 2011 who studied A Comparison of Rice Production and Trade Competitiveness between Thailand and Vietnam in the ASEAN Market. Similarly, exchange rate implied that exchange rate has affected the movement of Thai Jasmine rice export value with high confidence interval statistics testing. According to the theory mentioned in the previous study by Zheng (2017), demand in agricultural products export was inelastic. When the value of bath decreases (exchange rate goes up), price went down but the export value did not go up more. This is corresponded with Sirikul, Chanchai, and Somchai (2017) who found that exchange rate has a negative effect on Thai rice export value. Moreover, the result also showed that the consumer behavior has the significant with export value. It implied that the increase of consumer demand increases the export value. China is the biggest rice consumption in the world and is the main import market of Thailand. Thai rice quality is very good, long grain, very popular with the Chinese and Thai rice has long been familiar to Iranian consumers. Although Thai rice is more expensive than Vietnamese rice, Iran still maintains a certain number of rice imports. However, the major of Thai rice consumer is with high income who prefer the high quality of rice. It means rice price is involved with consumption demand. Bunyasiri & Sirisupluxana (2017) studied consumer’s behavior and rice attributes for Thai Jasmin rice, and reported that the main reason for buying Thai rice is the taste of Thai rice. It is also found that those Thai rice buyers are having comparatively high income and education, and having higher degree of joyful lifestyle, especially, for those younger and labor productive age group between 26 and 35 year old. Thus, Thai rice target group would be young consumers and consumers with more income and more year of education.
Implementation: The result indicated that the export price and the value of the Baht depreciation had strong negative relationship with Thai rice export. It means that the rice production should be well organization of raw material and closely on exchange rate fluctuation and use it to forecast the demand when the currency changes. Furthermore, the trader should make the consumer trust in rice product to provide the actual experience in eating and testing of Thai Jasmin rice to enhance Thai rice market share.
6. Limitation
This research does not take on to the other economic indicators such as inflation rate, capital inflow, trade in import, and etc. which are able to affect the export value. The time period of this research is also not long enough to present all changes and fluctuations in Thai rice export that Thailand used to have.