1. Introduction
Nanostructured materials are currently receiving wide attention due to their special optical, electronic, magnetic, chemical, physical and mechanical properties [1-5]. Semiconductor nanocrystals have been widely studied for their fundamental properties, especially titanium dioxide (TiO2). Nanosized titanium dioxide materials have been the focus of great interest because they exhibit modified physical-chemical properties in comparison with its bulk [5,6]. Inexpensiveness, excellent chemical stability nontoxicity, high photo-catalytic property, a wide band gap and high refractive index of TiO2 make it attractive for practical applications [7,8]. The uses and performance for a given application are strongly influenced by the crystalline structure, the morphology and the size of the particles [5].
The optical and electronic properties of nanostructured TiO2 can be tailored by a variety of measures, including thermal treatments [9], supported film growth [10], and metal-ion doping [11]. In particular, doping with lanthanide metal ions, such as neodymium (Nd3+), has been shown to increase the photocatalytic efficiency for selected reactions [12-14]. Therefore, it is critical to assess the effects of lanthanide-ion doping on the structure of titania which will allow greater control over the desired properties. The effective ionic radii of Ti4+ and Nd3+ are 0.605 and 0.983 Å, respectively [15]. Therefore, any substitution of a neodymium ion for a titanium ion in the TiO2 lattice would introduce a distortion. Burn et [14] show that a distortion occurs only along the c-axis of anatase TiO2 with a maximal distortion at 0.1 mol% Nd3+ and no further response at higher concentration. This is due to a combination of interstitial and substitutional accommodation of the dopant ions. The interstitial neodymium does not affect the charge balance in the anatase lattice, as a substitutional neodymium does. Thus, interstitial dopants do not affect the photocatalytic properties of the nanoparticles since they cannot act directly as trapping sites to enhance the carrier lifetime.
Sol-gel process is one of the most successful techniques for preparing nanocrystalline metallic oxide materials due to low cost, easy of fabrication (flexibility) and low processing temperatures [3-6]. Generally, in a typical sol-gel process, a colloidal suspension or a sol is formed due to the hydrolysis and polymerization reactions of the precursors, which are on complete polymerization and the loss of solvent leads to the transition from the liquid sol into a solid gel phase. The wet gel can be converted into nanocrystals with further drying and hydrothermal treatment [16,17].
2. Experimental
2.1. Samples Preparation
The doped and un-doped titania nanoparticles were synthesized by sol–gel method from Titanium (IV)-isopropoxide (TTIP) (Aldrich 98%), Ethanol (EtOH 99.9%) from GCC, hydrochloric acid (HCl, 34.5%) from BDH and neodymium (III) acetylacetonate hydrate (Aldrich). Deionized water was used for the hydrolysis of (TTIP) and preparation of pure and doped TiO2 sol. The final solution was left for 30 minutes under magnetic stirring. The reaction was performed at a cooler water jacket (i.e. the solution was cooled by water at temperature (10˚C - 1˚C). The amount of each chemical in this procedure was TTIP:H2O:EtOH:HCl = 1:1:10:0.1 in molar ratio. The gelation of monoliths was achieved by pouring the sol into covered glass tube at room temperature. After aging for 24 hour, first drying occurred for 1 hour at temperature 60˚C. Then samples left in room temperature without covers in order to permit solvent evaporation through the drying process. The doping rate of samples with Nd3+ equal to: 0%wt, 5%wt, 7%wt and 12%wt.
2.2. Samples Characterization
All samples were calcinated for 2 hour in a box furnace operating at 500˚C in an ambient atmosphere. Structural characterizations of the doped and un-doped TiO2 samples were done by X-ray diffraction (XRD). θ-2θ scans were recorded using ITAL-STRUCTURE diffractometer equipped. While Mid-IR spectra were obtained for the prepared samples using FT-IR spectrometer, Shimadzu, on KBr pellets of the samples.
3. Result and Discussion
X-ray diffraction analyses show that prepared samples have amorphous structure turned to anatas polycrystalline structure after annealing process [14,17].
The FTIR spectrums were illustrated in Figures 1 and 2 for the samples before and after annealing process respectively. The peaks at 667 cm−1, 505 cm−1 and 447 cm−1 are attributed to Ti-O bond. The peak at 667 cm−1 refers to symmetric O-Ti-O stretch while peak at 447 cm−1 and 505 cm−1 are due to the vibration of Ti-O bond [18-20]. Another two bands were appeared at about 1600 cm−1 and 3400 cm−1. These two absorption bands are attributed to the characteristics vibration of O-H bond in water molecules [20,21], and indicating that the drying process at 60˚C dose not completely trap the water molecules from the pores of titania network. After annealing process at 500˚C the last two absorption bands were disappeared from FTIR spectrums (Figure 2).
The important result that could be seen from the FTIR spectra is the existence of transmission peak centered at around 1200 cm−1. Annealing process at 500˚C improves the transmission rate of this peak. Further more, doping with Nd3+ ion makes this peak so much strong and become the only major peak could be observed from the FTIR spectrums in range of 4000 cm−1 to 400 cm−1, Figure 2. This result gives a good indication in direction of production of optical band-pass filter around the wavelength 8.34 µm (~1200 cm−1). The effect of doping rate on amplitude, FWHM of the band width and maximum peak wavelength is summarized in Table 1.
From Table 1, it can see that the two parameter transmission rate and FWHM are increase with increasing of doping rate. That means the two parameters affected with the amount of doping rate with no matter to interstitial and substitutional of accommodation of the dopant ions. While the maximum of transmission peak shifted with increasing of doping at the lower doping rate then become stable at higher concentration. That’s mean the peak shifting depend on substitutional neodymium. Because doping with high rate prompt the interstitial neodymium more than substitutional neodymium [14].
4. Conclusions
Both of annealing process and doping with Nd3+ increase the photocatalytic efficiency of nanoparticles TiO2 through

Figure 1. FTIR spectrums for samples before annealing process. TiO2 doped with 5%wt Nd. Pure TiO2.
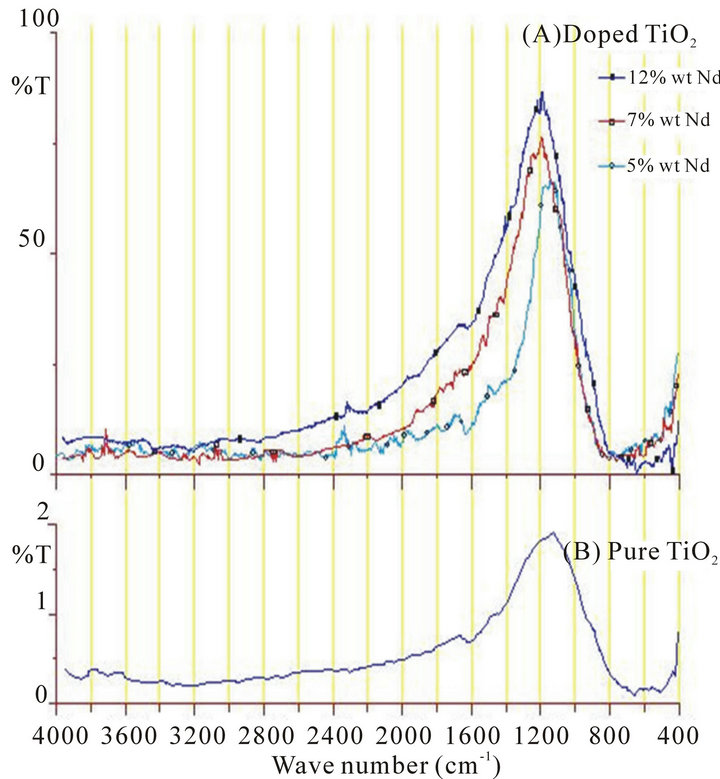
Figure 2. FTIR spectrums for samples after annealing process. (a) Nd:TiO2 with different doped rate; (b) Pure TiO2.
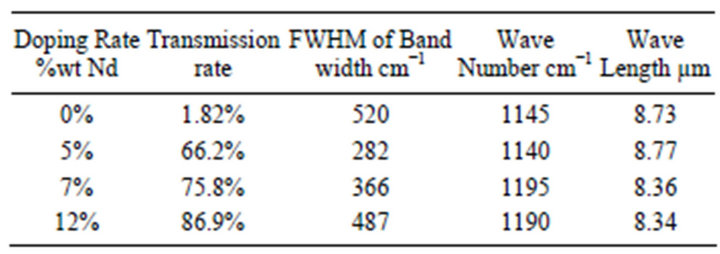
Table 1. Transmission peak parameter for Nd:TiO2 samples after annealing process.
the enhancement of the transmission rate at the wave number around the 1200 cm−1.
The transmission rate and the bandwidth of transmission peak at wave number around 1200 cm−1 increases with the increasing of doping rate.
The maximal of the transmission peak shifted with increasing of Nd3+ concentration at the lower doping rate then become stable at higher concentration.
FTIR spectra gives a good indication in direction of preparation of optical band-pass filter at a wavelength around 8.34 µm (~1200 cm−1).